2QFY2016 Result Update | Banking
November 20, 2015
Canara Bank
NEUTRAL
CMP
`270
Performance Highlights
Target Price
-
Particulars (` cr)
2QFY16 1QFY16
% chg (qoq) 2QFY15
% chg (yoy)
Investment Period
-
NII
2,647
2,517
5.2
2,368
11.8
Pre-prov. profit
1,944
2,004
(3.0)
1,626
19.6
Stock Info
PAT
529
479
10.4
627
(15.6)
Sector
Banking
Source: Company, Angel Research
Market Cap (` cr)
14,634
Beta
1.5
In its 2QFY2016 results, Canara Bank reported a decline in PAT by 15.6% yoy,
52 Week High / Low
478/251
mainly due to higher provisions and surge in operating expenses.
Avg. Daily Volume
5,47,261
Loan book grows at a slow pace; NIM rises qoq
Face Value (`)
10
During 2QFY2016, the bank’s loan book grew by 3.9% yoy with retail loan book
BSE Sensex
25,483
growing at a faster pace at 14.3% yoy. The C-D ratio came down to 66.6% from
Nifty
7,732
67.4% in 2QFY2015. Deposits growth was muted at 5.2% yoy with CASA deposits
Reuters Code
CNBK.NS
showing momentum, which grew by 11.5% yoy. As a result, the domestic CASA
Bloomberg Code
CBK@IN
ratio for the bank rose by 178bp yoy to 25.5% as of 2QFY2016. The Reported
Global NIM rose sequentially from 2.21% in 1QFY2016 to 2.24% in the current
Shareholding Pattern (%)
quarter which aided NII growth of 11.8% for the quarter. The Management
Promoters
66.3
expects to reach 2.35% NIM by the end of this fiscal year. During 2QFY2016, the
MF / Banks / Indian Fls
19.5
non-interest income (excluding treasury) was subdued with a yoy growth of 4.4%
FII / NRIs / OCBs
7.5
yoy largely aided by recoveries from written off accounts. Treasury income, at
Indian Public / Others
6.7
`295cr, more than doubled for the quarter on a yoy basis (`144cr in 2QFY2015).
On the asset quality front, slippages came at `2,202cr (annualized slippage rate
Abs. (%)
3m
1yr
3yr
of 2.7% as compared to 3.1% in 1QFY2016). Recoveries and upgrades were
Sensex
(8.4)
(9.5)
39.0
lower at `1,261cr as compared to `2,478cr in 1QFY2016. As a result, the Gross
CBK
(21.3)
(33.3)
(36.7)
NPA ratio went up to 4.27% as compared to 3.98% in 1QFY2016, whereas the
Net NPA increased to 2.90% from 2.74% in 1QFY2016. Additionally, the bank
3-year price chart
restructured advances worth
`600cr during the quarter taking the book to
600
`29,026cr as on 2QFY2016. The Provision coverage ratio improved to 59.81%
500
from 58.68% in 2QFY2015.
400
Outlook and valuation: Canara Bank has been reporting subdued growth in its
300
profitability over the past several quarters. It has a larger exposure to various
200
stress sectors in the economy as compared to its peers. At the current market
100
price, the stock trades at 0.4x FY2017E ABV. We maintain our Neutral view on
0
the stock.
Key financials (Standalone)
Source: Company, Angel Research
Y/E March (` cr)
FY2014
FY2015
FY2016E
FY2017E
NII
8,944
9,664
10,645
11,893
% chg
13.5
8.0
10.2
11.7
Net profit
2,438
2,669
2,212
3,346
% chg
(15.1)
9.5
(17.1)
51.2
Vaibhav Agrawal
NIM (%)
2.1
1.9
2.0
2.1
022 - 3935 7800 Ext: 6808
EPS (`)
52.9
56.2
46.6
70.4
P/E (x)
5.1
4.8
5.8
3.8
P/ABV (x)
0.6
0.5
0.5
0.4
Chintan Shah
RoA (%)
0.5
0.5
0.4
0.6
022 - 4000 3600 Ext: 6828
RoE (%)
10.4
10.5
8.0
11.2
Source: Company, Angel Research; Note: CMP as of November18, 2015.
Please refer to important disclosures at the end of this report
1
Canara Bank | 2QFY2016 Result Update
Exhibit 1: 2QFY2016 performance (Standalone)
Particulars (` cr)
2QFY16
1QFY16
% chg (qoq)
2QFY15
% chg (yoy)
FY2015
FY2014
FY2013
Interest earned
11,268
11,140
1.1
10,894
3.4
43,750
39,548
34,078
- on Advances / Bills
8,126
8,101
0.3
8,005
1.5
32,066
28,457
24,380
- on investments
2,943
2,850
3.3
2,681
9.8
10,924
10,251
9,112
- on balance with RBI & others
199
189
5.1
208
(4.5)
760
731
585
Interest Expended
8,621
8,623
(0.0)
8,526
1.1
34,086
30,603
26,199
Net Interest Income
2,647
2,517
5.2
2,368
11.8
9,663
8,944
7,879
Other income
1,210
1,113
8.8
1,021
18.5
4,550
3,933
3,153
Other income excl. treasury
915
915
0.1
877
4.4
3,505
3,269
2,477
- Fee Income
222
214
3.7
224
(0.9)
928
940
797
- Treasury Income
295
198
49.0
144
104.4
1,045
664
676
- Recov. from written off a/cs
161
210
(23.3)
90
78.9
371
425
303
- Others
532
491
8.4
563
(5.4)
2,206
1,904
1,377
Operating income
3,857
3,629
6.3
3,389
13.8
14,214
12,877
11,032
Operating expenses
1,913
1,626
17.6
1,764
8.5
7,264
6,081
5,142
- Employee expenses
1,108
1,059
4.6
1,036
7.0
4,274
3,672
3,254
- Other Opex
805
567
41.9
728
10.6
2,989
2,409
1,888
Pre-provision Profit
1,944
2,004
(3.0)
1,626
19.6
6,950
6,796
5,890
Provisions & Contingencies
1,212
1,360
(10.8)
814
49.0
3,453
3,733
2,218
- Provisions for NPAs
979
1,314
(25.5)
912
7.3
3,771
2,135
1,861
- Provisions for Investments
64
133
(51.9)
(22)
(390.9)
(658)
692
(370)
- Other Provisions
169
(87)
(294.0)
(76)
(321.9)
340
906
727
PBT
732
644
13.7
812
(9.9)
3,497
3,063
3,672
Provision for Tax
203
165
23.0
185
9.7
795
625
800
PAT
529
479
10.4
627
(15.6)
2,702
2,438
2,872
Effective Tax Rate (%)
27.7
25.6
210bp
22.8
494bp
22.7
20.4
21.8
Source: Company, Angel Research
November 20, 2015
2
Canara Bank | 2QFY2016 Result Update
Exhibit 2: 2QFY2016 performance analysis (Standalone)
Particulars
2QFY16 1QFY16
% chg (qoq)
2QFY15
% chg (yoy)
Balance sheet
Advances (` cr)
3,23,077
3,24,063
(0.3)
3,10,860
3.9
Deposits (` cr)
4,85,206
4,71,877
2.8
4,61,193
5.2
Credit-to-Deposit Ratio (%)
66.6
68.7
(209)bp
67.4
(82)bp
Current deposits (` cr)
19,257
17,534
9.8
17,743
8.5
Saving deposits (` cr)
96,745
92,149
5.0
86,287
12.1
CASA deposits (` cr)
1,16,002
1,09,683
5.8
1,04,030
11.5
Calculated CASA ratio (%)
23.91
23.2
66bp
22.56
135bp
CAR (%)
11.04
10.8
29bp
10.19
85bp
Tier 1 CAR (%)
8.63
8.3
35bp
7.41
122bp
Profitability Ratios (%)
Cost of deposits
7.07
7.12
(5)bp
7.40
(33)bp
Yield on advances
10.18
10.22
(4)bp
10.69
(51)bp
Yield on investments
7.95
7.97
(2)bp
8.04
(9)bp
Yield on funds
8.30
8.28
2bp
8.77
(47)bp
Cost of funds
6.39
6.41
(2)bp
6.82
(43)bp
Reported NIMs
2.24
2.21
3bp
2.24
0bp
Cost-to-income ratio
49.59
44.80
480bp
52.04
(244)bp
Asset quality
Gross NPAs (` cr)
14,021
13,081
7.2
9,164
53.0
Gross NPAs (%)
4.27
3.98
29bp
2.92
135bp
Net NPAs (` cr)
9,383
8,888
5.6
7,170
30.9
Net NPAs (%)
2.90
2.74
16bp
2.31
59bp
PCR incl. tech. w/offs (%)
59.81
59.02
79bp
58.68
113bp
Slippage ratio (%)
2.67
3.05
(39)bp
4.22
(155)bp
NPA to avg. assets (%)
0.72
0.99
(27)bp
0.79
(7)bp
Source: Company, Angel Research
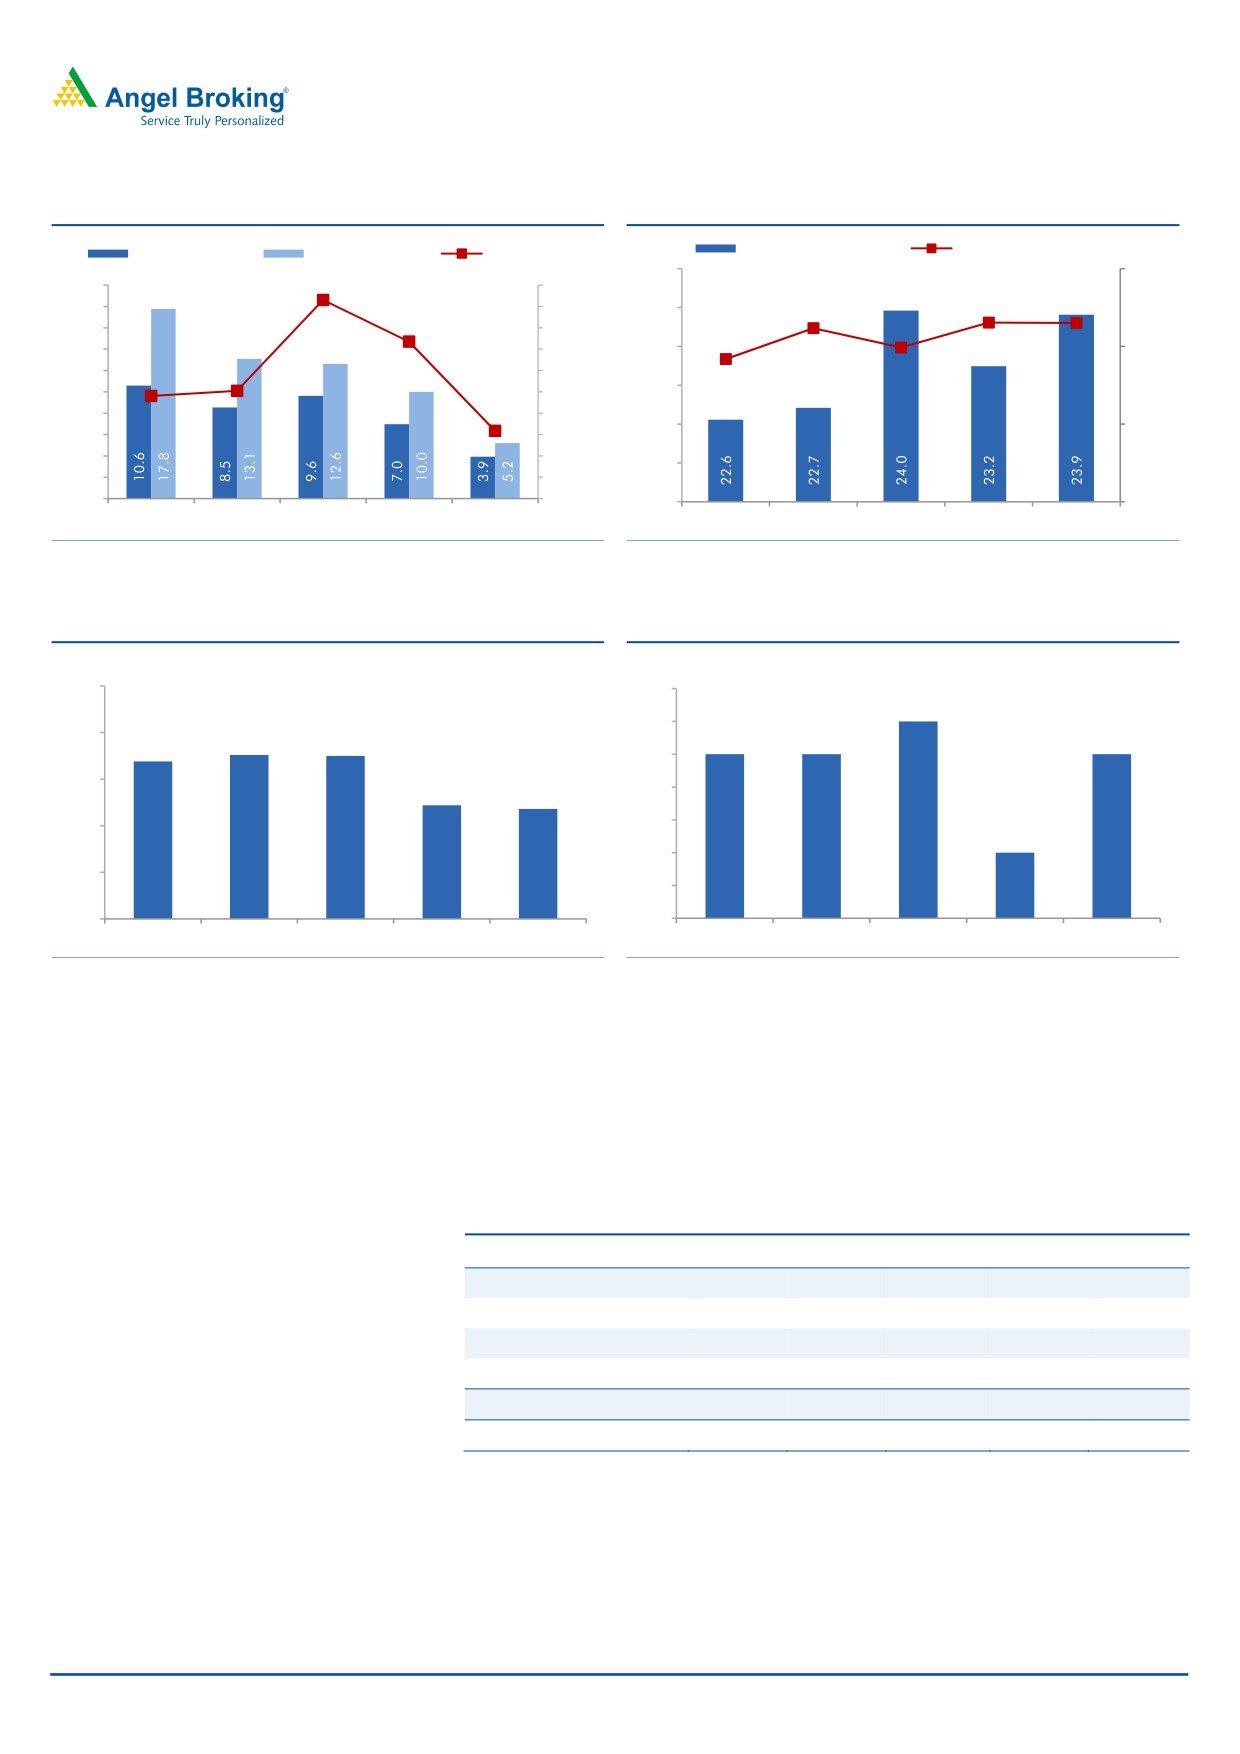
Loan book grows at a slow pace; NIM rises qoq
During 2QFY2015, the bank’s loan book grew by 3.9% yoy with retail loan book
growing at a faster pace at 14.3% yoy. The C-D ratio came down to 66.6% from
67.4% in 2QFY2015. Deposits growth was muted at 5.2% yoy with CASA deposits
showing momentum (which grew by 11.5% yoy). As a result, the domestic CASA
ratio for the bank rose by 178bp yoy to 25.5% as of 2QFY2016.
The Reported Global NIM rose sequentially from 2.21% in 1QFY2016 to 2.24% in
the current quarter which aided NII growth of 11.8% for the quarter. The
Management expects to reach 2.35% NIM by the end of this fiscal year.
November 20, 2015
3
Canara Bank | 2QFY2016 Result Update
Exhibit 3: Loan book growth slows
Exhibit 4: Calculated CASA falls sequentially and yoy
Adv. yoy chg (%)
Dep. yoy chg (%)
CDR (%, RHS)
Calculated CASA ratio
CASA yoy growth (%, RHS)
24.5
15.0
69.7
20.0
70.0
68.7
11.5
18.0
69.5
24.0
11.2
11.5
16.0
69.0
9.2
9.9
14.0
68.5
23.5
10.0
12.0
67.4
67.5
68.0
23.0
10.0
67.5
8.0
66.6
67.0
22.5
5.0
6.0
66.5
4.0
66.0
22.0
2.0
65.5
-
65.0
21.5
-
2QFY15
3QFY15
4QFY15
1QFY16
2QFY16
2QFY15
3QFY15
4QFY15
1QFY16
2QFY16
Source: Company, Angel Research
Source: Company, Angel Research
Exhibit 5: YoA falls qoq and yoy
Exhibit 6: NIM rises 3bp qoq
(%)
(%)
11.5
2.26
2.25
2.25
11
10.76
10.75
2.24
2.24
2.24
10.69
2.24
10.5
10.22
10.18
2.23
2.22
10
2.21
2.21
9.5
2.2
9
2.19
2QFY15
3QFY15
4QFY15
1QFY16
2QFY16
2QFY15
3QFY15
4QFY15
1QFY16
2QFY16
Source: Company, Angel Research
Source: Company, Angel Research
Subdued growth in non-interest income
During 2QFY2016, the non-interest income (excluding treasury) was subdued with
a yoy growth of 4.4% largely aided by recoveries from written off accounts.
Treasury income doubled for the quarter at `295cr as against `144cr for the
corresponding quarter of the previous fiscal.
Exhibit 7: ‘Recoveries’ aids strong growth in Oth. income excl. Treasury
Particulars (` cr)
2QFY2016 1QFY2016 % chg (qoq) 2QFY2015 % chg (yoy)
Fee Income
222
214
3.7
224
(0.9)
Treasury
295
198
49.0
144
104.4
Recoveries
161
210
(23.3)
90
78.9
Others
532
491
8.4
563
(5.4)
Other income
1,210
1,113
8.8
1,021
18.5
Other income excl. treasury
915
915
0.1
877
4.4
Source: Company, Angel Research
November 20, 2015
4
Canara Bank | 2QFY2016 Result Update
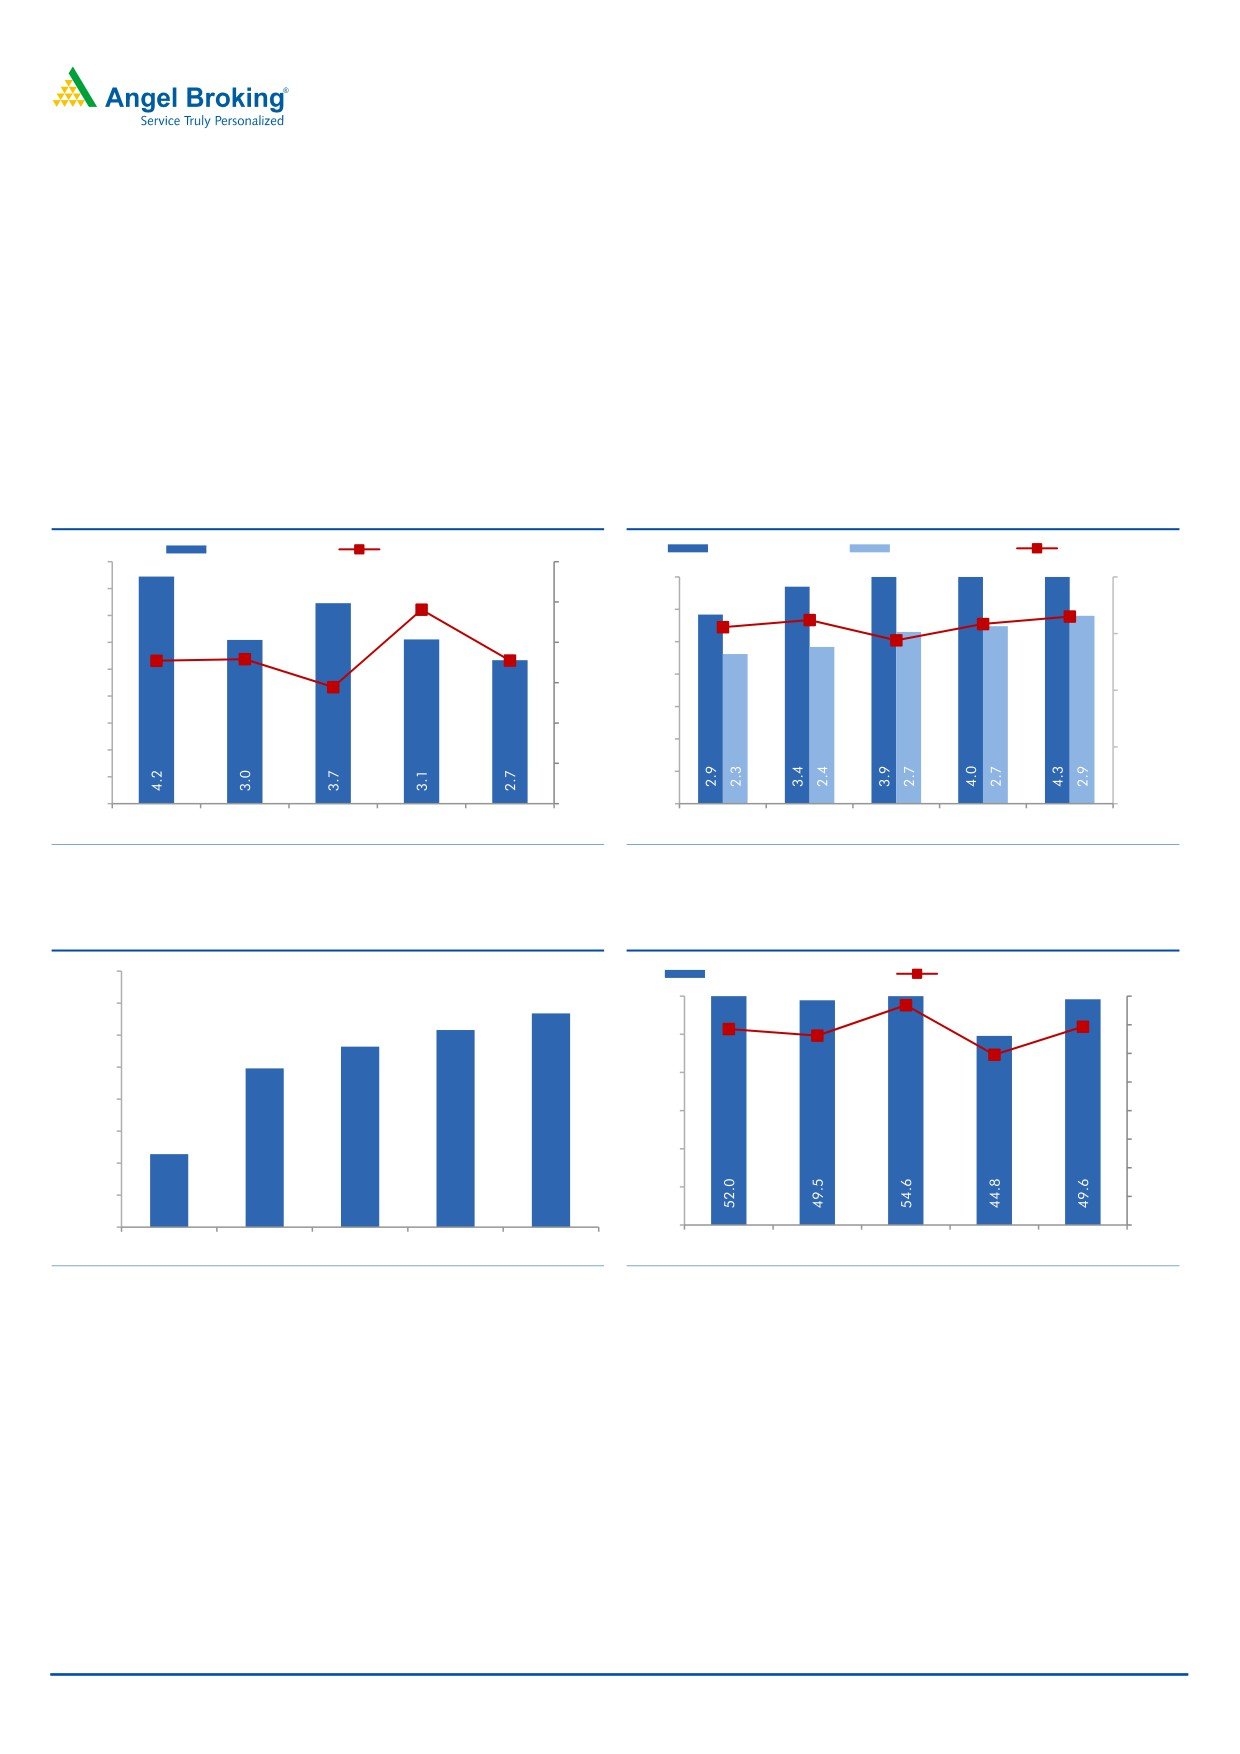
Asset quality pressures continue with surge in NPA ratios
On the asset quality front, slippages came in at `2,202cr (annualized slippage rate
of 2.7% as compared to 3.1% in 1QFY2016). Recoveries and upgrades were lower
at `1,261cr as compared to `2,478cr in 1QFY2016. As a result, the Gross NPA
ratio went up to 4.27% as compared to 3.98% in 1QFY2016, whereas the Net
NPA increased to 2.90% from 2.74% in 1QFY2016. Additionally, the bank
restructured advances worth
`600cr during the quarter taking the book to
`29,026cr as on 2QFY2016. The Provision Coverage Ratio improved to 59.81%
from 58.68% in 2QFY2015
Exhibit 8: Slippages remain moderate in 2QFY2016
Exhibit 9: NPA ratios increases sequentially
Slippages (%)
Credit cost (%, RHS)
Gross NPAs (%)
Net NPAs (%)
PCR (%, RHS)
4.50
1.2
3.5
64.0
4.00
1.0
59.8
1.0
59.4
59.0
3.0
58.7
3.50
57.3
0.7
0.7
0.7
58.0
3.00
0.8
2.5
2.50
0.6
2.0
0.6
52.0
2.00
1.5
1.50
0.4
1.0
1.00
46.0
0.2
0.5
0.50
-
-
-
40.0
2QFY15
3QFY15
4QFY15
1QFY16
2QFY16
2QFY15
3QFY15
4QFY15
1QFY16
2QFY16
Source: Company, Angel Research
Source: Company, Angel Research; Note: PCR including tech. write-offs
Exhibit 10: Branch expansion slows down qoq
Exhibit 11: Cost to income ratio declines qoq
5,800
Cost-to-income ratio (%)
Opex to average assets (%, RHS)
5,734
50.0
1.6
5,750
1.5
5,708
1.4
5,682
1.4
1.4
5,700
45.0
1.3
5,648
1.2
1.2
5,650
40.0
1.0
5,600
35.0
0.8
5,550
5,514
0.6
30.0
5,500
0.4
25.0
5,450
0.2
5,400
20.0
-
2QFY15
3QFY15
4QFY15
1QFY16
2QFY16
2QFY15
3QFY15
4QFY15
1QFY16
2QFY16
Source: Company, Angel Research
Source: Company, Angel Research
November 20, 2015
5
Canara Bank | 2QFY2016 Result Update
Outlook and valuation
Canara Bank has been reporting subdued growth in its profitability over the past
several quarters. Canara Bank has larger exposure to the various stress sectors in
the economy as compared to its peers. At the current market price, the stock trades
at 0.4x FY2017E ABV. We maintain our Neutral view on the stock.
Exhibit 12: Recommendation summary
CMP
Tgt. Price
Upside
FY2017E
FY2017E
FY2017E
FY15-17E
FY2017E
FY2017E
Company
Reco.
(`)
(`)
(%)
P/ABV (x)
Tgt. P/ABV (x)
P/E (x)
EPS CAGR (%)
RoA (%)
RoE (%)
HDFCBk
Buy
1,048
1,262
20.4
3.2
3.8
17.2
22.4
1.9
19.7
ICICIBk*
Buy
260
354
36.1
1.8
2.0
10.7
13.4
1.6
14.7
YesBk
Buy
723
921
27.3
1.9
2.4
10.4
20.5
1.6
19.6
AxisBk
Buy
464
630
35.8
1.9
2.6
10.7
18.4
1.8
18.9
SBI*
Buy
241
283
17.4
1.2
1.2
9.9
17.8
0.7
12.7
FedBk
Neutral
55
-
-
1.0
1.0
8.9
3.1
1.0
11.9
SIB
Neutral
20
-
-
0.7
0.8
6.1
21.6
0.7
11.6
BOB
Neutral
168
-
-
0.9
0.9
8.0
17.5
0.6
10.6
PNB
Neutral
136
-
-
0.6
0.6
5.0
28.5
0.7
12.0
BOI
Neutral
129
-
-
0.3
0.8
3.9
14.0
0.3
7.6
IndBk
Neutral
126
-
-
0.4
0.3
4.2
19.4
0.6
8.6
Vijaya Bank
Neutral
34
-
-
0.5
0.5
5.1
14.1
0.4
8.8
OBC
Neutral
146
-
-
0.3
0.5
3.2
65.5
0.5
9.4
Allahabad Bank Neutral
74
-
-
0.3
0.3
2.7
56.2
0.6
11.9
UnionBk
Neutral
160
-
-
0.5
0.4
4.1
18.1
0.6
11.4
CanBk
Neutral
270
-
-
0.4
0.3
3.8
12.0
0.6
11.2
AllBk
Neutral
74
-
-
0.3
0.4
2.7
56.2
0.6
11.9
IDBI#
Neutral
83
-
-
0.5
0.6
5.8
61.6
0.6
9.3
DenaBk
Neutral
41
-
-
0.3
0.4
4.1
45.6
0.4
7.9
Source: Company, Angel Research; Note:*Target multiples=SOTP Target Price/ABV (including subsidiaries), #Without adjusting for SASF
Company Background
Canara Bank is a south India based PSU bank (fifth largest bank in India), with a
balance sheet size of around `5.3lakh cr. The bank has a reasonably large
pan-India presence with a network of 5500+ branches. The bank also has over
7,095 ATMs across the country.
November 20, 2015
6
Canara Bank | 2QFY2016 Result Update
Income statement (Standalone)
Y/E March (` cr)
FY12
FY13
FY14
FY15
FY16E
FY17E
Net Interest Income
7,689
7,879
8,944
9,664
10,645
11,893
- YoY Growth (%)
(0.1)
2.5
13.5
8.0
10.2
11.7
Other Income
2,928
3,153
3,933
4,550
4,796
5,052
- YoY Growth (%)
4.1
7.7
24.7
15.7
5.4
5.3
Operating Income
10,617
11,032
12,877
14,214
15,441
16,945
- YoY Growth (%)
1.0
3.9
16.7
10.4
8.6
9.7
Operating Expenses
4,674
5,142
6,081
7,264
7,627
8,042
- YoY Growth (%)
5.8
10.0
18.3
19.4
5.0
5.4
Pre - Provision Profit
5,943
5,890
6,796
6,950
7,814
8,903
- YoY Growth (%)
(2.4)
(0.9)
15.4
2.3
12.4
13.9
Prov. & Cont.
1,860
2,218
3,733
3,497
4,721
4,055
- YoY Growth (%)
74.6
19.2
68.3
(6.3)
35.0
(14.1)
Profit Before Tax
4,083
3,672
3,063
3,454
3,094
4,849
- YoY Growth (%)
(18.8)
(10.1)
(16.6)
12.8
(10.4)
56.7
Prov. for Taxation
800
800
625
785
882
1,503
- as a % of PBT
19.6
21.8
20.4
22.7
28.5
31.0
PAT
3,283
2,872
2,438
2,669
2,212
3,346
- YoY Growth (%)
(18.5)
(12.5)
(15.1)
9.5
(17.1)
51.2
Balance sheet (Standalone)
Y/E March (` cr)
FY12
FY13
FY14
FY15
FY16E
FY17E
Share Capital
443
443
461
475
475
475
Reserve & Surplus
22,247
24,435
29,159
31,906
33,646
36,268
Deposits
3,27,054
3,55,856
4,20,723
4,73,840
5,02,271
5,42,452
- Growth (%)
11.5
8.8
18.2
12.6
6.0
8.0
Borrowings
6,558
11,573
15,955
14,678
15,516
16,700
Tier 2 Capital
8,967
8,711
11,276
10,994
10,719
10,451
Other Liab. & Prov.
8,891
11,325
14,348
16,108
16,693
17,161
Total Liabilities
3,74,160
4,12,343
4,91,922
5,48,001
5,79,320
6,23,508
Cash Balances
17,795
15,406
22,154
21,972
25,114
27,123
Bank Balances
10,384
19,309
22,675
26,669
26,069
24,940
Investments
1,02,057
1,21,133
1,26,828
1,45,346
1,49,871
1,52,648
Advances
2,32,490
2,42,177
3,01,067
3,30,036
3,53,138
3,91,983
- Growth (%)
10.0
4.2
24.3
9.6
7.0
11.0
Fixed Assets
2,858
2,863
6,642
6,950
7,126
7,440
Other Assets
8,576
11,456
12,556
17,028
18,002
19,375
Total Assets
3,74,160
4,12,343
4,91,922
5,48,001
5,79,320
6,23,508
- Growth (%)
11.4
10.2
19.3
11.4
5.7
7.6
November 20, 2015
7
Canara Bank | 2QFY2016 Result Update
Ratio analysis (Standalone)
Y/E March
FY12
FY13
FY14
FY15
FY16E
FY17E
Profitability ratios (%)
NIMs
2.2
2.1
2.1
1.9
2.0
2.1
Cost to Income Ratio
44.0
46.6
47.2
51.1
49.4
47.5
RoA
0.9
0.7
0.5
0.5
0.4
0.6
RoE
17.0
13.2
10.4
10.5
8.0
11.2
B/S ratios (%)
CASA Ratio
24.3
24.2
24.5
24.0
25.3
26.7
Credit/Deposit Ratio
71.1
68.1
71.6
69.7
70.3
72.3
CAR
13.8
12.4
11.1
10.7
10.6
10.5
- Tier I
10.4
9.8
8.0
8.0
8.0
8.1
Asset Quality (%)
Gross NPAs
1.7
2.6
2.5
3.9
5.3
5.5
Net NPAs
1.5
2.2
2.0
2.6
2.9
2.5
Slippages
2.2
2.5
3.5
3.6
3.5
3.0
Loan Loss Prov. /Avg. Assets
0.4
0.5
0.5
0.7
0.8
0.6
Provision Coverage
67.6
61.4
60.1
60.0
62.5
67.5
Per Share Data (`)
EPS
74.1
64.8
52.9
56.2
46.6
70.4
ABVPS (75% cover.)
448.1
473.6
474.3
496.7
530.7
610.7
DPS
11.0
13.0
11.0
8.6
8.5
13.0
Valuation Ratios
PER (x)
3.6
4.2
5.1
4.8
5.8
3.8
P/ABVPS (x)
0.6
0.6
0.6
0.5
0.5
0.4
Dividend Yield
4.1
4.8
4.1
3.2
3.2
4.8
DuPont Analysis
NII
2.2
2.0
2.0
1.9
1.9
2.0
(-) Prov. Exp.
0.5
0.6
0.8
0.7
0.8
0.7
Adj. NII
1.6
1.4
1.2
1.2
1.1
1.3
Treasury
0.1
0.2
0.1
0.2
0.2
0.2
Int. Sens. Inc.
1.7
1.6
1.3
1.4
1.2
1.5
Other Inc.
0.7
0.6
0.7
0.7
0.7
0.7
Op. Inc.
2.5
2.2
2.0
2.1
1.9
2.1
Opex
1.3
1.3
1.3
1.4
1.4
1.3
PBT
1.1
0.9
0.7
0.7
0.5
0.8
Taxes
0.2
0.2
0.1
0.2
0.2
0.2
RoA
0.9
0.7
0.5
0.5
0.4
0.6
Leverage
18.4
18.1
19.3
20.4
20.3
20.1
RoE
17.0
13.2
10.4
10.5
8.0
11.2
November 20, 2015
8
Canara Bank | 2QFY2016 Result Update
Research Team Tel: 022 - 39357800
DISCLAIMER
Angel Broking Private Limited (hereinafter referred to as “Angel”) is a registered Member of National Stock Exchange of India Limited,
Bombay Stock Exchange Limited and Metropolitan Stock Exchange of India Limited. It is also registered as a Depository Participant with
CDSL and Portfolio Manager with SEBI. It also has registration with AMFI as a Mutual Fund Distributor. Angel Broking Private Limited is
a registered entity with SEBI for Research Analyst in terms of SEBI (Research Analyst) Regulations, 2014 vide registration number
INH000000164. Angel or its associates has not been debarred/ suspended by SEBI or any other regulatory authority for accessing
/dealing in securities Market. Angel or its associates including its relatives/analyst do not hold any financial interest/beneficial
ownership of more than 1% in the company covered by Analyst. Angel or its associates/analyst has not received any compensation /
managed or co-managed public offering of securities of the company covered by Analyst during the past twelve months. Angel/analyst
has not served as an officer, director or employee of company covered by Analyst and has not been engaged in market making activity
of the company covered by Analyst.
This document is solely for the personal information of the recipient, and must not be singularly used as the basis of any investment
decision. Nothing in this document should be construed as investment or financial advice. Each recipient of this document should
make such investigations as they deem necessary to arrive at an independent evaluation of an investment in the securities of the
companies referred to in this document (including the merits and risks involved), and should consult their own advisors to determine
the merits and risks of such an investment.
Reports based on technical and derivative analysis center on studying charts of a stock's price movement, outstanding positions and
trading volume, as opposed to focusing on a company's fundamentals and, as such, may not match with a report on a company's
fundamentals.
The information in this document has been printed on the basis of publicly available information, internal data and other reliable
sources believed to be true, but we do not represent that it is accurate or complete and it should not be relied on as such, as this
document is for general guidance only. Angel Broking Pvt. Limited or any of its affiliates/ group companies shall not be in any way
responsible for any loss or damage that may arise to any person from any inadvertent error in the information contained in this report.
Angel Broking Pvt. Limited has not independently verified all the information contained within this document. Accordingly, we cannot
testify, nor make any representation or warranty, express or implied, to the accuracy, contents or data contained within this document.
While Angel Broking Pvt. Limited endeavors to update on a reasonable basis the information discussed in this material, there may be
regulatory, compliance, or other reasons that prevent us from doing so.
This document is being supplied to you solely for your information, and its contents, information or data may not be reproduced,
redistributed or passed on, directly or indirectly.
Neither Angel Broking Pvt. Limited, nor its directors, employees or affiliates shall be liable for any loss or damage that may arise from
or in connection with the use of this information.
Note: Please refer to the important ‘Stock Holding Disclosure' report on the Angel website (Research Section). Also, please refer to the
latest update on respective stocks for the disclosure status in respect of those stocks. Angel Broking Pvt. Limited and its affiliates may
have investment positions in the stocks recommended in this report.
Disclosure of Interest Statement
Canara Bank
1. Analyst ownership of the stock
No
2. Angel and its Group companies ownership of the stock
No
3. Angel and its Group companies' Directors ownership of the stock
No
4. Broking relationship with company covered
No
Note: We have not considered any Exposure below ` 1 lakh for Angel, its Group companies and Directors
Ratings (Based on expected returns
Buy (> 15%)
Accumulate (5% to 15%)
Neutral (-5 to 5%)
over 12 months investment period):
Reduce (-5% to -15%)
Sell (< -15)
November 20, 2015
9