Initiating Coverage | Housing Finance
January 27, 2017
Can Fin Homes
BUY
CMP
`1,728
Favorably placed for sustainable growth
Target Price
`2,128
Can Fin Homes Ltd (Can Fin) is a south based (74% of business) housing finance
Investment Period
12 Months
company with 43.53% shareholdings owned by Canara Bank. Can Fin has maintained
a low-risk profile loan book, predominantly focused on salaried class.
Stock Info
Growth momentum to continue: Over the last 4 years Can Fin has reported
Sector
Housing Finance
phenomenal 41.6% CAGR in loan book. Considering the lower interest rates and
Market Cap (` cr)
4,539
the government’s interest subvention scheme, we believe that the company’s
Beta
1.2
growth momentum would continue and it would record a CAGR of 26% in loan
book over FY2016-19E. Moreover, well capitalized balance sheet, with Capital
52 Week High / Low
1887/841
Adequacy Ratio (CAR) of 18.76% would support the growth trajectory. The management
Avg. Daily Volume
7,825
is targeting a loan book of `35,000cr by March 2020.
Face Value (`)
10
Retail oriented book with a focus on salaried class: Can Fin’s Loan book
BSE Sensex
27,708
comprises of 88% Housing finance, 6% of LAP (50% is to salaried class), builder
Nifty
8,603
loans constitute only 0.16% and the remaining consists of others such as staff,
Reuters Code
CNFH.BO
loan for sites & top up. According to the recent quarter result, it was witnessed
Bloomberg Code
CANF@IN
that Can Fin was not much affected due to demonetization, as loans are largely
offered to the first time home buyers in the salaried class and for the projects
nearing completion. .
Shareholding Pattern (%)
Favorable borrowing & changing asset mix to support NIM: Can Fin has reduced
Promoters
44.1
its dependence on bank borrowing and increased borrowing from debt market
MF / Banks / Indian Fls
18.1
instruments such as CP & NCD (48% in 3QFY2017 v/s. 5% in FY2014), which
FII / NRIs / OCBs
3.8
resulted into lower cost of fund (8.32% in 3QFY2017 from 9.70% in FY2013).
Indian Public / Others
34.0
Further, Can Fin is focusing on the high yielding Non-housing / Non-Salaried
loans in calibrated manner, which should be margin accretive.
Impressive asset quality: Can Fin has been able to improve its asset quality
Abs.(%)
3m 1yr 3yr
(GNPA) from 1.06% in FY2011 to 0.24% in 3QFY2017. With 100% provisioning of
Sensex
(2.9)
11.0
26.9
NPA it has been able to maintain nil NPA consistently for last six years. Its NPAs are
Canfin Homes
(5.0)
67.2
992.7
consistently 0% for the last six years implying 100% coverage ratio.
Outlook & Valuation: We expect Can Fin to deliver RoE of more than 20% on a
sustained basis from FY2017 onwards (FY2017-23.6%, FY2018E-24.1%, and
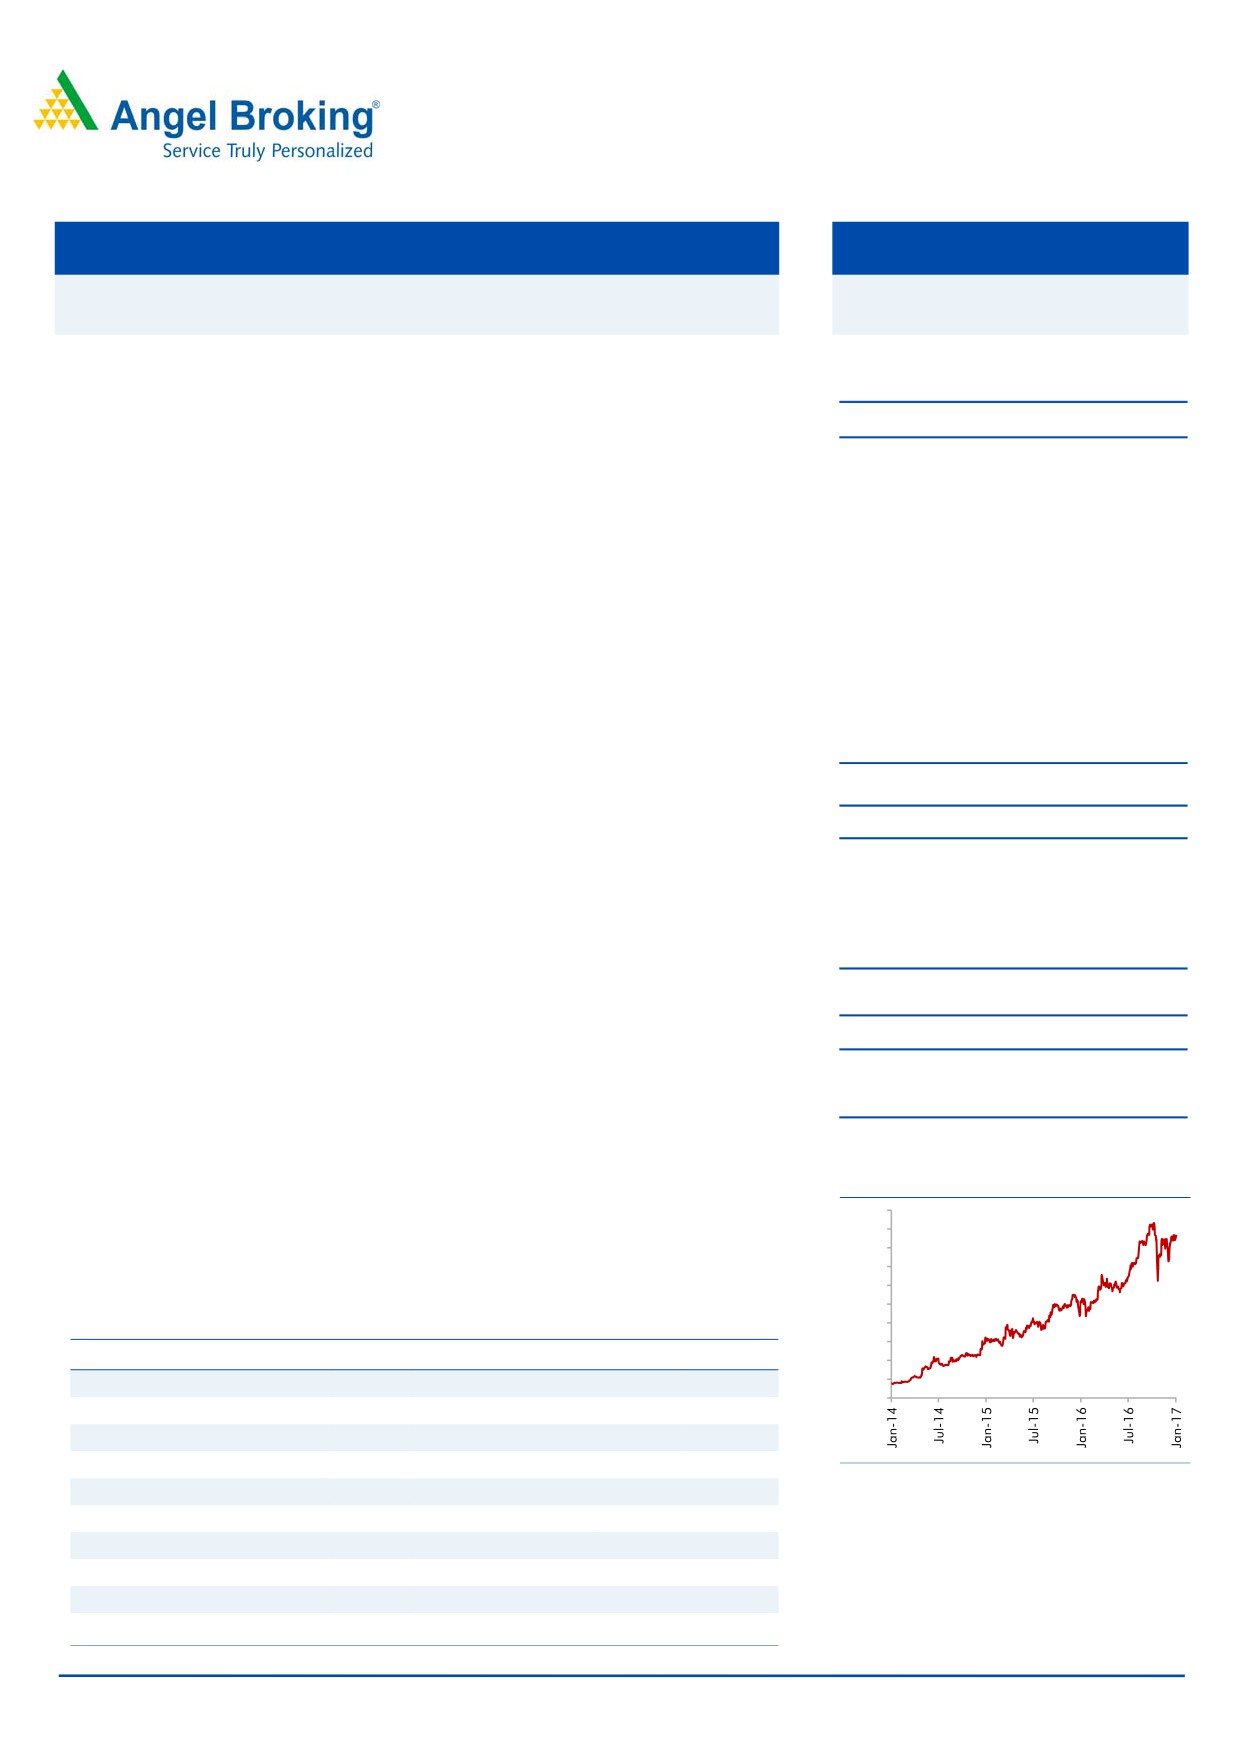
3-year price chart
FY2019E-25.6%) on the back of higher growth, NIM expansion and stable credit
2,000
cost. Additionally, cost optimization should also add to return ratio. At the current
1,800
1,600
market price, the stock is trading at 2.85x its FY2019E BV of `608. We recommend
1,400
a BUY rating on the stock with a target price of `2,128 (3.5x FY2019E BV).
1,200
1,000
Key Financials (Standalone)
800
600
FY14
FY15
FY16
FY17E
FY18E
FY19E
400
200
NII
136.1
179.6
309.0
420.3
525.7
665.1
0
% Chg
41.1
31.9
72.1
36.0
25.1
26.5
Net Profit
75.7
86.2
157.1
230.3
287.1
375.2
% Chg
41.0
13.9
82.2
46.6
24.6
30.7
Source: Company, Angel Research
NIM (%)
2.7
2.5
3.2
3.5
3.5
3.5
EPS (`)
37.0
32.4
59.0
86.5
107.8
141.0
P/E (x)
46.8
53.13
29.13
20
16
12.3
P/BV (x)
7.8
6.0
5.2
4.3
3.5
2.8
Jaikishan J Parmar
RoA (%)
1.5
1.2
1.6
1.9
1.9
2.0
022 39357600, Extn: 6810
RoE (%)
17.9
14.1
19.0
23.6
24.1
25.6
Source: Company, Angel Research; Note: CMP as of January 25, 2017
Please refer to important disclosures at the end of this report
1
Can Fin Homes | Initiating Coverage
Multiple drivers for loan growth
The company’s loan book has grown at a CAGR of 39%/41.6%/37.3% in the last
Affordable housing segment - principle
3/4/5 years. This growth is without any deliberate policy by the government. We
growth driver
believe that the recent changes in Pradhan Mantri Awas Yojana (PMAY) and other
initiatives, stringent policy and regulation by government are likely to raise
demand for houses & eventually the demand for home loans. The management is
targeting a loan book of `35,000cr by March 2020.
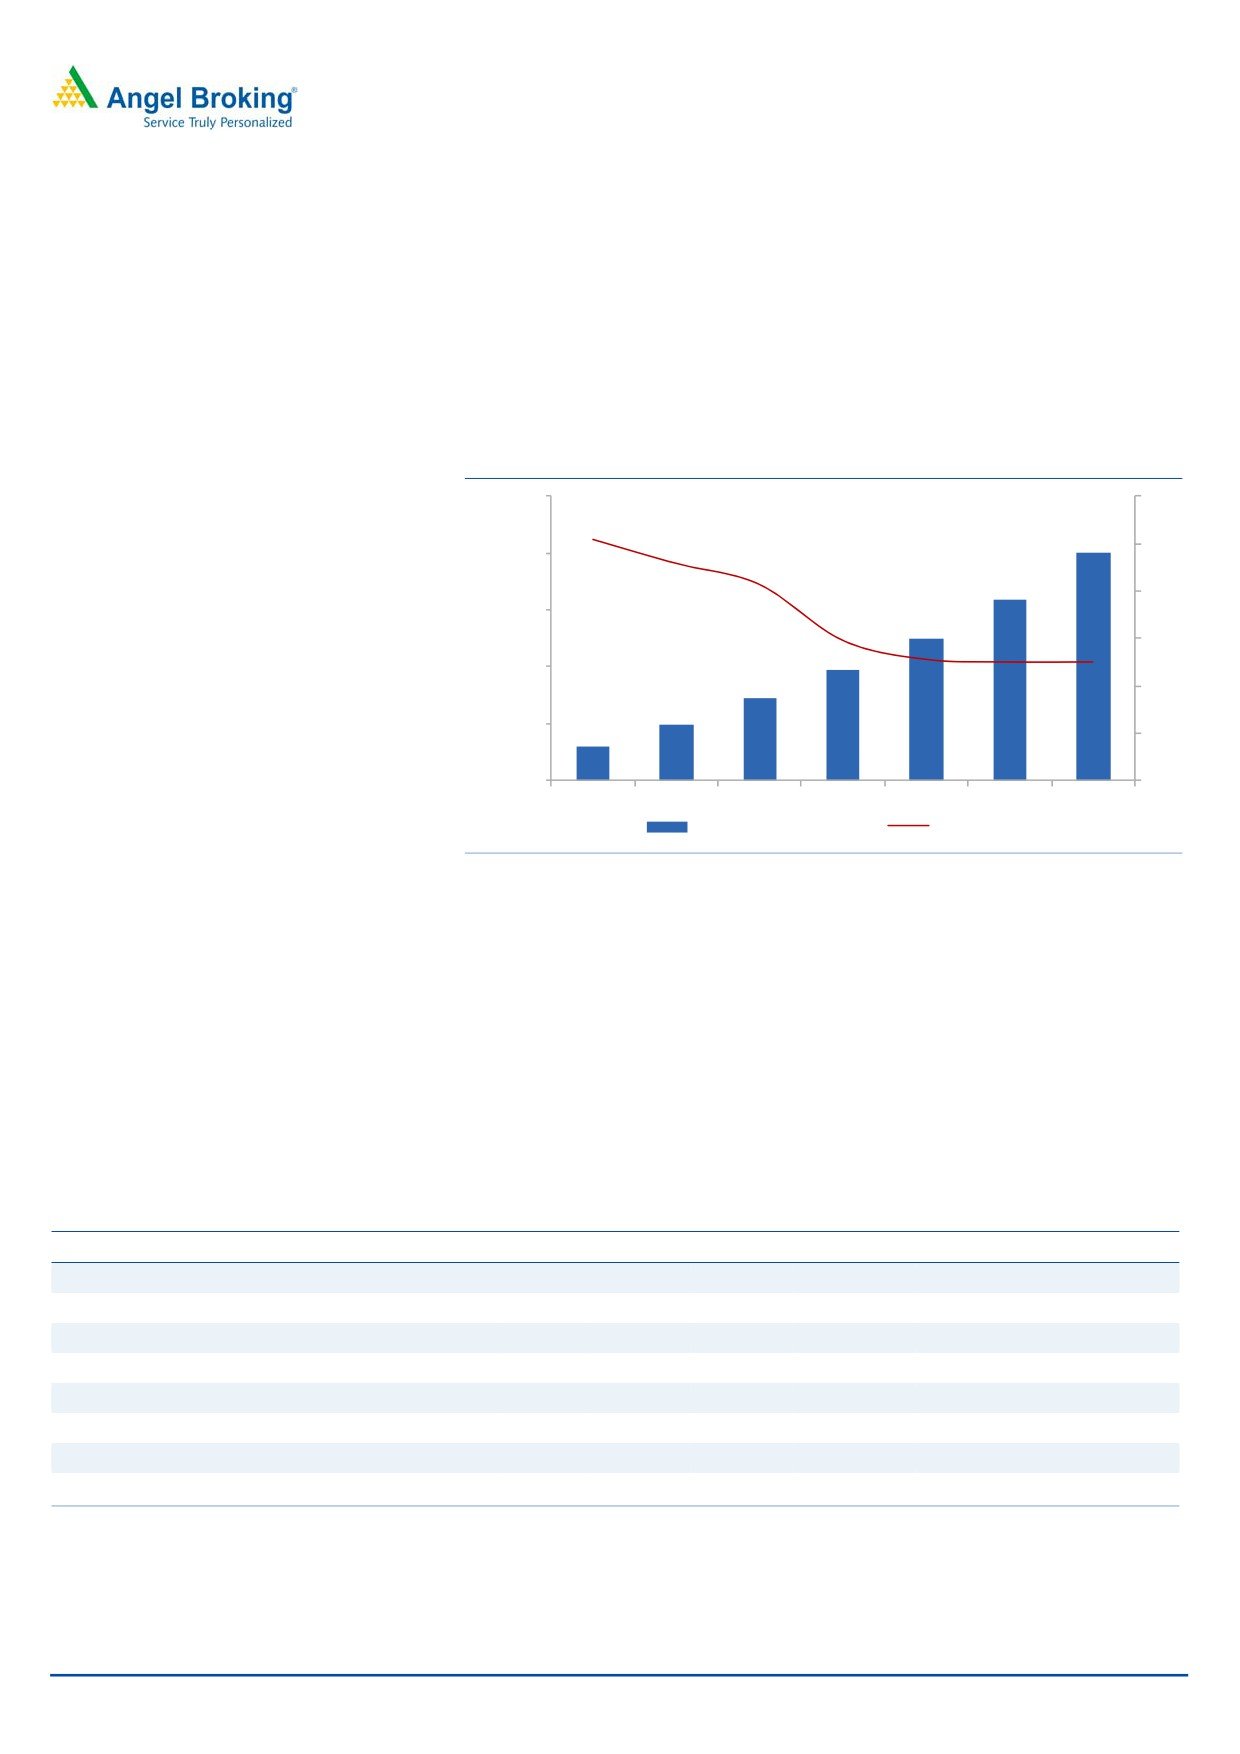
Exhibit 1: Loan Book growth Trend
26,000
60
51
50
21,000
46
41
40
16,000
30
30
11,000
26
25
25
20
6,000
10
1,000
-
FY13
FY14
FY15
FY16
FY17E
FY18E
FY19E
Loan Book (` in cr)
Growth YoY (%)
Source: Company, Angel Research
Until 2011, Can Fin Homes was reporting moderate loan growth (~9% CAGR
over 2002-2011). However, since 2011 it has grown its advances at a CAGR of
39%/41.6%/37.3% in the last 3/4/5 year. In order to achieve such a phenomenal
growth, Can Fin has added 79 branches and 50 satellite offices in last five years
(currently 120 offices and 50 satellite offices). For further growth, the management
has a vision to reach the loan book size of `35,000cr by March 2020 with high
asset quality. This implies that its loan book could grow by healthy ~35% CAGR till
2020. We estimate Can Fin’s loan book to grow at a CAGR of 25% over FY2016-
FY2019E.
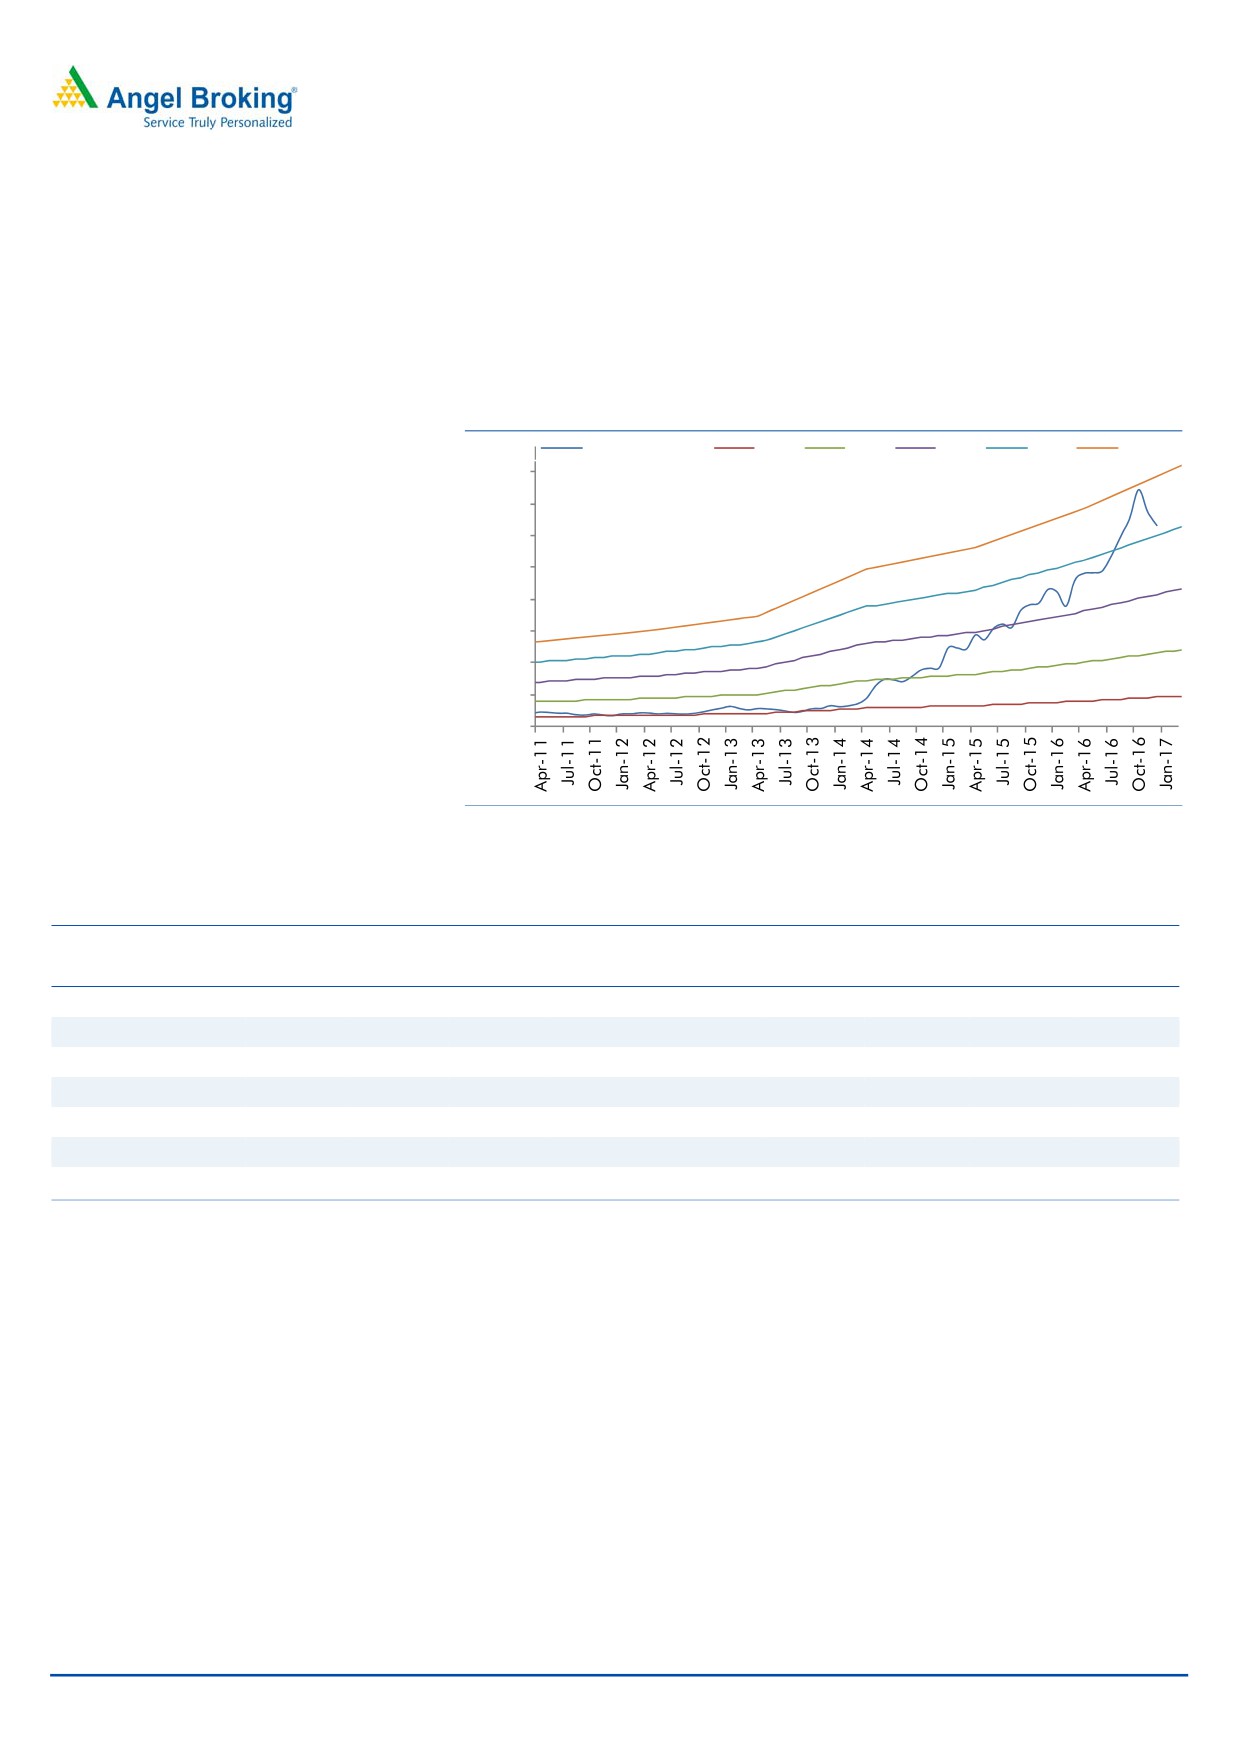
Exhibit 2: Comparative Loan book growth of peers
` in cr
FY11
FY12
FY13
FY14
FY15
FY16
CAGR 5 (%)
CAGR 4 (%)
CAGR 3 (%)
LIC Hsg
51,400
63,080
77,812
91,341
1,08,361
1,25,173
19.5
18.7
17.2
DHFL
19,740
28,805
42,163
58,810
78,632
1,02,834
39.1
37.5
34.6
India Bulls Hsg
19,800
27,500
34,400
41,200
52,200
68,700
28.3
25.7
25.9
PNB Hsg
2,899
3,800
5,400
8,600
14,400
25,600
54.6
61.1
68.0
Gruh Fin
3,176
4,077
5,447
7,020
8,926
11,115
28.5
28.5
26.8
Can Fin Hom
2,205
2,673
4,030
5,874
8,302
10,753
37.3
41.6
38.7
Repco
2,079
2,804
3,545
4,662
6,013
7,691
29.9
28.7
29.5
GIC Housing
3,416
3,872
4,539
5,313
6,598
7,912
18.3
19.6
20.3
Source: Company, Angel Research
January 27, 2017
2
Can Fin Homes | Initiating Coverage
Government’s drive - affordable housing for all
Since the general election of 2014, NDA had campaigned and promised to roll
out low cost housing programs (Affordable house/House for all), which would
benefit the large population of India, especially the economically weaker sections.
After taking office, NDA had granted infrastructure status to the affordable housing
segment in the 2014-15 Budget, which enabled lower borrowing costs for
developers.
Affordable house/House for all was one of the core promises made during the
election campaigns. The government launched the Pradhan Mantri Awas Yojana in
2015, with the aim of building 2 crore houses over a seven year period till 2022.
The scheme provided for an upfront subsidy for low cost housing along with a
6.5% interest rate subsidy for loans up to ` 6 lakh.
The Government plans to implement the project via four modes:
Slum Redevelopment
Affordable Housing through credit linked Subsidy
Affordable Housing in partnership
Subsidy for beneficiary led individual house construction or enhancement
Exhibit 3: The Pradhan Mantri Awas Yojna older schemes
Beneficiary
Dwelling Area
Eligibility Criteria
EWS ( Economically
30 Sq Meters
Having an annual income upto ` 3 Lakhs
Weaker Section)
LIG ( Low Income Group)
60 Sq Meters
Having Annual Income Upto `3-6 lakhs
Source: Company, Angel Research
Under this scheme, loan up to `6 lakh is provided to the beneficiary at a
subsidized interest rate of 6.5% for a tenure of 15 years. The maximum interest
subsidy is `2.2 lakh. The scheme was officially launched in 2015; it subsumed an
earlier scheme called the Rajiv Awas Yojana.
Exhibit 4: Progress of PM Awas Yojana between 2014 - 2016
House Involved
12,27,088
House gronded for construction
2,21,373
House Completed
48,236
Source: Company, Angel Research
As per the vision of ‘Housing for All by 2022’, the government has been aiming to
supply affordable homes to majority of the population. In addition to that, the Real
Estate Regulatory Act that has been passed by both the houses at the end of this
financial year has also brought forward the scope for development of the sector. In
the upcoming years, certain long term goals and initiatives of the government are
likely to raise demand for houses, thereby eventually raising the demand for home
loans.
Can Fin Homes, FY2016 Annual Report
January 27, 2017
3
Can Fin Homes | Initiating Coverage
The actual number of PMAY doesn’t commensurate with the big bang promise
made by present government. Primary reason for the muted response/activity
could be the loan limit of ` 6 lakh, which may be inadequate for meeting the cost
involved for building house. The average ticket size for affordable house in tier 2 &
3 Cities is `10-15 lakhs, much higher than the earlier cap of ` 6 lakh for interest
subvention on housing loans.
This can be validated from the recent data provided by National Housing Board
(NHB) progress of housing report released last year. Out of the total outstanding
individual housing loans of ` 4.40 lakh crore given by 26 PSBs in 2014-15, 65%
were given to people taking loans up to ` 25 lakh.
PM Modi’s new scheme for subsidized home loans could trigger
a growth for the sector
In his address to the nation, Honorable Prime Minister, Mr. Narendra Modi,
announced some benefits which could make affordable housing more realistic.
Under the new scheme, there would be two more slabs i.e. home loans upto `9
lakh taken in 2017 will receive an interest subvention of 4%, while loans upto `12
lakh taken in 2017 will receive an interest subvention of 3%. This scheme will run
along with the existing scheme under which loans upto `6 lakh are provided to the
EWS/LIG segment at a subsidized interest rate of 6.5%. More details on the
eligibility of the home loans under this scheme are still awaited.
Exhibit 5: New schemes announced by Govt.
New schemes announced by Govt.
Subsidy
Eligibility
Loan Amount Upto
`2 lakhs
3%
For Rural
`9 lakhs
4%
For Urban
`12 lakhs
3%
For Urban
Source: Company, Angel Research
The government’s scheme is likely to provide big boost to demand for affordable
housing, mostly in the peripheral area of Tier - 2 cities, as maximum affordable
houses are priced anywhere between `15 lakhs to `30 lakhs. The newly launched
scheme effectively narrows down the gap between rent and EMI, hence, it is
tremendously positive for housing loan demand.
Exhibit 6: Avg ticket Size FY2016
Company
` Lakhs
Can Fin Hom
17.4
LIC Hsg
21.0
DHFL
18.0
India Bulls Hsg
25.0
PNB Hsg
32.0
Gruh Fin
6.4
Repco
13.0
Source: Company, Angel Research
January 27, 2017
4
Can Fin Homes | Initiating Coverage
Various initiatives, schemes and policies to support sector growth
Smart Cities: GOI has in place a developmental plan covering 100 cities between
2016 to 2020, which will include improvement, city renewal, city extension
(Source: Ministry of Urban Development (Government of India) - Smart City
Mission Transform-nation - Mission Statement & Guidelines).
Housing for all by 2022: GOI had launched the program in June 2015, with the
aim of providing 20 million new housing units in 500 towns and cities over the
next seven years, recently changed to incorporate faster implementation.
Sebi relaxes debt fund exposure limit for housing finance companies: Debt
mutual funds can invest an additional 10% in housing finance companies above
the 25 percent sectoral limit. SEBI had earlier allowed a 5 percent additional limit
for housing finance companies.
Real Estate (Regulatory & Development) Act, 2016: This is expected to bring
sea changes in the otherwise unregulated industry. Primary fears in the mind of
house buyers are delayed possession, incomplete paperwork and poor quality of
construction. Hence, many cases are running against builders in consumer courts
and eventually the buyer has to suffer in terms of long waiting for judgment. Also,
the builders used to sell flats before construction actually happened and they used
the same money to buy other plot/project. However, under the Act, builders have
to deposit 70 per cent of the collected amount in an escrow account to ensure that
money is not diverted from one project to another.
January 27, 2017
5
Can Fin Homes | Initiating Coverage
Favorable borrowing mix to support NIM
Well diversified resource mix supports
Can Fin has reduced its reliance on bank borrowing (20% in 3QFY2017 v/s. 68%
profitability
in FY2012) and increased borrowing from debt market instruments such as
Commercial Papers (CP) & Non-Convertible Debentures (NCD), which thereby
resulted in lower cost of funds i.e. 8.55% in 2QFY2017 from 9.70% in FY2013.
Can Fin Homes continues to enjoy AAA rating for borrowings/ NCD and A+ for
CP issuance. We believe Can Fin would continue to receive capital and funding
support from Canara Bank, and hence, ratings would remain the highest (AAA).
Eventually, this would help its plan to increase reliance on money market
instrument and would reduce the borrowing cost and improve margins.
Exhibit 7: Borrowing Mix Trend of CanFin Homes (%)
Borrowing Mix
FY10
FY11
FY12
FY13
FY14
FY15
FY16
Q1FY17
Q2FY17
Q3FY17
Deposit
11
8
6
5
3
3
2
3
2
2
NHB
28
29
26
51
48
44
37
34
32
30
Banks
61
63
68
44
44
31
27
19
18
20
NCD, CP
-
-
-
-
5
22
34
44
48
48
Source: Company, Angel Research
Exhibit 8: Comparative Source of borrowing (%)
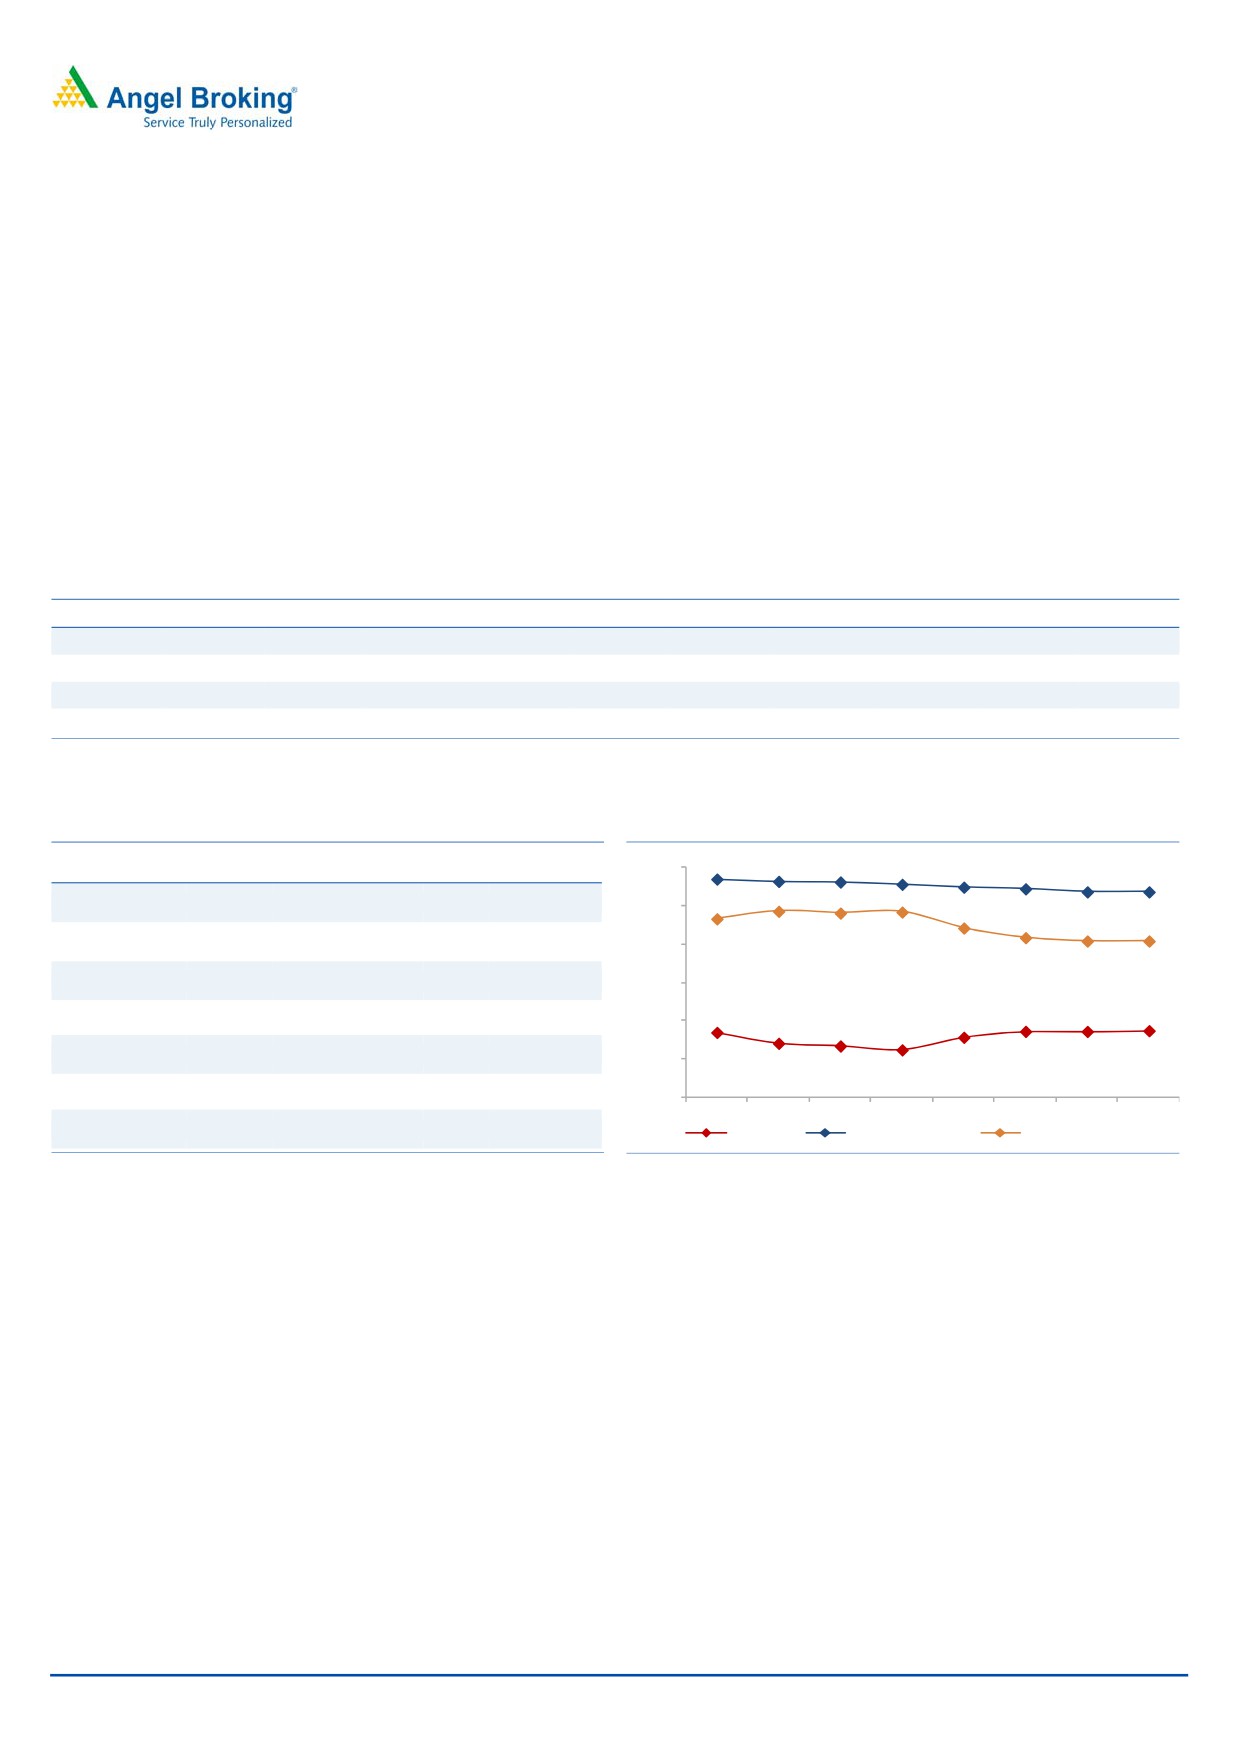
Exhibit 9: NIM Trend (%)
FY16
Banks
NCD NHB CP FD &Others
11.4
11.2
11.2
11.1
10.9
12.0
10.9
10.7
10.7
Can Fin Hom
27
23
37
11
2
10.0
9.7
9.6
9.7
LIC Hsg
13
77
2.7
1
6.3
8.0
9.3
8.8
8.3
8.2
8.2
DHFL
53
33
2
-
12
6.0
3.4
3.5
3.5
3.5
India Bulls Hsg
49
38
-
-
13
4.0
2.8
3.2
2.7
2.5
PNB Hsg
6
38
8
20
28
2.0
Gruh Fin
38
-
39
-
23
-
FY12
FY13
FY14
FY15
FY16
FY17E FY18E FY19E
Repco
72
6
14
-
8
NIM Trend
Yield on Loan Book
Cost Of Borrowing
Source: Company, Angel Research
Source: Company, Angel Research
Can Fin Homes has been able to borrow from money market at
an average 1% premium to G-Sec yield
Due to demonetization, banks have been flooded with low cost deposits (CASA),
Well diversified funding mix, shift
therefore the cost of funds for the banks has declined drastically. Hence, post
toward money market instrument (NCD
demonetization, banks have reduced their lending rates vary aggressively. This
& CP)
would intensify competition in housing finance market, however, it is not a big
cause of concern for Can Fin due to - (1) historically, Can Fin used to charge 50 -
75bps higher than banks despite this it has able to deliver stellar CAGR of 41% in
last 4 years. Recently, Can Fin has revised its loan rate to 8.85% from 9.5%. Thus,
the average difference now is ~40 bps between lower interests charged by banks
and other housing finance companies compared to Can Fin Homes (Exhibit-10);
(2) Can Fin Homes has been able to raise NCD/debt from money market on an
average 1% higher than 10-Year G-sec Yield (Exhibit -10). We believe that in
future also it would be able to borrow at similar attractive rates owing to support
January 27, 2017
6
Can Fin Homes | Initiating Coverage
and majority ownership of Canara Bank and maintain top grade asset quality;
(3) Can Fin Homes had 20% of its total borrowing from banks in 3QFY2017, out
of which certain portion is floating. Therefore, the reducing MCLR rates of the bank
would help Can Fin Homes to reduce its cost of funding.
Exhibit 10: Competitive borrowing
Exhibit 11: Equally competitive lending rate
10 Year
Prem Over
HFC
Floating Interest Rate (%)
Issue Date
Maturity
Coupon
G Sec Yield
G-Sec
CanFIn Homes
8.85
13-01-2014
13-01-2017
10.05
8.71
1.34
SBI
8.6
03-12-2014
03-12-2024
8.94
7.97
0.97
PNB
8.45
06-02-2015
06-02-2018
8.80
7.70
1.10
HDFC LTD
8.65
28-05-2015
28-06-2018
8.70
7.65
1.05
Axis Bank
8.85
02-07-2015
02-07-2018
8.80
7.81
0.99
ICICI Bank
8.65
08-10-2015
08-10-2018
8.44
7.54
0.90
LIC Hsg
8.5
07-01-2016
06-04-2019
8.60
7.74
0.86
17-02-2016
17-05-2019
8.85
7.79
1.06
DHFL
8.6
22-04-2016
22-03-2019
8.37
7.46
0.91
India Bulls Hsg
8.65
27-05-2016
27-08-2019
8.55
7.47
1.08
PNB Hsg
8.9
16-09-2016
16-12-2019
7.85
6.87
0.98
Gruh Fin
9.75
15-11-2016
15-11-2021
7.77
6.53
1.24
Repco
9.6
Source: Company, Angel Research
Source: Company, Angel Research
Scope to increase higher yielding book: Can Fin’s focus has always been on
relatively low risk salaried home loans segment (78% in 2QFY2017). However, the
management now intends to increase focus on building a high yielding non-
housing portfolio. The share of non-housing loan has increased from 3% in
FY2012 to 12% by the end of 3QFY2017.
Exhibit 12: LAP as % of Total Loan Book
Particular
Can Fin Hom
LIC Hsg
DHFL India Bulls Hsg
PNB Hsg
Gruh Fin
Repco
LAP Loan (%)
4
9
16
37
26
11
20
Source: Company, Angel Research
Can Fin Homes has been able to position itself very well owing to its predominant
Growing non-housing (higher yielding)
focus on the salaried class, and primarily to first home buyers and near-
Portfolio
completion projects. However, with lower exposure to LAP, loans to builders and
under construction projects, the company would be able to increase business in
higher yielding assets going ahead. We believe, on the whole, portfolio
vulnerability would not increase due to rising share of relatively riskier segments (LAP,
self-employed, non-housing loans). Nevertheless, the strong monitoring and control
processes, borrowers’ own equity in the properties, lower LTV in LAP portfolio (50%) and a
large proportion of self-occupied properties could reduce the impact of the concerns on
asset quality to some extent.
We believe, going ahead, transparency into the sector would improve owning to
crack down on black money (improved accountability of income, thereby, would
help to improve non-salaried portfolio), implementation of Real Estate Regulatory
Authority (RERA; improved level of transparency) and Amendment Bill (The Benami
Transaction (Prohibition) Amendment Act).
Considering, Can Fin’s existing low risk portfolio and management’s incremental
focus on non-housing, non-salaried and higher yielding asset would fetch in
higher return ratio and growth going ahead.
January 27, 2017
7
Can Fin Homes | Initiating Coverage
Robust loan growth with impressive asset quality and
sufficient CAR
Can Fin Homes has aggressively expanded its loan book (41% CAGR over
Best-in-class asset quality maintained
FY2012-16). Regardless of this, asset quality (GNPA) has improved from 1.06% in
FY2011 to 0.24%in 3QFY2017. Its NPAs have consistently remained 0% for the
last six years, implying 100% coverage ratio. Also, the capital adequacy ratio
(18.76%) is at a comfortable level backing their growth prospects. Going forward,
we believe that loan growth momentum would continue, supported by the
government’s push for housing for all by 2022 and stringent steps taken to bring
transparency and lower interest rates.
The asset quality indicators remain comfortable, Gross NPAs at 0.24% & NPA at
0.01% as on 3QFY2017. We do not feel that the overall portfolio vulnerability
would increase due to the rising share of relatively riskier segments (LAP, self-
employed, non-housing loans). Nevertheless, the strong monitoring and control
processes, borrowers’ own equity in the properties and a large proportion of self-
occupied properties would continue to abate asset quality concerns.
Exhibit 13: GNPA & NPA Trend
Exhibit 14: Comparative Asset Quality, GNPA (%)
1.2
Q1
Q2
1.06
HFC
FY12
FY13
FY14
FY15
FY16
FY17
FY17
1
Can Fin Hom
0.71
0.39
0.21
0.17
0.19
0.24
0.25
0.8
0.71
LIC Hsg
0.42
0.61
0.67
0.46
0.45
0.59
0.57
0.6
DHFL
0.76
0.76
0.78
0.95
0.93
0.98
0.96
0.39
0.4
India Bulls Hsg
0.79
0.79
0.83
0.85
0.84
0.84
0.83
0.21
0.17
0.19
0.2
PNB Hsg
1.04
0.56
0.32
0.20
0.20
0.22
0.26
0
0
0
0
0
0
0
Gruh Fin
0.52
0.32
0.27
0.28
0.32
0.56
0.62
FY11
FY12
FY13
FY14
FY15
FY16
GNPA (%)
NPA (%)
Repco
1.40
1.50
1.50
1.30
1.30
2.20
2.37
Source: Company, Angel Research
Source: Company, Angel Research
Adequate capitalization; supported
by
In 3QFY2017, capital adequacy ratio for Can Fin remained comfortable (18.76%).
internal capital generation
The relaxation in the risk weightage for certain categories of home loans has
enabled most Housing Finance Companies to show a better capital adequacy
ratio. However, for Can Fin in addition to this relaxation, best in class asset quality
has also helped to report higher internal capital generation, which eventually
helped to report better CAR.
January 27, 2017
8
Can Fin Homes | Initiating Coverage
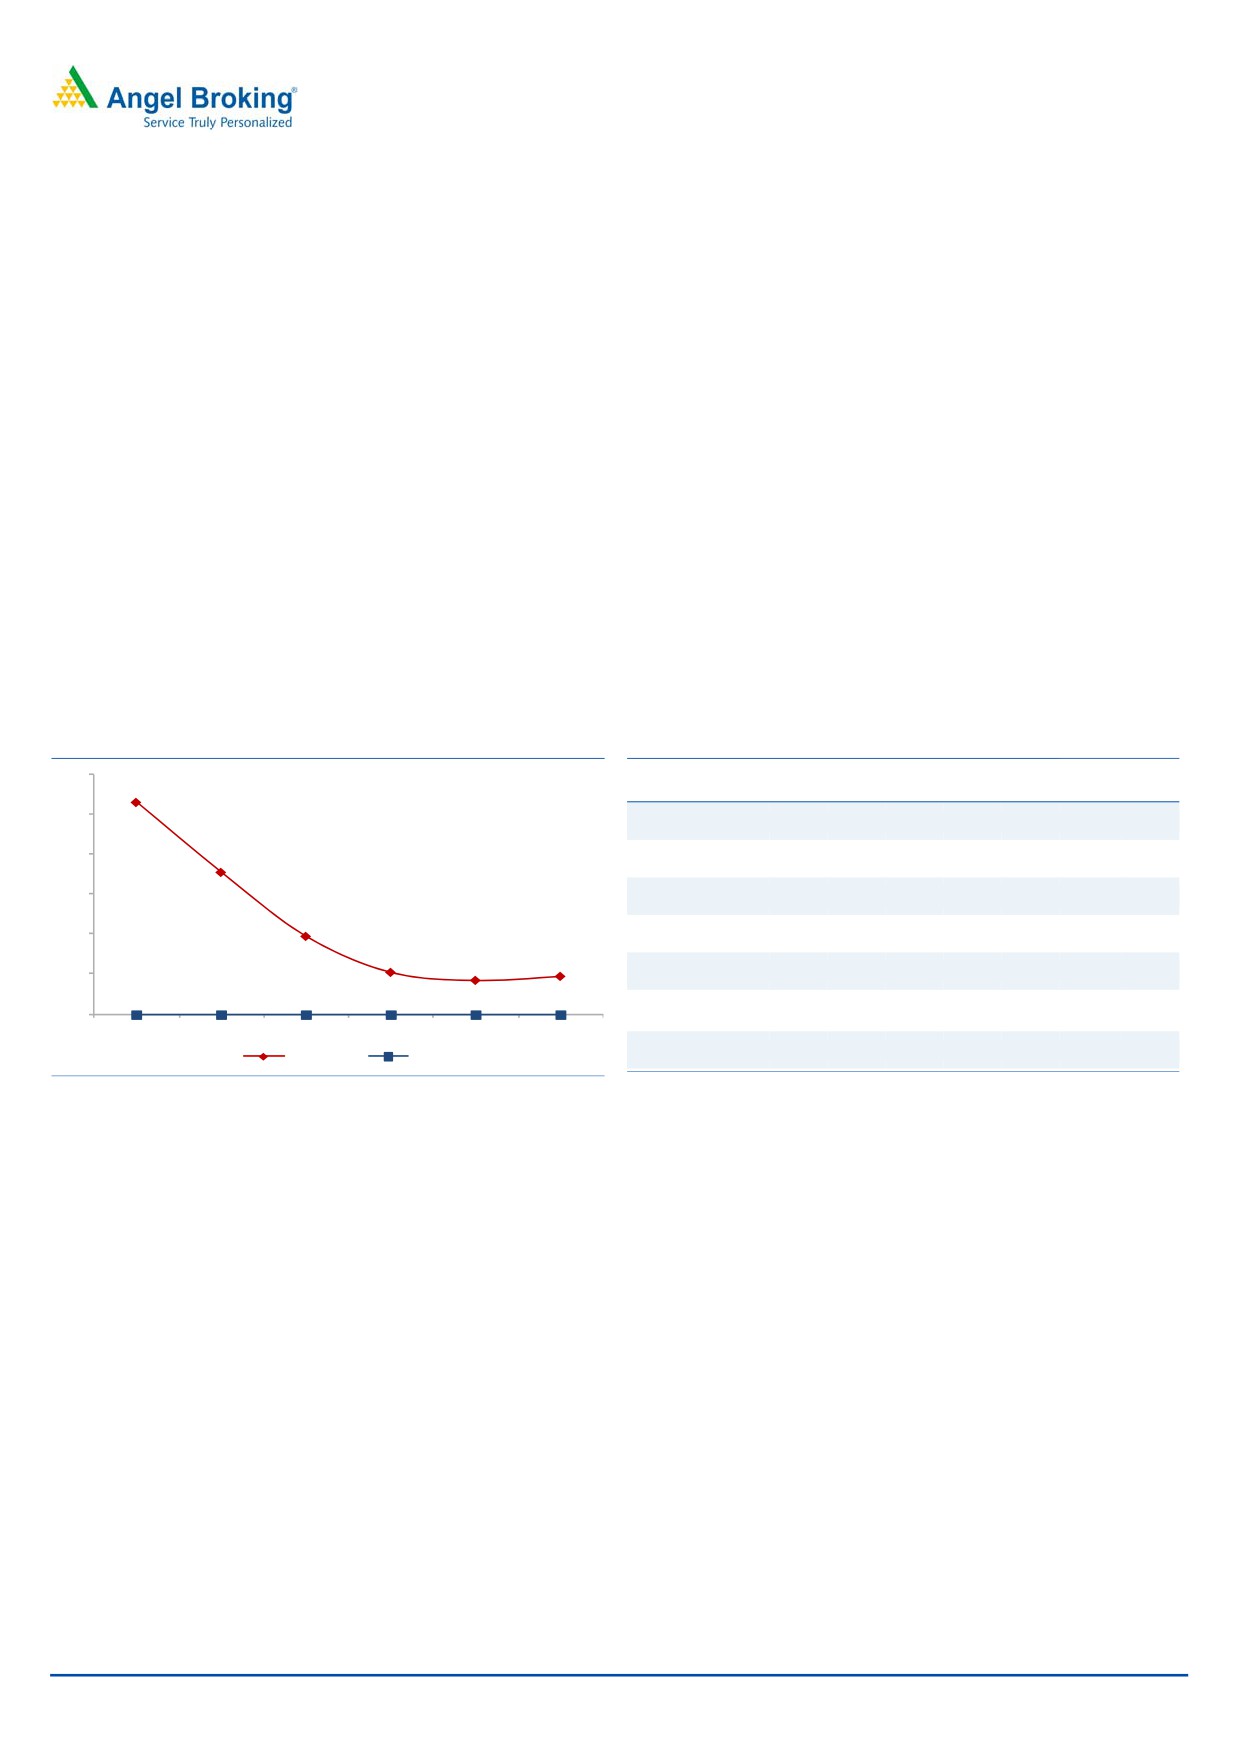
Outlook & Valuation: We expect CanFin to deliver ROE of more than 20% on a
sustained basis from FY2017 onwards (FY2017-23.6%, FY2018E-24.1%, and
FY2019E-25.6%) on the back of higher growth, NIM expansion and stable credit
cost. Additionally, cost optimization should also add to return ratio. At the current
market price, the stock is trading at
2.85x its FY2019E BV of
`608. We
recommend a BUY on the stock with a target price of `2,128 (3.5x FY2019E BV).
Exhibit 15: One year forward P/BV
Close -Unit Curr
0.5 X
1.3 X
2.3 X
3.3 X
4.3 X
2,000
1,750
1,500
1,250
1,000
750
500
250
0
Source: Company, Angel Research
Exhibit 16: Comparative Valuation & Return ration
P/BV
RoE%
RoA%
FY17E
FY18E
FY19E
FY17E
FY18E
FY19E
FY17E
FY18E
FY19E
Can Fin Home
4.3
3.5
2.8
23.6
24.1
25.6
1.9
1.9
2.0
LIC Hsg Fin
2.5
2.1
1.8
19.5
19.1
19.6
1.4
1.4
1.4
DHFL
1.5
1.3
1.1
16.9
17.5
17.8
1.2
1.3
1.3
Indiabulls Hsg Fin
2.7
2.4
2.1
25.6
27.7
29.5
3.3
3.2
3.1
GRUH Finance
12.0
9.7
8.2
29.9
29.8
31.3
2.3
2.3
2.3
Repco Home Fin
3.6
3.0
2.6
17.6
18.6
18.8
2.1
2.1
2.1
PNB Hsg Fin
2.5
2.2
1.9
14.9
14.9
18.7
1.6
1.7
1.8
Source: Company, Angel Research, Note: CMP as of January 24, 2017, * other bank Consensus taken from Bloomberg,
January 27, 2017
9
Can Fin Homes | Initiating Coverage
Exhibit 17: Comparative DuPont Analysis for FY16
Can Fin
LIC
India
PNB
Gruh
DHFL
Repco
Home Housing
Bulls
HSG
Fin
Interest Income
10.9
10.1
11.4
11.6
10.4
11.9
12.3
Interest expenses
7.8
7.7
9.0
7.4
7.6
7.8
7.9
Net Interest margin
3.1
2.4
2.4
4.2
2.8
4.1
4.4
Fees & Other Income
0.4
0.2
0.6
2.0
0.6
0.5
0.4
Total Income
3.6
2.6
3.0
6.1
3.4
4.5
4.8
Employee Exp
0.3
0.1
0.4
0.6
0.3
0.4
0.6
Other exp
0.4
0.3
0.5
0.3
0.7
0.4
0.3
Opex
0.7
0.4
0.9
0.9
1.0
0.8
0.9
PPP
2.9
2.2
2.1
5.3
2.4
3.7
3.9
Provision
0.2
0.1
0.3
0.6
0.3
0.2
0.6
PBT
2.7
2.1
1.8
4.7
2.1
3.5
3.3
Tax
1.0
0.7
0.6
1.2
0.7
1.1
1.2
RoA
1.6
1.4
1.2
3.5
1.3
2.4
2.2
Leverage
11.6
14.3
12.7
7.7
13.1
13.3
7.8
RoE (%)
19.0
19.6
15.1
27.0
17.6
31.5
17.0
Source: Company, Angel Research
January 27, 2017
10
Can Fin Homes | Initiating Coverage
Key Risk
Precipitous correction and prolonged down cycle of real estate price: Steep price
correction in real estate market could heighten the risk of deteriorating asset
quality.
Recent management change: Till June
2016, Mr Illango was running the
company’s show very effectively and under him Can Fin Homes performed very
well. Any drastic changes by new MD could be a cause of concern.
Loan mix gets riskier aggressively in the wake of growth: Till now Can Fin Homes
has smartly built and maintained a low-risk profile loan book. But in wake of
growth, aggressive and less compliant lending to riskier assets (LAP, non-salaried
and builder loans) could pose issues for the company.
Company Background
Can Fin Homes Ltd is a south based (74% of business) finance company with
“69.74% collection of installments
43.53% shareholding owned by Canara Bank. Since inception, Can Fin has
done through Electronic Clearing
smartly built and maintained a low-risk profile loan book. Housing finance holds a
System (ECS)”
giant share of the total loan book at ~88%. The remaining 12% which is into non-
CanFin Homes, FY16 Annual Report
housing, of that less than 50% is to salaried class. Can Fin has been lending
predominantly to the salaried class, and primarily to first buyers and near
completion projects. The management’s goal is to augment the loan book to
`13,500cr by the end of FY2017E and `35,000cr by March 2020E.
Key management Personnel
SHRI K.N. PRITHVIRAJ, Chairman - Shri K.N. Prithviraj was appointed as Director
on June 4, 2014. He is an independent and non-executive Chairman of the
Company. He has over 45 years of experience in the banking industry.
SHRI SARADA KUMAR HOTA, Managing Director - Shri Sarada Kumar Hota has
been appointed as the Managing Director of Can Fin Homes Ltd. w.e.f May 19,
2016. Prior to his posting to the Company, he was the Deputy General Manager
and Circle Head of Nagpur and Jaipur Circles of Canara Bank for 3 years
followed by a brief stint at the Recovery Wing of the Bank at Head Office.
January 27, 2017
11
Can Fin Homes | Initiating Coverage
Income statement (standalone)
Y/E March ( `cr)
FY14
FY15
FY16
FY17E
FY18E
FY19E
NII
136
180
309
420
526
665
- YoY Growth (%)
41
32
72
36
25
27
Other Income
21
29
39
44
61
76
- YoY Growth (%)
50
39
34
14
37
25
Operating Income
155
207
340
465
586
741
- YoY Growth (%)
42
33
64
37
26
26
Operating Expenses
44
55
67
79
107
133
- YoY Growth (%)
21
25
21
18
36
25
Pre - Provision Profit
111
152
273
386
480
608
- YoY Growth (%)
52
36
80
41
24
27
Prov. & Cont.
4
14
19
24
38
48
- YoY Growth (%)
-
221
36
21
62
25
Profit Before Tax
107
137
254
363
442
560
- YoY Growth (%)
43
29
85
43
22
27
Prov. for Taxation
31
51
97
132
155
185
- as a % of PBT
29
37
38
37
35
33
PAT
76
86
157
230
287
375
- YoY Growth (%)
41
14
82
47
25
31
Balance Sheet (standalone)
Y/E March ( `cr)
FY14
FY15
FY16
FY17E
FY18E
FY19E
Share Capital
20
27
27
27
27
27
Reserve & Surplus
432
745
851
1,043
1,281
1,592
Networth
452
771
878
1,069
1,308
1,619
Borrowing
5,269
7,375
9,478
12,108
15,014
18,693
- YoY Growth (%)
49
40
29
28
24
25
Other Liab. & Prov.
191
188
438
371
614
858
Total Liabilities
5,912
8,334
10,795
13,549
16,936
21,170
Investment
15
15
15
19
24
30
Advance
5,874
8,302
10,753
13,500
16,875
21,094
- YoY Growth (%)
46
41
30
26
25
25
Fixed Asset
8
9
9
13
16
20
Other Assets
14
8
18
17
21
26
Total Asset
5,912
8,334
10,795
13,549
16,937
21,170
January 27, 2017
12
Can Fin Homes | Initiating Coverage
Ratio analysis (standalone)
Profitability Ratio (%)
FY14
FY15
FY16
FY17E
FY18E
FY19E
NIMs
2.7
2.5
3.2
3.5
3.5
3.5
Cost to Asset
0.9
0.8
0.7
0.6
0.7
0.7
Cost to Income
28.3
26.6
19.6
16.9
18.2
18.0
RoA
1.5
1.2
1.6
1.9
1.9
2.0
ROE
17.9
14.1
19.0
23.6
24.1
25.6
Asset Quality (%)
Gross NPAs
0.2
0.2
0.2
0.2
0.3
0.3
Net NPAs
0.0
0.0
0.0
0.0
0.0
0.0
Credit Cost
0.1
0.2
0.2
0.2
0.3
0.3
Per Share Data (`)
EPS
37
32
59
87
108
141
BV
221
290
330
402
491
608
DPS
7
7
10
15
18
24
Valuation Ratios
PER (x)
47
53
29
20
16
12
P/BV
7.8
6.0
5.2
4.3
3.5
2.8
Dividend Yield (%)
0.4
0.4
0.6
0.9
1.1
1.4
DuPont Analysis
FY14
FY15
FY16
FY17E
FY18E
FY19E
Interest Income
11.2
11.1
10.9
10.8
10.7
10.7
Interest expenses
8.5
8.6
7.8
7.4
7.3
7.2
Net Interest Income
2.7
2.5
3.1
3.5
3.4
3.5
Fees & Other Income
0.4
0.4
0.4
0.4
0.4
0.4
Total Income
3.1
2.9
3.5
3.8
3.8
3.9
Opex
0.9
0.8
0.7
0.6
0.7
0.7
PPP
2.2
2.1
2.9
3.2
3.1
3.2
Provision
0.1
0.2
0.2
0.2
0.3
0.3
PBT
2.1
1.9
2.6
3.0
2.9
2.9
Tax
0.6
0.7
1.0
1.1
1.0
1.0
RoA
1.5
1.2
1.6
1.9
1.9
2.0
Leverage
11.8
11.6
11.6
12.5
12.8
13.0
RoE (%)
17.9
14.0
19.0
23.6
24.1
25.6
January 27, 2017
13
Can Fin Homes | Initiating Coverage
Research Team Tel: 022 - 39357800
DISCLAIMER
Angel Broking Private Limited (hereinafter referred to as “Angel”) is a registered Member of National Stock Exchange of India Limited,
Bombay Stock Exchange Limited and Metropolitan Stock Exchange Limited. It is also registered as a Depository Participant with CDSL
and Portfolio Manager with SEBI. It also has registration with AMFI as a Mutual Fund Distributor. Angel Broking Private Limited is a
registered entity with SEBI for Research Analyst in terms of SEBI (Research Analyst) Regulations, 2014 vide registration number
INH000000164. Angel or its associates has not been debarred/ suspended by SEBI or any other regulatory authority for accessing
/dealing in securities Market. Angel or its associates/analyst has not received any compensation / managed or co-managed public
offering of securities of the company covered by Analyst during the past twelve months.
This document is solely for the personal information of the recipient, and must not be singularly used as the basis of any investment
decision. Nothing in this document should be construed as investment or financial advice. Each recipient of this document should
make such investigations as they deem necessary to arrive at an independent evaluation of an investment in the securities of the
companies referred to in this document (including the merits and risks involved), and should consult their own advisors to determine
the merits and risks of such an investment.
Reports based on technical and derivative analysis center on studying charts of a stock's price movement, outstanding positions and
trading volume, as opposed to focusing on a company's fundamentals and, as such, may not match with a report on a company's
fundamentals. Investors are advised to refer the Fundamental and Technical Research Reports available on our website to evaluate the
contrary view, if any.
The information in this document has been printed on the basis of publicly available information, internal data and other reliable
sources believed to be true, but we do not represent that it is accurate or complete and it should not be relied on as such, as this
document is for general guidance only. Angel Broking Pvt. Limited or any of its affiliates/ group companies shall not be in any way
responsible for any loss or damage that may arise to any person from any inadvertent error in the information contained in this report.
Angel Broking Pvt. Limited has not independently verified all the information contained within this document. Accordingly, we cannot
testify, nor make any representation or warranty, express or implied, to the accuracy, contents or data contained within this document.
While Angel Broking Pvt. Limited endeavors to update on a reasonable basis the information discussed in this material, there may be
regulatory, compliance, or other reasons that prevent us from doing so.
This document is being supplied to you solely for your information, and its contents, information or data may not be reproduced,
redistributed or passed on, directly or indirectly.
Neither Angel Broking Pvt. Limited, nor its directors, employees or affiliates shall be liable for any loss or damage that may arise from
or in connection with the use of this information.
Disclosure of Interest Statement
Can Fin Homes
1. Financial interest of research analyst or Angel or his Associate or his relative
No
2. Ownership of 1% or more of the stock by research analyst or Angel or associates or relatives
No
3. Served as an officer, director or employee of the company covered under Research
No
4. Broking relationship with company covered under Research
No
Ratings (Based on expected returns
Buy (> 15%)
Accumulate (5% to 15%)
Neutral (-5 to 5%)
over 12 months investment period):
Reduce (-5% to -15%)
Sell (< -15)
January 27, 2017
14