4QFY2016 Result Update | Pharmaceutical
May 21, 2016
Cadila Healthcare
BUY
CMP
`325
Performance Highlights
Target Price
`400
Investment Period
12 Months
Y/E March (` cr)
4QFY2016 3QFY2016
% chg (qoq) 4QFY2015
% chg (yoy)
Net sales
2,376
2342
1.4
2247
5.7
Stock Info
Other income
99
112
(12.1)
63
57.3
Sector
Pharmaceutical
Gross profit
1553
1542
0.7
1445
7.5
Market Cap (` cr)
33,220
Operating profit
508
492
3.2
455
11.7
Net debt (` cr)
1,550
Adj. Net profit
388
390
(0.4)
351
10.6
Source: Company, Angel Research
Beta
0.7
52 Week High / Low
454 / 296
For 4QFY2016, Cadila Healthcare (Cadila) posted a robust performance on the
Avg. Daily Volume
1,12,106
net profit front while sales came in lower than expected. Sales came in at
Face Value (`)
1
`2,376cr (V/s `2,400cr expected), growing by 5.7% yoy. On the operating front,
BSE Sensex
25,400
the OPM came in at 21.4% V/s 21.1% expected and V/s 20.2% in 4QFY2015.
Nifty
7,783
The expansion in the OPM was driven by expansion in the GPM to 65.4% (V/s
Reuters Code
CADI.BO
64.3% in 4QFY2015) despite increase in staff expenditure and other expenditure
Bloomberg Code
CDH@IN
by 13.7% yoy 3.8% yoy respectively. R&D expenditure during the quarter came in
at 7.6% V/s 8.4% of sales in 4QFY2015. The Adj. net profit came in at `388cr V/s
`373cr expected and V/s `351cr in 4QFY2015, ie a yoy growth of 10.6%. We
Shareholding Pattern (%)
maintain our Buy on the stock.
Promoters
74.8
MF / Banks / Indian Fls
9.7
Results better than expected at the net profit level: For 4QFY2016, sales came in
FII / NRIs / OCBs
9.6
at `2,342cr (V/s `2,400cr expected), growing by 5.7% yoy. On the operating
Indian Public / Others
6.0
front, the OPM came in at 21.4% V/s 21.1% expected and V/s 20.2% in
4QFY2015. The expansion in the OPM was driven by expansion in the GPM to
65.4% (V/s 64.3% in 4QFY2015) and despite 13.7% yoy growth in the staff
Abs.(%)
3m 1yr 3yr
expenditure and 3.8% yoy rise in other expenditure. R&D expenditure during the
Sensex
7.1
(8.1)
(8.1)
quarter came in at 7.6% V/s 8.4% of sales in 4QFY2015. The Adj. net profit came
Cadila
(0.8)
(6.3)
(84.4)
in at `388cr V/s `351cr in 4QFY2015, a yoy growth of 10.6%.
Outlook and valuation: We expect Cadila’s net sales to post a 17.8% CAGR to
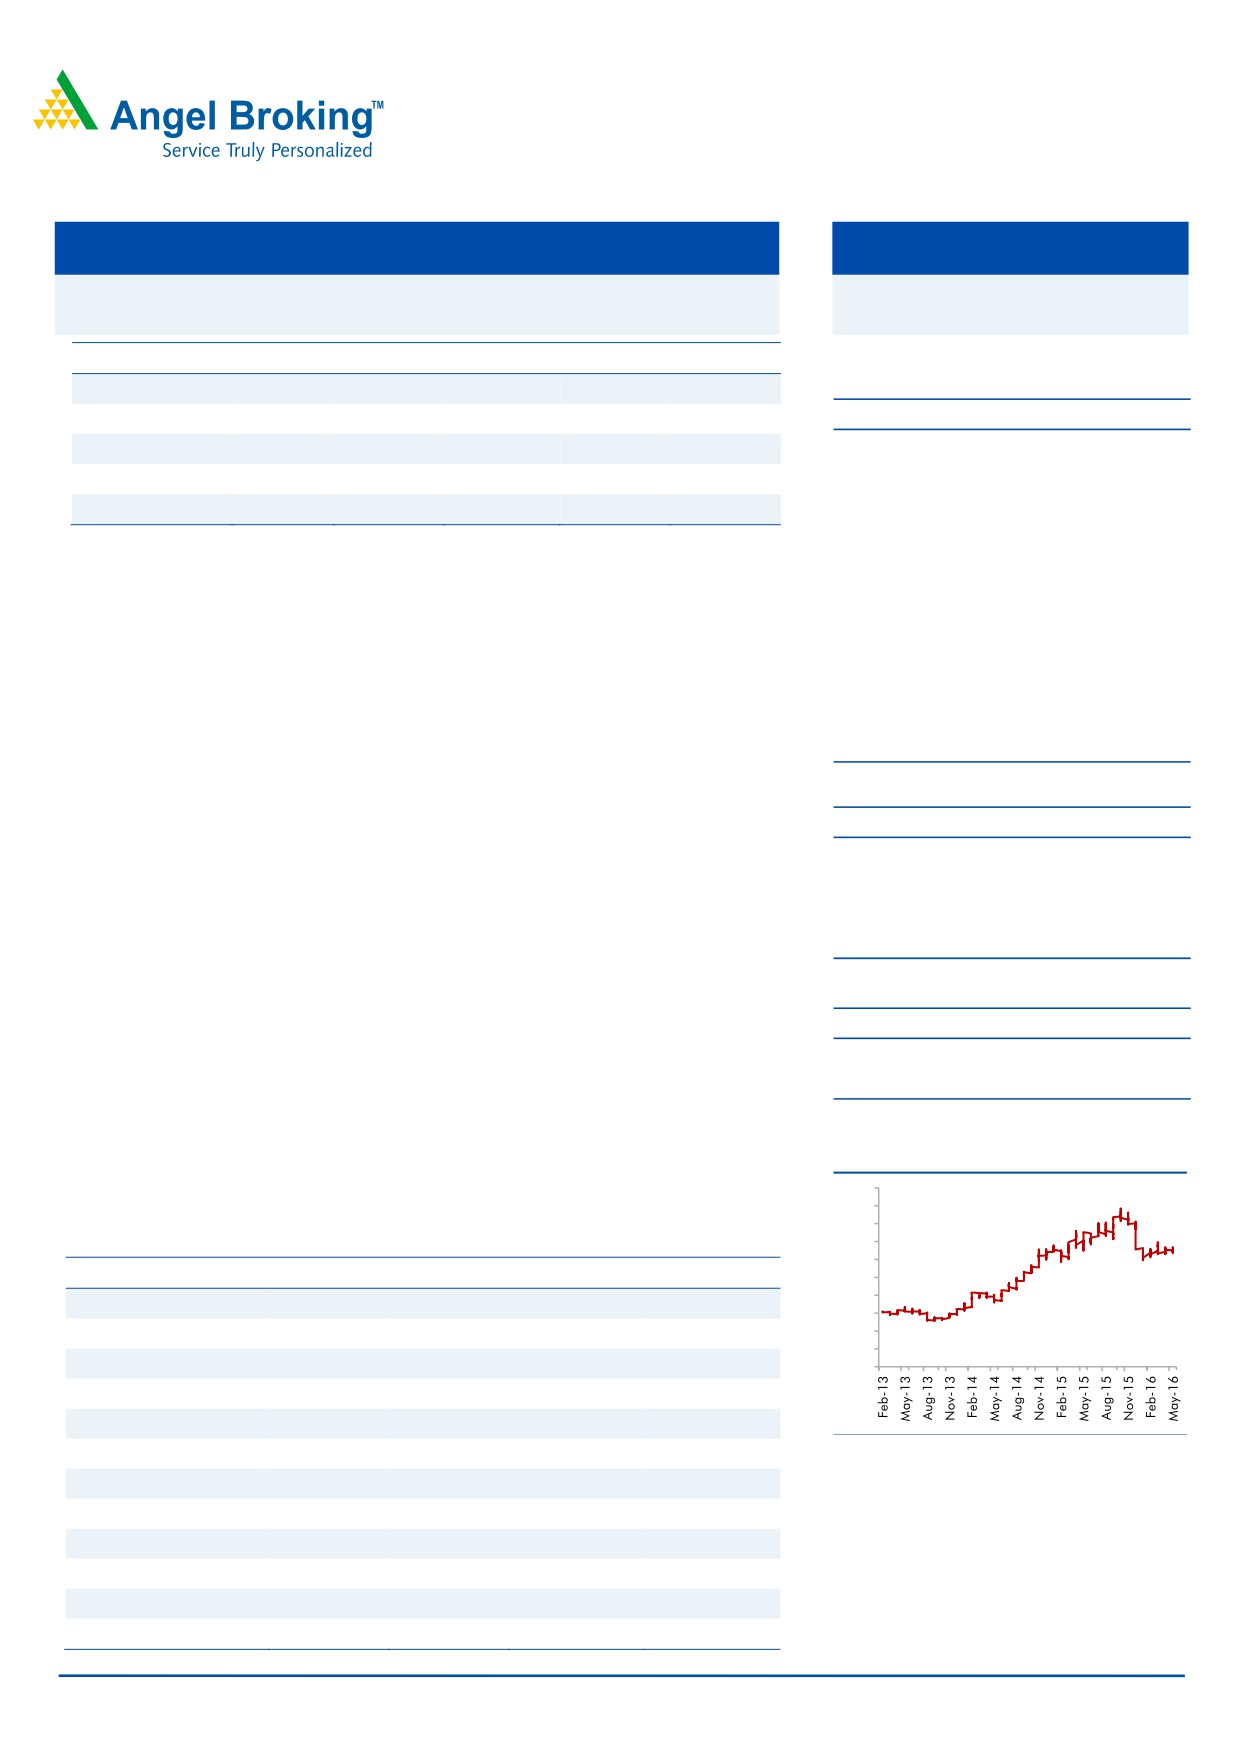
3-Year Daily Price Chart
`13,148cr and EPS to report a 15.8% CAGR to `20.0 over FY2016-18E. We
500
maintain our Buy rating on the stock.
450
400
Key financials (Consolidated)
350
300
Y E March (` cr)
FY2015
FY2016
FY2017E
FY2018E
250
200
Net sales
8,497
9,469
11,126
13,148
150
100
% chg
20.4
11.4
17.5
18.2
50
Net profit
1,159
1,524
1,752
2,044
0
% chg
41.5
31.5
14.9
16.7
EPS
11.3
14.9
17.1
20.0
Source: Company, Angel Research
EBITDA margin (%)
18.8
21.2
22.0
22.0
P/E (x)
28.2
21.5
18.7
16.0
RoE (%)
30.1
31.7
28.8
26.6
RoCE (%)
20.2
23.1
24.2
24.3
P/BV (x)
7.7
6.1
4.8
3.8
Sarabjit Kour Nangra
EV/Sales (x)
4.0
3.5
2.9
2.3
+91 22 39357600 Ext: 6806
EV/EBITDA (x)
21.1
16.6
13.2
10.7
Source: Company, Angel Research; Note: CMP as of May 19, 2016
Please refer to important disclosures at the end of this report
1
Cadila Healthcare | 4QFY2016 Result Update
Exhibit 1: 4QFY2016 performance (Consolidated)
Y/E March (` cr)
4QFY2016
3QFY2016
% chg (qoq)
4QFY2015
% chg (yoy) FY2016 FY2015
% chg
Net Sales
2,376
2,342
1.4
2,247
5.7
9,469
8,497
11.4
Other Income
99
112
(12.1)
63
57.3
460
210
119.2
Total Income
2,474
2,454
0.8
2,310
7.1
9,930
8,707
14.0
Gross profit
1553
1542
0.7
1445
7.5
6192
5106
21.3
Gross margin (%)
65.4
65.9
64.3
65.4
60.1
Operating profit
508
492
3.2
455
11.7
2012
1600
25.8
Operating Margin (%)
21.4
21.0
20.2
21.2
18.8
Financial Cost
10
13
(20.6)
16
(38.6)
49
68
(28.5)
Depreciation
78
77
1.7
76
3.6
302
287
5.3
PBT
518
515
0.7
426
21.8
2122
1455
45.8
Tax
126
115
9.6
71
78.0
571
259
120.5
Adj. PAT before Extra-ordinary item
392
400
(1.8)
355
10.6
1551
1196
29.7
Exceptional loss/(gain)
(1)
0
1
2
(9)
Minority
(3)
9
(137.0)
5
30
36
Reported PAT
389
390
(0.2)
350
10.9
1523
1151
32.3
Adj. PAT
388
390
(0.4)
351
10.6
1524
1159
31.5
EPS (`)
3.8
3.8
3.4
14.9
11.3
Source: Company, Angel Research
Exhibit 2: 4QFY2016 - Actual vs. Angel estimates
(` cr)
Actual
Estimates
Variance
Net Sales
2,376
2,400
(1.0)
Operating profit
508
507
0.2
Tax
126
115
9.6
Net profit
388
373
3.9
Source: Company, Angel Research
Revenue up 8.4% yoy; marginally lower than our expectation
For 4QFY2016, the company posted sales of `2,376cr (V/s `2,400cr expected), a
growth of 8.4% yoy. Exports (`1,459.3cr) posted a 2.5% yoy growth during the
quarter while domestic markets (`968.7cr) posted a 10.4% yoy growth.
In exports the key market US (`961.0cr) posted a yoy de-growth of
1.8%,
while Europe (`70.6cr) posted a dip of 4.6%. Emerging Markets Formulations
(`134.3cr) posted a yoy growth of 21.3%. JVs and alliances (`145.9cr) posted a
dip of 23.8% yoy. In domestic markets, Indian formulations (`767.4cr) posted a
yoy growth of 12.9%.
May 21, 2016
2
Cadila Healthcare | 4QFY2016 Result Update
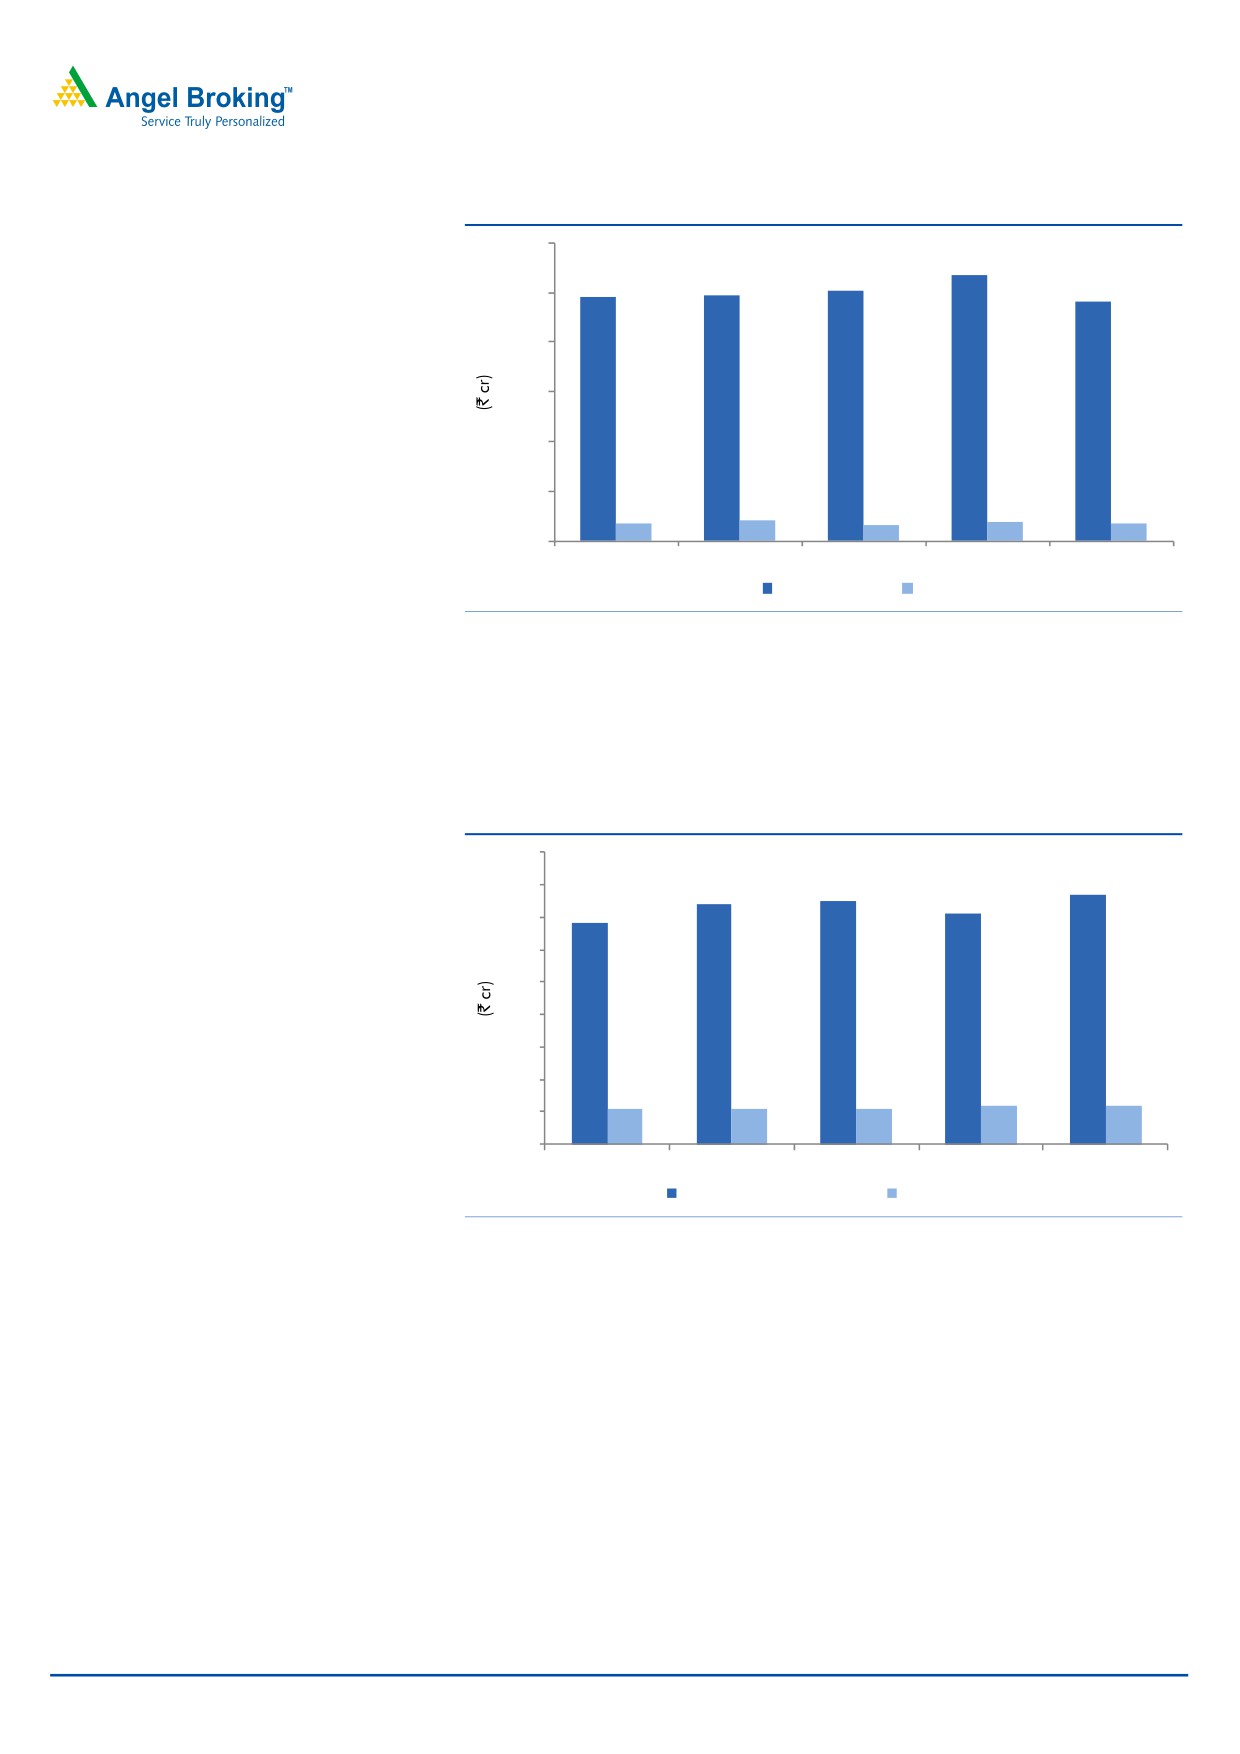
Exhibit 3: Sales trend in the US and Europe
1,200
1,072
979
985
1,004
961
1,000
800
600
400
200
74
84
65
76
70
0
4QFY2015
1QFY2016
2QFY2016
3QFY2016
4QFY2016
US
Europe
Source: Company, Angel Research
The growth in the domestic market (~40% of sales) was of 10.4% yoy, mainly led
by formulations (`767.4cr) which grew by 12.9% yoy. API (`92.2cr) on the other
hand grew by 6.0% yoy, while Wellness (`116.9cr) grew by 5.0% yoy. Animal
Health and others (`84.4cr) grew by 2.5% yoy.
Exhibit 4: Sales trend in Domestic Formulation and Consumer Wellness Divisions
900
767
800
742
751
713
680
700
600
500
400
300
200
111
111
112
118
117
100
0
4QFY2015
1QFY2016
2QFY2016
3QFY2016
4QFY2016
Domestic Formulation
Consumer division
Source: Company, Angel Research
On the CRAMS front, the company generated sales of `145.9cr (vs `117.8cr in
4QFY2015), reporting a growth of 23.8% yoy.
OPM better than expectation
On the operating front, the OPM came in at 21.4% V/s 21.1% expected and V/s
20.2% in 4QFY2015. The expansion in the OPM was driven by expansion in the
GPM to 65.4% (V/s 64.3% in 4QFY2015) and despite a 13.7% yoy growth in staff
expenditure and 3.8% rise in other expenditure. R&D expenditure during the
quarter came in at 7.6% V/s 8.4% of sales in 4QFY2015.
May 21, 2016
3
Cadila Healthcare | 4QFY2016 Result Update
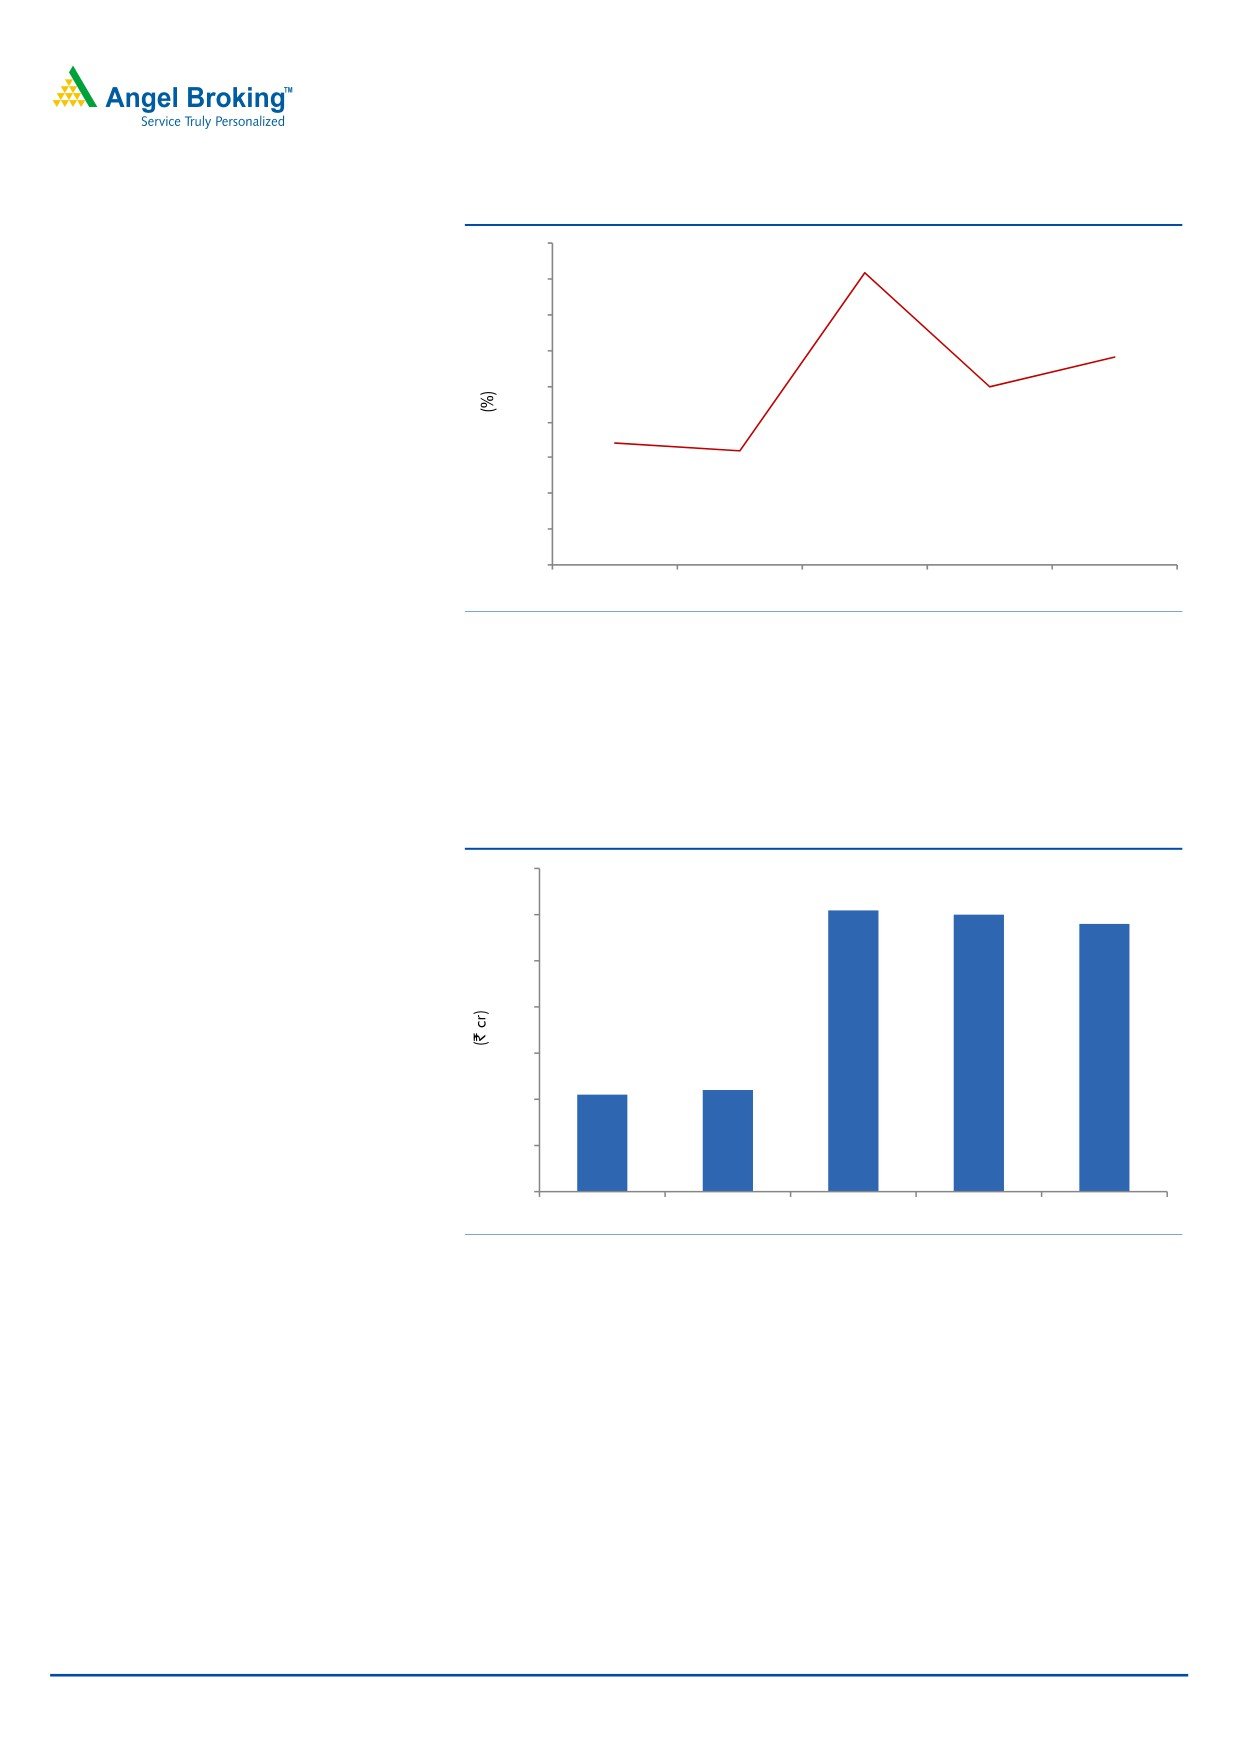
Exhibit 5: OPM trend
23.0
22.5
22.6
22.0
21.5
21.4
21.0
20.5
21.0
20.0
20.2
20.1
19.5
19.0
18.5
4QFY2015
1QFY2016
2QFY2016
3QFY2016
4QFY2016
Source: Company, Angel Research
Net profit up 12.1% yoy: During the quarter, the company posted other income of
`99cr V/s `63cr in 4QFY2015. This aided the net profit to come in at `389cr V/s
`373cr expected and V/s `350cr in 4QFY2015, ie yoy growth of 10.9%. The Adj.
net profit came in at `388cr V/s `351cr in 4QFY2015, a yoy growth of 10.6%.
Exhibit 6: Adjusted Net profit trend
400
391
390
388
390
380
370
360
352
351
350
340
330
4QFY2015
1QFY2016
2QFY2016
3QFY2016
4QFY2016
Source: Company, Angel Research
Concall takeaways
Remediation at Moraiya is to be completed by May 2016. Cadila plans to
meet the USFDA over the next two months.
Tax rate is expected at ~20% in FY2017.
R&D as a percentage of sales to be at ~6% in FY2017.
Five product transfers have been carried out from Moraiya to Baddi in
4QFY2016 (taking the total to 12).
May 21, 2016
4
Cadila Healthcare | 4QFY2016 Result Update
Recommendation rationale
Strong domestic portfolio: Cadila is the fifth largest player in the domestic market
with sales of about `2,973cr in FY2016; the domestic market contributes ~39% to
its top-line. The company enjoys a leadership position in the CVS, GI, women
healthcare and respiratory segments, and has a sales force of 4,500 executives.
The company, on an aggressive front, launched more than 75 new products in
FY2014. During FY2009-14, the company reported a ~13% CAGR in its top-line
in the domestic formulation business.
Further, the company has a strong consumer division through its stake in Zydus
Wellness, which has premium brands such as Sugarfree, Everyuth and Nutralite,
under its umbrella. This segment which contributes ~4.7% of sales, registered a
growth of 3.2% yoy during FY2016.
Going forward, the company expects the segment to grow at an above-industry
rate on the back of new product launches and field force expansion. In FY2014,
sales were lower; however, FY2016 witnessed a rebound. During FY2016-18E, we
expect the domestic segment to grow at a CAGR of 9.6%.
Exports on a strong footing: Cadila has a two-fold focus on exports, wherein it is
targeting developed as well as emerging markets, which contributed around 61%
to its FY2016 top-line. The company has established a formidable presence in the
developed markets of US, Europe (France and Spain) and Japan. In the US, the
company achieved critical scale of `3,393cr on the sales front in FY2016. The
growth in exports to the US along with other regions like Europe would be driven
by new product launches, going forward. Overall, exports are expected to post a
CAGR of 17.5% over FY2016-18E.
Outlook and valuation
We expect Cadila’s net sales to post a 17.8% CAGR to `13,148cr and EPS to
report a 15.8% CAGR to `20.0 over FY2016-18E. We maintain our Buy rating on
the stock.
Exhibit 7: Key Assumptions
Key assumptions
FY2017E
FY2018E
Domestic growth (%)
13.0
15.0
Exports growth (%)
20.0
20.0
Growth in employee expenses (%)
24.1
15.8
Operating margins (excl tech. know-how fees) (%)
22.0
22.0
Capex (` cr)
650
650
Source: Company, Angel Research
May 21, 2016
5
Cadila Healthcare | 4QFY2016 Result Update
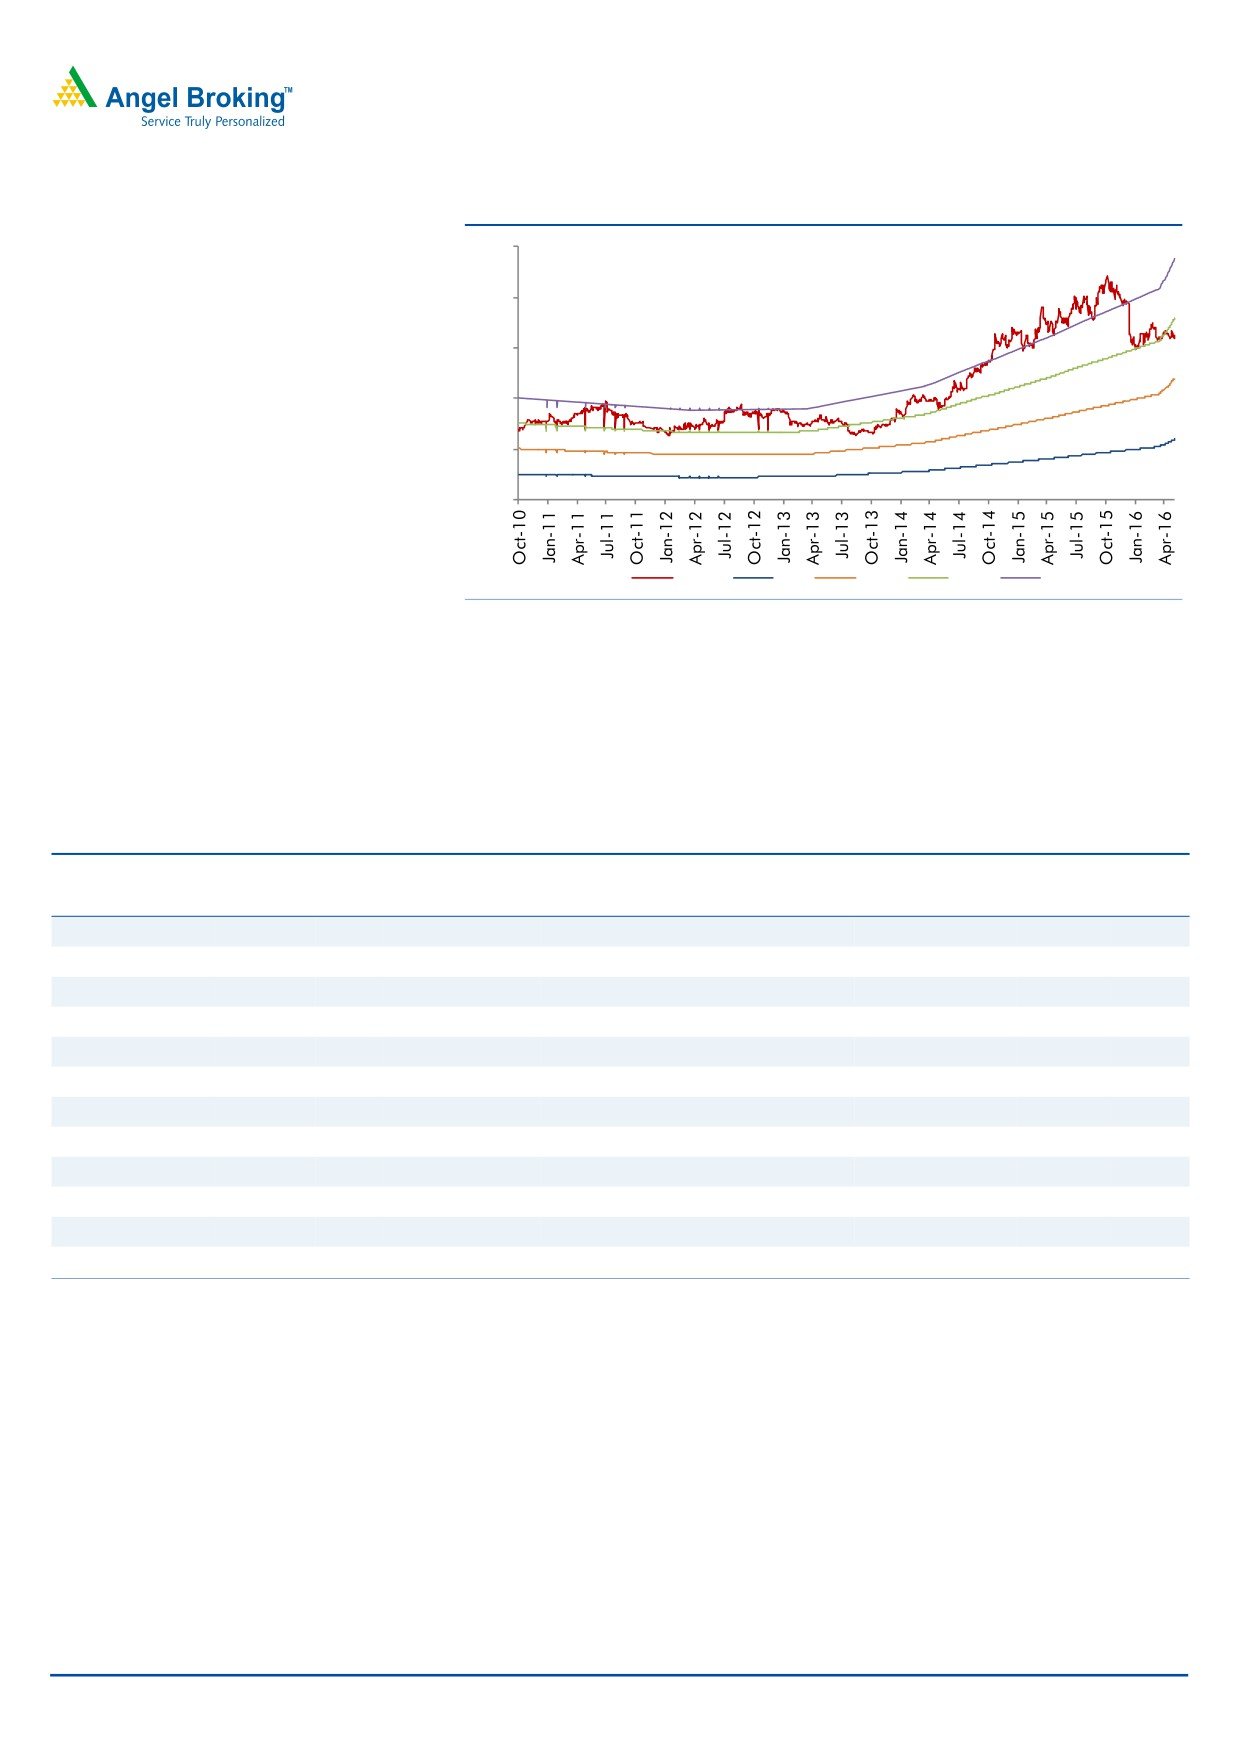
Exhibit 8: One-year forward PE band
500
400
300
200
100
0
Price
7x
14x
21x
28x
Source: Company
Company background: Cadila Healthcare‘s operations range across API,
formulations, animal health products and cosmeceuticals. The group has global
operations spread across USA, Europe, Japan, Brazil, South Africa and 25 other
emerging markets. Having already achieved the US$1bn sales mark in 2011, the
company aims to be a research-driven pharmaceutical company by 2020.
Exhibit 9: Recommendation Summary
Company
Reco
CMP Tgt. price Upside
FY2017E
FY15-17E
FY2017E
(`)
(`)
% PE (x) EV/Sales (x) EV/EBITDA (x)
CAGR in EPS (%) RoCE (%) RoE (%)
Alembic Pharma
Neutral
556
-
-
19.4
2.7
13.7
11.4
23.5
21.3
Aurobindo Pharma Accumulate
770
856
11.2
18.0
2.9
12.6
15.6
23.5
30.2
Cadila Healthcare Buy
325
400
23.3
18.7
2.9
12.6
22.9
24.2
28.8
Cipla
Buy
513
605
18.0
18.6
2.4
13.1
18.3
16.7
16.1
Dr Reddy's
Buy
3,021
3,476
15.0
19.8
2.8
11.8
6.8
19.2
18.7
Dishman Pharma Neutral
165
-
-
16.5
1.8
8.1
15.9
9.4
11.0
GSK Pharma*
Neutral
3,345
-
-
49.0
8.6
38.7
6.6
33.7
34.3
Indoco Remedies Neutral
261
-
-
19.2
2.1
11.4
23.0
19.7
19.7
Ipca labs
Buy
448
750
67.4
16.0
1.7
9.1
17.9
11.8
14.9
Lupin
Neutral
1,656
-
-
24.2
4.2
15.4
13.1
29.6
24.7
Sanofi India
Accumulate
4,292
4,738
10.4
28.0
3.8
22.2
34.2
21.0
25.6
Sun Pharma
Buy
792
950
19.9
29.5
5.2
16.8
8.4
15.8
16.6
Source: Company, Angel Research; Note: *December year ending
May 21, 2016
6
Cadila Healthcare | 4QFY2016 Result Update
Profit & Loss statement (Consolidated)
Y/E March (` cr)
FY2013
FY2014
FY2015
FY2016
FY2017E
FY2018E
Gross sales
6,285
7,208
8,658
9,660
11,336
13,396
Less: Excise duty
129
148
161
190
210
248
Net sales
6,155
7,060
8,497
9,469
11,126
13,148
Other operating income
203
164
154
368
368
368
Total operating income
6,358
7,224
8,651
9,838
11,494
13,517
% chg
20.8
13.6
19.8
13.7
16.8
17.6
Total expenditure
5,232
6,024
6,896
7,457
8,673
10,250
Net raw materials
2,320
2,714
3,197
3,277
4,005
4,733
Other mfg costs
387
443
534
595
699
826
Personnel
903
1,071
1,209
1,334
1,633
1,929
Other
1,622
1,796
2,107
2,252
2,336
2,761
EBITDA
923
1,036
1,601
2,012
2,453
2,899
% chg
1.4
12.3
54.6
25.6
21.9
18.2
(% of Net Sales)
15.0
14.7
18.8
21.2
22.0
22.0
Depreciation& amortisation
183
201
287
302
393
439
EBIT
740
835
1,314
1,710
2,059
2,460
% chg
(1.7)
12.8
57.4
30.1
20.4
19.4
(% of Net Sales)
12.0
11.8
15.5
18.1
18.5
18.7
Interest & other charges
169
90
68
49
84
84
Other income
37
51
55
94
94
94
(% of PBT)
5
5
4
4
4
3
Recurring PBT
811
959
1,456
2,124
2,437
2,838
% chg
2.1
18.3
51.8
45.9
14.8
16.4
Extraordinary expense/(Inc.)
-
17
10
2
-
-
PBT (reported)
811
942
1,445
2,124
2,437
2,838
Tax
119.5
106.0
259.4
571.1
655.6
763.3
(% of PBT)
14.7
11.3
17.9
26.9
26.9
26.9
PAT (reported)
692
836
1,186
1,553
1,782
2,074
Less: Minority interest (MI)
36.4
32.6
35.5
30.0
30.0
30.0
PAT after MI (reported)
655
804
1,151
1,523
1,752
2,044
ADJ. PAT
655
819
1,159
1,524
1,752
2,044
% chg
0.8
25.0
41.5
31.5
14.9
16.7
(% of Net Sales)
10.6
11.4
13.5
16.1
15.7
15.5
Adj.Basic EPS (`)
6.4
8.0
11.3
14.9
17.1
20.0
Adj. Fully Diluted EPS (`)
6.4
8.0
11.3
14.9
17.1
20.0
% chg
0.8
25.0
41.5
31.5
14.9
16.7
May 21, 2016
7
Cadila Healthcare | 4QFY2016 Result Update
Balance Sheet (Consolidated)
Y/E March (` cr)
FY2013
FY2014
FY2015
FY2016
FY2017E
FY2018E
SOURCES OF FUNDS
Equity share capital
102
102
102
102
102
102
Reserves & Surplus
2,938
3,337
4,149
5,250
6,714
8,471
Shareholders funds
3,040
3,439
4,252
5,352
6,816
8,574
Minority interest
119
144
169
135
165
195
Total loans
2,681
2,265
2,334
2,107
2,107
2,107
Other Long Term Liabilities
47
55
43
61
45
46
Long Term Provisions
64
76
110
77
78
79
Deferred tax liability
100
96
59
88
121
122
Total liabilities
6,053
6,075
6,966
7,820
9,209
10,998
APPLICATION OF FUNDS
Gross block
4,104
3,756
4,353
5,296
5,946
6,596
Less: Acc. depreciation
1,358
1,540
1,827
2,130
2,523
2,962
Net block
2,746
2,214
2,526
3,166
3,423
3,634
Capital Work-in-Progress
248
892
892
892
892
892
Goodwill
862
908
733
733
733
733
Investments
21
87
154
266
266
266
Long Term Loans and Adv.
411
495
637
756
663
779
Current assets
3,191
3,391
4,105
4,205
6,245
8,254
Cash
582
549
670
695
1,967
3,259
Loans & advances
279
341
334
335
336
337
Other
2,330
2,501
3,102
3,174
3,942
4,658
Current liabilities
1,426
1,912
2,081
2,196
3,012
3,560
Net Current assets
1,765
1,480
2,024
2,008
3,233
4,694
Mis. Exp. not written off
-
-
-
(1)
-
-
Total assets
6,053
6,075
6,966
7,820
9,209
10,998
May 21, 2016
8
Cadila Healthcare | 4QFY2016 Result Update
Cash Flow Statement (Consolidated)
Y/E March (` cr)
FY2013 FY2014 FY2015 FY2016 FY2017E FY2018E
Profit before tax
811
942
1,445
2,124
2,437
2,838
Depreciation
183
201
287
302
393
439
(Inc)/Dec in Working Capital
(223)
168
(565)
(78)
141
(286)
Less: Other income
37
51
55
94
94
94
Direct taxes paid
119
106
259
571
656
763
Cash Flow from Operations
614
1,154
853
1,683
2,222
2,133
(Inc.)/Dec.in Fixed Assets
(860)
(296)
(597)
(943)
(650)
(650)
(Inc.)/Dec. in Investments
3
(65)
(68)
(112)
-
-
Other income
37
51
55
94
94
94
Cash Flow from Investing
(820)
(310)
(609)
(960)
(556)
(556)
Issue of Equity
-
-
-
-
-
-
Inc./(Dec.) in loans
382
(397)
91
(242)
(16)
2
Dividend Paid (Incl. Tax)
(175)
(216)
(287)
(287)
(287)
(287)
Others
115
(264)
74
(168)
(91)
0
Cash Flow from Financing
322
(877)
(122)
(697)
(394)
(285)
Inc./(Dec.) in Cash
116
(33)
121
25
1,272
1,292
Opening Cash balances
467
582
549
670
695
1,967
Closing Cash balances
582
549
670
695
1,967
3,259
May 21, 2016
9
Cadila Healthcare | 4QFY2016 Result Update
Key Ratios
Y/E March
FY2013
FY2014
FY2015
FY2016
FY2017E
FY2018E
Valuation Ratio (x)
P/E (on FDEPS)
50.0
40.0
28.2
21.5
18.7
16.0
P/CEPS
39.0
32.0
22.6
17.9
15.2
13.2
P/BV
10.8
9.5
7.7
6.1
4.8
3.8
Dividend yield (%)
2.3
2.3
2.3
2.3
2.3
2.3
EV/Sales
1.4
1.1
4.0
3.5
2.9
2.3
EV/EBITDA
9.0
7.6
21.1
16.6
13.2
10.7
EV / Total Assets
1.4
1.3
4.9
4.3
3.5
2.8
Per Share Data (`)
EPS (Basic)
6.4
8.0
11.3
14.9
17.1
20.0
EPS (fully diluted)
6.4
8.0
11.3
14.9
17.1
20.0
Cash EPS
8.2
10.0
14.2
17.9
21.0
24.3
DPS
7.5
7.5
7.5
7.5
7.5
7.5
Book Value
29.7
33.6
41.5
52.3
66.6
83.8
Dupont Analysis
EBIT margin
12.0
11.8
15.5
18.1
18.5
18.7
Tax retention ratio
85.3
88.7
82.1
73.1
73.1
73.1
Asset turnover (x)
1.2
1.3
1.5
1.5
1.6
1.8
ROIC (Post-tax)
12.8
13.8
18.6
19.4
21.7
24.7
Cost of Debt (Post Tax)
5.8
3.2
2.4
1.6
2.9
2.9
Leverage (x)
0.7
0.6
0.4
0.3
0.1
0.0
Operating ROE
17.7
20.1
25.8
25.2
24.3
24.7
Returns (%)
ROCE (Pre-tax)
13.2
13.8
20.2
23.1
24.2
24.3
Angel ROIC (Pre-tax)
19.5
20.6
31.3
33.6
37.0
41.9
ROE
23.3
25.3
30.1
31.7
28.8
26.6
Turnover ratios (x)
Asset Turnover (Gross Block)
1.8
1.8
2.1
2.0
2.0
2.2
Inventory / Sales (days)
66
69
61
56
71
80
Receivables (days)
54
57
57
45
58
65
Payables (days)
42
55
46
45
53
53
WC (ex-cash) (days)
66
53
48
49
41
36
Solvency ratios (x)
Net debt to equity
0.7
0.5
0.4
0.3
0.0
(0.1)
Net debt to EBITDA
2.3
1.7
1.0
0.7
0.1
(0.4)
Interest Coverage (EBIT / Int.)
4.4
9.3
19.4
35.2
24.4
29.2
May 21, 2016
10
Cadila Healthcare | 4QFY2016 Result Update
Research Team Tel: 022 - 39357800
DISCLAIMER
Angel Broking Private Limited (hereinafter referred to as “Angel”) is a registered Member of National Stock Exchange of India Limited,
Bombay Stock Exchange Limited and Metropolitan Stock Exchange of India Limited. It is also registered as a Depository Participant with
CDSL and Portfolio Manager with SEBI. It also has registration with AMFI as a Mutual Fund Distributor. Angel Broking Private Limited is
a registered entity with SEBI for Research Analyst in terms of SEBI (Research Analyst) Regulations, 2014 vide registration number
INH000000164. Angel or its associates has not been debarred/ suspended by SEBI or any other regulatory authority for accessing
/dealing in securities Market. Angel or its associates including its relatives/analyst do not hold any financial interest/beneficial
ownership of more than 1% in the company covered by Analyst. Angel or its associates/analyst has not received any compensation /
managed or co-managed public offering of securities of the company covered by Analyst during the past twelve months. Angel/analyst
has not served as an officer, director or employee of company covered by Analyst and has not been engaged in market making activity
of the company covered by Analyst.
This document is solely for the personal information of the recipient, and must not be singularly used as the basis of any investment
decision. Nothing in this document should be construed as investment or financial advice. Each recipient of this document should
make such investigations as they deem necessary to arrive at an independent evaluation of an investment in the securities of the
companies referred to in this document (including the merits and risks involved), and should consult their own advisors to determine
the merits and risks of such an investment.
Reports based on technical and derivative analysis center on studying charts of a stock's price movement, outstanding positions and
trading volume, as opposed to focusing on a company's fundamentals and, as such, may not match with a report on a company's
fundamentals.
The information in this document has been printed on the basis of publicly available information, internal data and other reliable
sources believed to be true, but we do not represent that it is accurate or complete and it should not be relied on as such, as this
document is for general guidance only. Angel Broking Pvt. Limited or any of its affiliates/ group companies shall not be in any way
responsible for any loss or damage that may arise to any person from any inadvertent error in the information contained in this report.
Angel Broking Pvt. Limited has not independently verified all the information contained within this document. Accordingly, we cannot
testify, nor make any representation or warranty, express or implied, to the accuracy, contents or data contained within this document.
While Angel Broking Pvt. Limited endeavors to update on a reasonable basis the information discussed in this material, there may be
regulatory, compliance, or other reasons that prevent us from doing so.
This document is being supplied to you solely for your information, and its contents, information or data may not be reproduced,
redistributed or passed on, directly or indirectly.
Neither Angel Broking Pvt. Limited, nor its directors, employees or affiliates shall be liable for any loss or damage that may arise from
or in connection with the use of this information.
Note: Please refer to the important ‘Stock Holding Disclosure' report on the Angel website (Research Section). Also, please refer to the
latest update on respective stocks for the disclosure status in respect of those stocks. Angel Broking Pvt. Limited and its affiliates may
have investment positions in the stocks recommended in this report.
Disclosure of Interest Statement
Cadila Healthcare
1. Analyst ownership of the stock
No
2. Angel and its Group companies ownership of the stock
No
3. Angel and its Group companies' Directors ownership of the stock
No
4. Broking relationship with company covered
No
Note: We have not considered any Exposure below ` 1 lakh for Angel, its Group companies and Directors
Ratings (Based on expected returns
Buy (> 15%)
Accumulate (5% to 15%)
Neutral (-5 to 5%)
over 12 months investment period):
Reduce (-5% to -15%)
Sell (< -15)
May 21, 2016
11