2QFY2017 Result Update | Pharmaceutical
November 7, 2016
Cadila Healthcare
NEUTRAL
CMP
`390
Performance Highlights
Target Price
-
Investment Period
-
Y/E March (` cr)
2QFY2017 1QFY2017
% chg (qoq) 2QFY2016
% chg (yoy)
Net sales
2,336
2,216
5.4
2,267
3.1
Stock Info
Other income
40
86
(53.0)
140
(71.0)
Sector
Pharmaceutical
Gross profit
1493
1442
3.5
1468
1.7
Market Cap (` cr)
39,967
Operating profit
499
453
10.2bp
460
8.5bp
Net debt (` cr)
1,550
Adj. Net profit
338
356
(5.3)
475
(29.0)
Beta
0.6
Source: Company, Angel Research
52 Week High / Low
437 / 296
Avg. Daily Volume
136,696
For 2QFY2017, Cadila Healthcare posted lower than expected results with sales
Face Value (`)
1
at `2,336cr (vs. `2,737cr expected vs. `2,267cr in 2QFY2016), a yoy growth of
BSE Sensex
27,274
3.1%. On the operating front, the EBITDA margin came in at 21.4% (vs. 21.7%
Nifty
8,434
expected vs. 20.3% in 2QFY2016). The dip in the OPM was saved in spite of an
Reuters Code
CADI.BO
underperformance on the sales front as the GPM improved to 63.9% (vs. 64.8%
Bloomberg Code
CDH@IN
in 2QFY2016). The Adj. net profit came in at `338cr (vs. `461cr expected vs.
`475cr in 2QFY2016), a yoy de-growth of 29.0%. We maintain our Neutral
rating on the stock.
Shareholding Pattern (%)
Promoters
74.8
Results lower than expected: Company posted sales of `2,336cr (vs. `2,737cr
expected vs. `2,267cr in 2QFY2016), a yoy growth of 3.1%. The dip in sales was
MF / Banks / Indian Fls
9.2
owing to the USA business (`848.3cr) posting a yoy dip of 13.9%. On the
FII / NRIs / OCBs
10.4
operating front, the EBITDA margin came in at 21.4% (vs. 21.7% expected vs.
Indian Public / Others
5.6
20.3% in 2QFY2016). The dip in the OPM was saved in spite of an
underperformance on the sales front as the GPM improved to 63.9% (vs. 64.8%
Abs.(%)
3m 1yr 3yr
in 2QFY2016). The Adj. net profit came in at `338cr (vs. `461cr expected vs.
Sensex
(1.0)
3.2
29.1
`475cr in 2QFY2016), a yoy de-growth of 29.0%.
Cadila
14.3
(6.2)
182.2
Outlook and valuation: We expect Cadila’s net sales to post 14.1% CAGR to
`12,318cr and EPS to report 13.4% CAGR to `19.2 over FY2016-18E. We
maintain our Neutral rating on the stock.
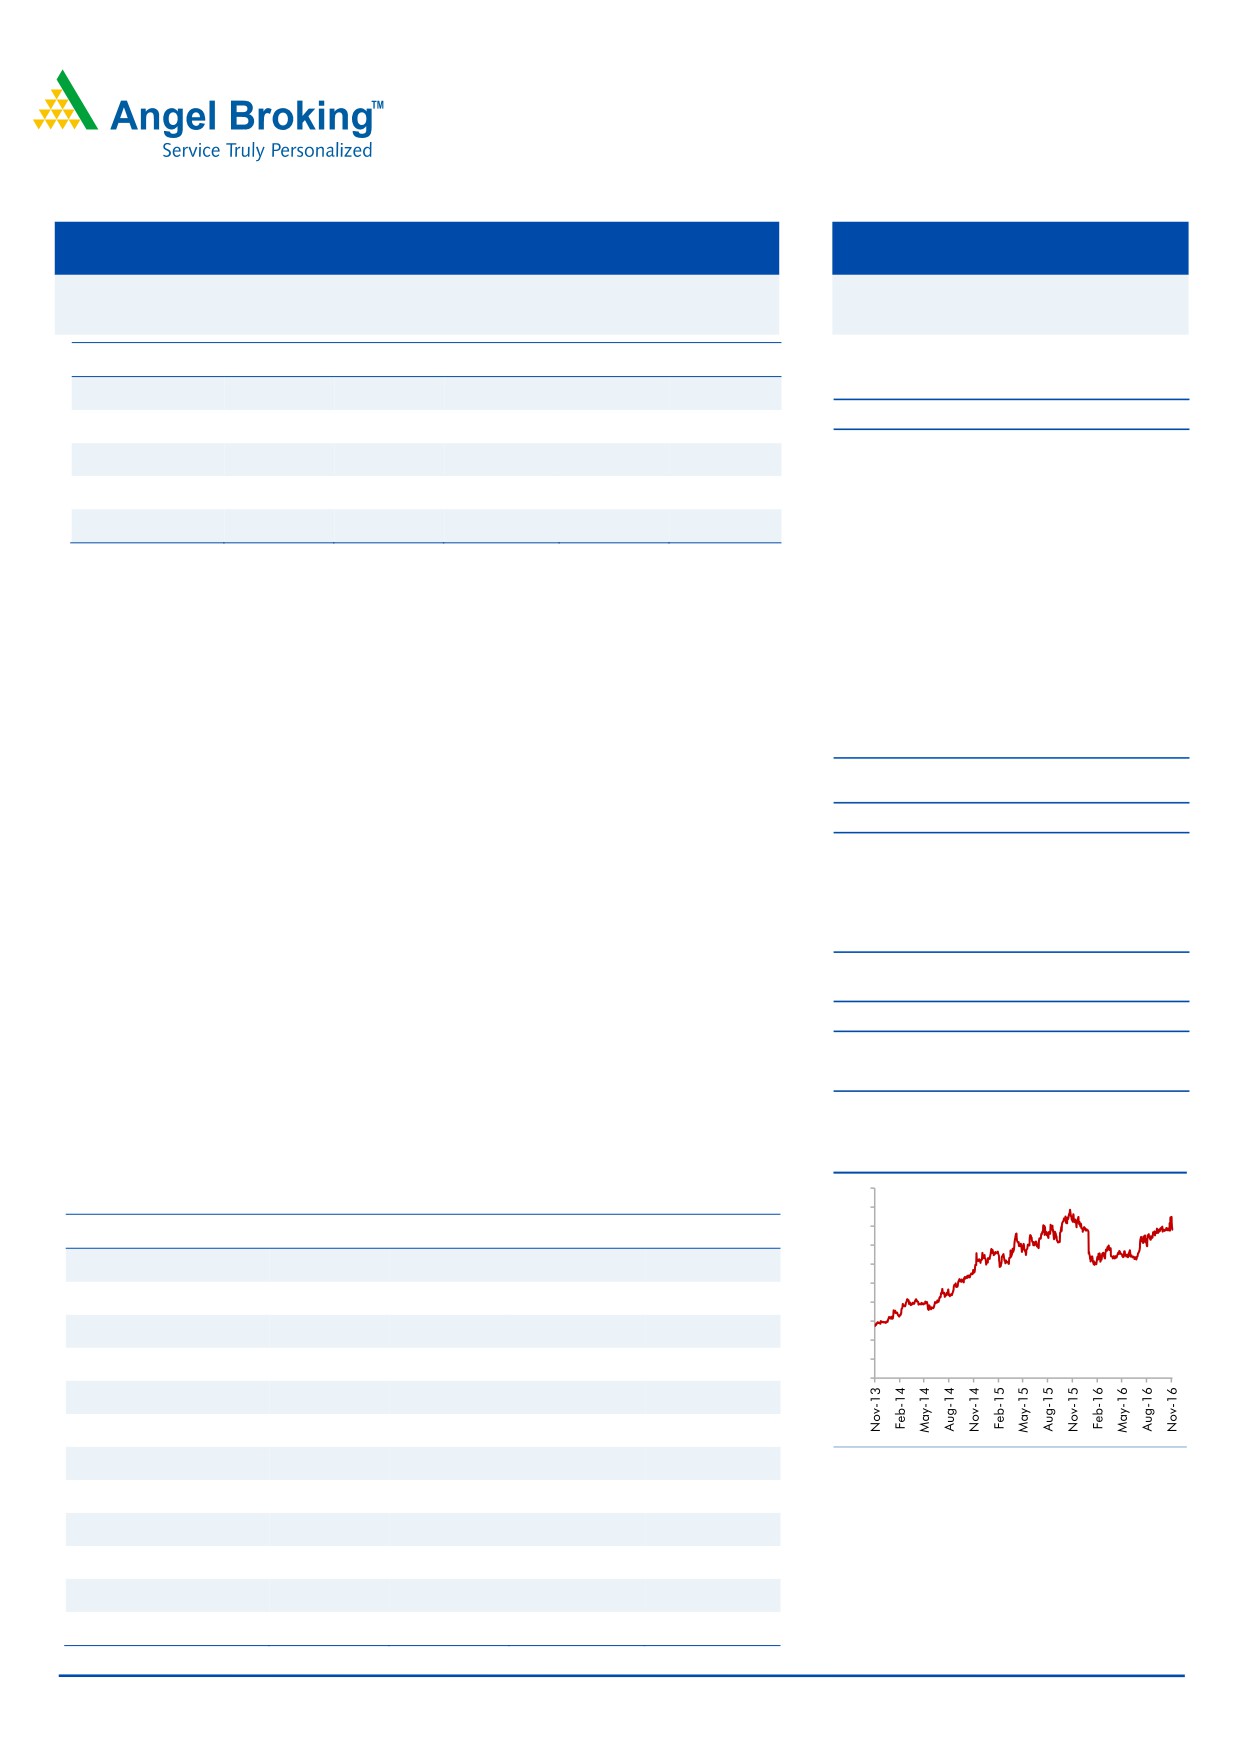
3-Year Daily Price Chart
500
Key financials (Consolidated)
450
400
Y E March (` cr)
FY2015
FY2016
FY2017E
FY2018E
350
Net sales
8,497
9,469
10,429
12,318
300
250
% chg
20.4
11.4
10.1
18.1
200
150
Net profit
1,159
1,524
1,728
1,961
100
50
% chg
41.5
31.5
13.4
13.5
0
EPS
11.3
14.9
16.9
19.2
EBITDA margin (%)
18.8
21.2
22.6
22.0
P/E (x)
34.5
26.2
23.1
20.4
Source: Company, Angel Research
RoE (%)
30.1
31.7
28.5
25.7
RoCE (%)
20.2
23.1
23.1
22.7
P/BV (x)
9.5
7.6
6.0
4.8
EV/Sales (x)
4.9
4.4
3.8
3.1
Sarabjit Kour Nangra
+91 22 39357600 Ext: 6806
EV/EBITDA (x)
26.0
20.5
17.0
14.3
Source: Company, Angel Research; Note: CMP as of November 4, 2016
Please refer to important disclosures at the end of this report
1
Cadila Healthcare | 2QFY2017 Result Update
Exhibit 1: 2QFY2017 performance (Consolidated)
Y/E March (` cr)
2QFY2017
1QFY2017
% chg (qoq)
2QFY2016
% chg (yoy)
1HFY2017
1HFY2016
% chg
Net Sales
2,336
2,216
5.4
2,267
3.1
4,553
4,534
0.4
Other Income
40
86
(53.0)
140
(71.0)
126
244
(48.2)
Total Income
2,377
2,302
3.2
2,407
(1.2)
4,679
4,777
(2.1)
Gross profit
1493
1442
3.5
1468
1.7
2935
2977
(1.4)
Gross margin (%)
63.9
65.1
64.8
64.5
65.7
Operating profit
499
453
10.2
460
8.5
952
986
(3.4)
Operating Margin (%)
21.4
20.4
20.3
20.9
21.8
Financial Cost
19
14
33.6
12
57.1
33
25
31.3
Depreciation
86
84
2.5
69
25.0
171
142
20.6
PBT
435
441
(1.5)
519
(16.2)
875
1064
(17.7)
Tax
107
97
10.6
72
49.0
203
150
36.1
Adj. PAT before
328
344
(4.8)
468
(29.9)
672
914
(26.5)
Extra-ordinary item
Exceptional loss/(gain)
(9)
6
0
37
39
Minority
18
18
(3.3)
8
15
17
Reported PAT
338
343
(1.6)
475
(28.9)
694
935
(25.8)
Adj. PAT
338
356
(5.3)
475
(29.0)
694
938
(26.0)
EPS (`)
3.3
3.5
4.6
6.8
9.2
Source: Company, Angel Research
Exhibit 2: 2QFY2017 - Actual vs. Angel estimates
(` cr)
Actual
Estimates
Variance
Net Sales
2,336
2,737
(14.6)
Operating profit
499
593
(15.8)
Tax
107
97
10.6
Net profit
338
461
(26.7)
Source: Company, Angel Research
Revenue lower than our expectation
In INR terms, the consolidated revenues came in at `2,336cr (vs. `2,737cr
expected vs. `2,267cr in 2QFY2016), a growth of 3.1% yoy, mainly subdued on
back of pressure on the US generic market.
The Formulation business sales (`1,988cr, up 3.2% yoy) mainly lead by the US
(`988.8cr, 1.5% dip yoy), Indian Formulation (`820.9cr, a yoy growth 8.8%),
Emerging market Formulation (`113cr, a yoy dip of 3.2%) and Latin America
formulation (`65.6cr, a yoy growth of 24.6%). The other Business & Alliances
(`398.5cr) grew by 4.0% yoy. Europe Formulation (`55.7cr, a yoy dip of 14.1%),
Consumer Wellness
(`111.9cr, a yoy growth of
7.6%), Animal Healthcare
(`122.5cr, a yoy growth of 51.9%), API (`83.2cr, a yoy dip of 7.4%) and Alliances
(`25.2cr, a yoy dip of 42.5%).
US business de-grew by 1.5% yoy and 17% qoq, mainly attributable to Asacol HD
AG, which was launched in August 2016, partially offset by continued pressure on
HCQS. The company expects seven ANDA approvals in 2HFY2017, which should
help drive the growth. The company launched 4 new products in the US in
2QFY2017 and received 1 product approval, during the quarter. Cumulatively, the
company has received 107 ANDA approvals till date. Additionally, Cadila filed 4
November 7, 2016
2
Cadila Healthcare | 2QFY2017 Result Update
ANDAs in 2QFY2017; cumulatively, the company has filed 279 ANDAs in the US
market.
Latam business was the only bright spot as revenues increased by ~24%yoy to
`65.6cr in 2QFY2017. Growth was aided by 12.5% price hike undertaken in April
2016.
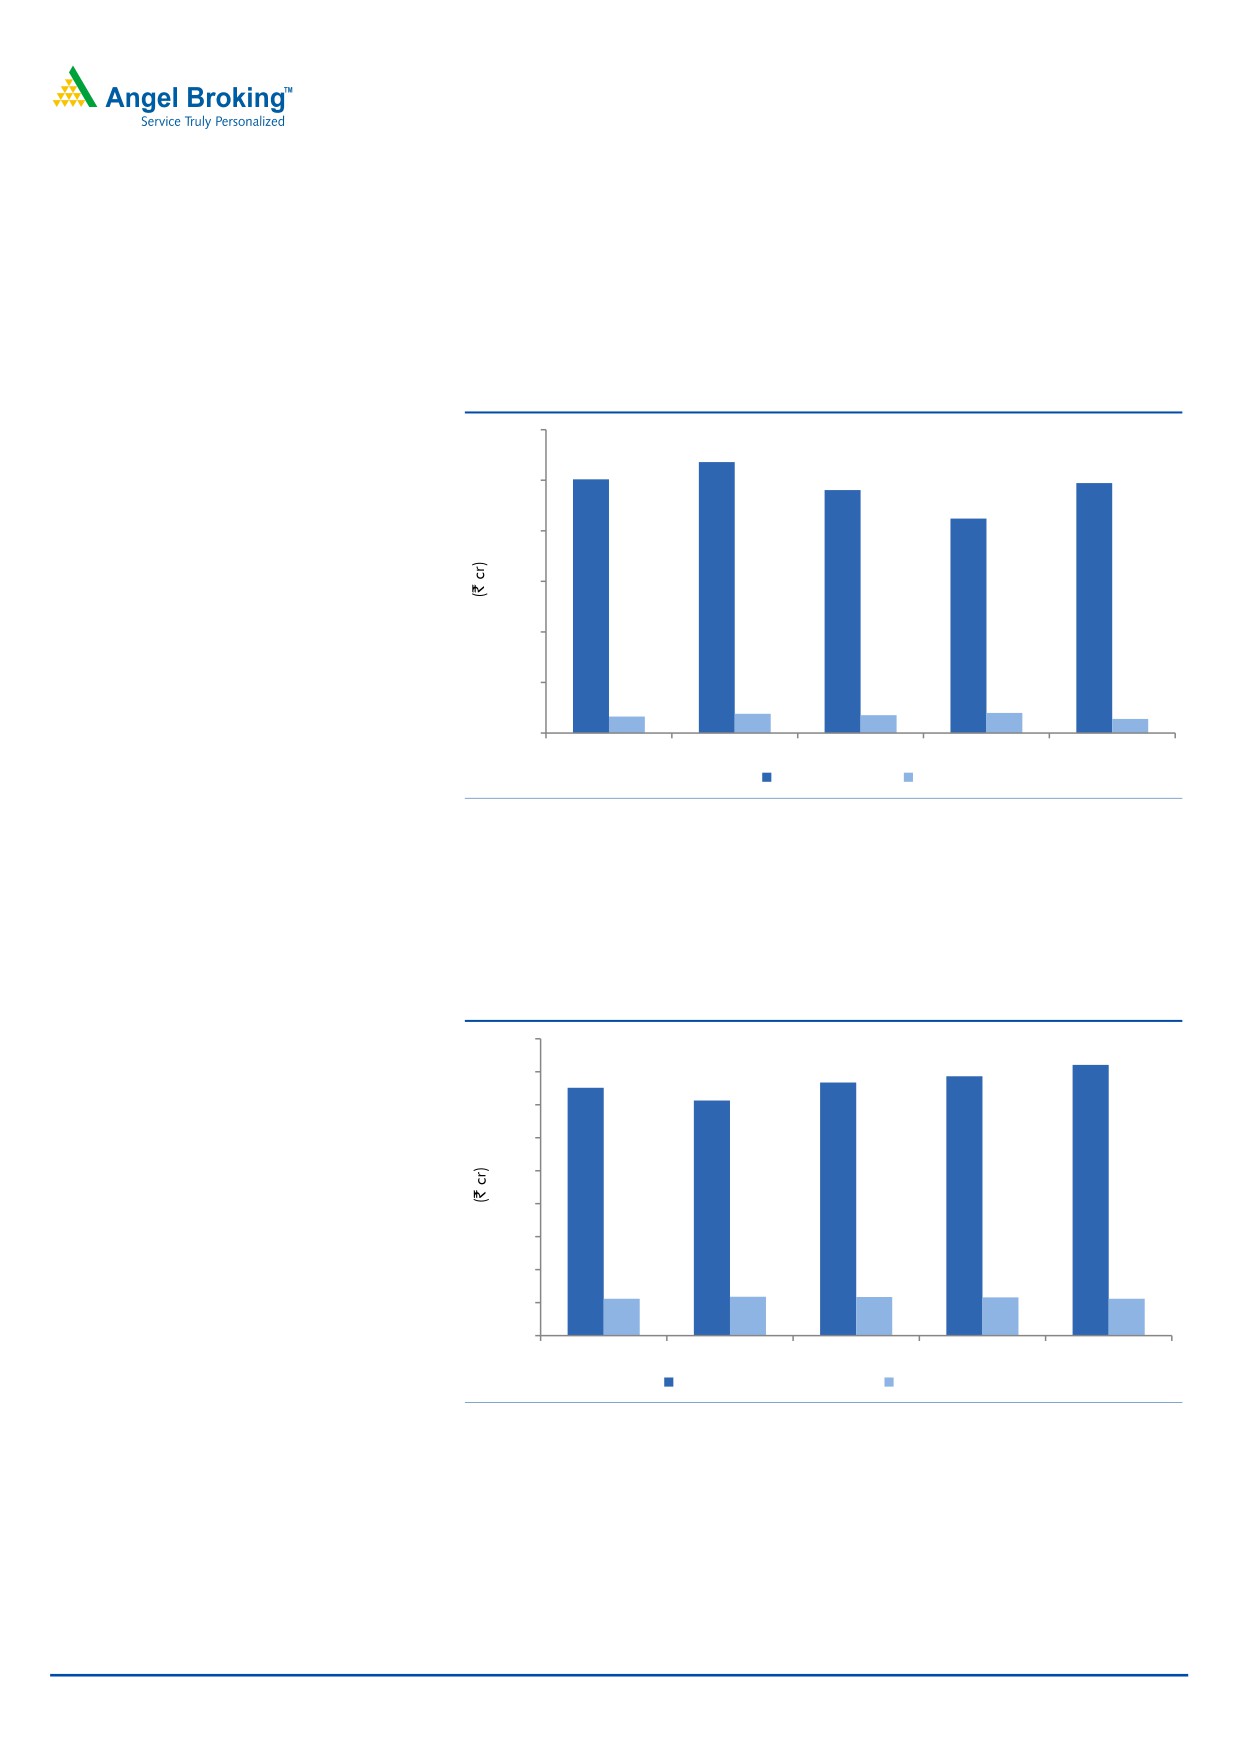
Exhibit 3: Sales trend in the US and Europe
1,200
1,072
1,004
989
961
1,000
848
800
600
400
200
76
70
79
65
56
0
2QFY2016
3QFY2016
4QFY2016
1QFY2017
2QFY2017
US
Europe
Source: Company, Angel Research
The growth in the domestic market (~48% of sales) was of 10.7% yoy, mainly led
by Animal health & Others (`1,225cr) which grew by 51.9%; while formulations
(`820.9cr) grew by 8.8% yoy. API (`83.2cr), on the other hand, de-grew by 7.4%
yoy.
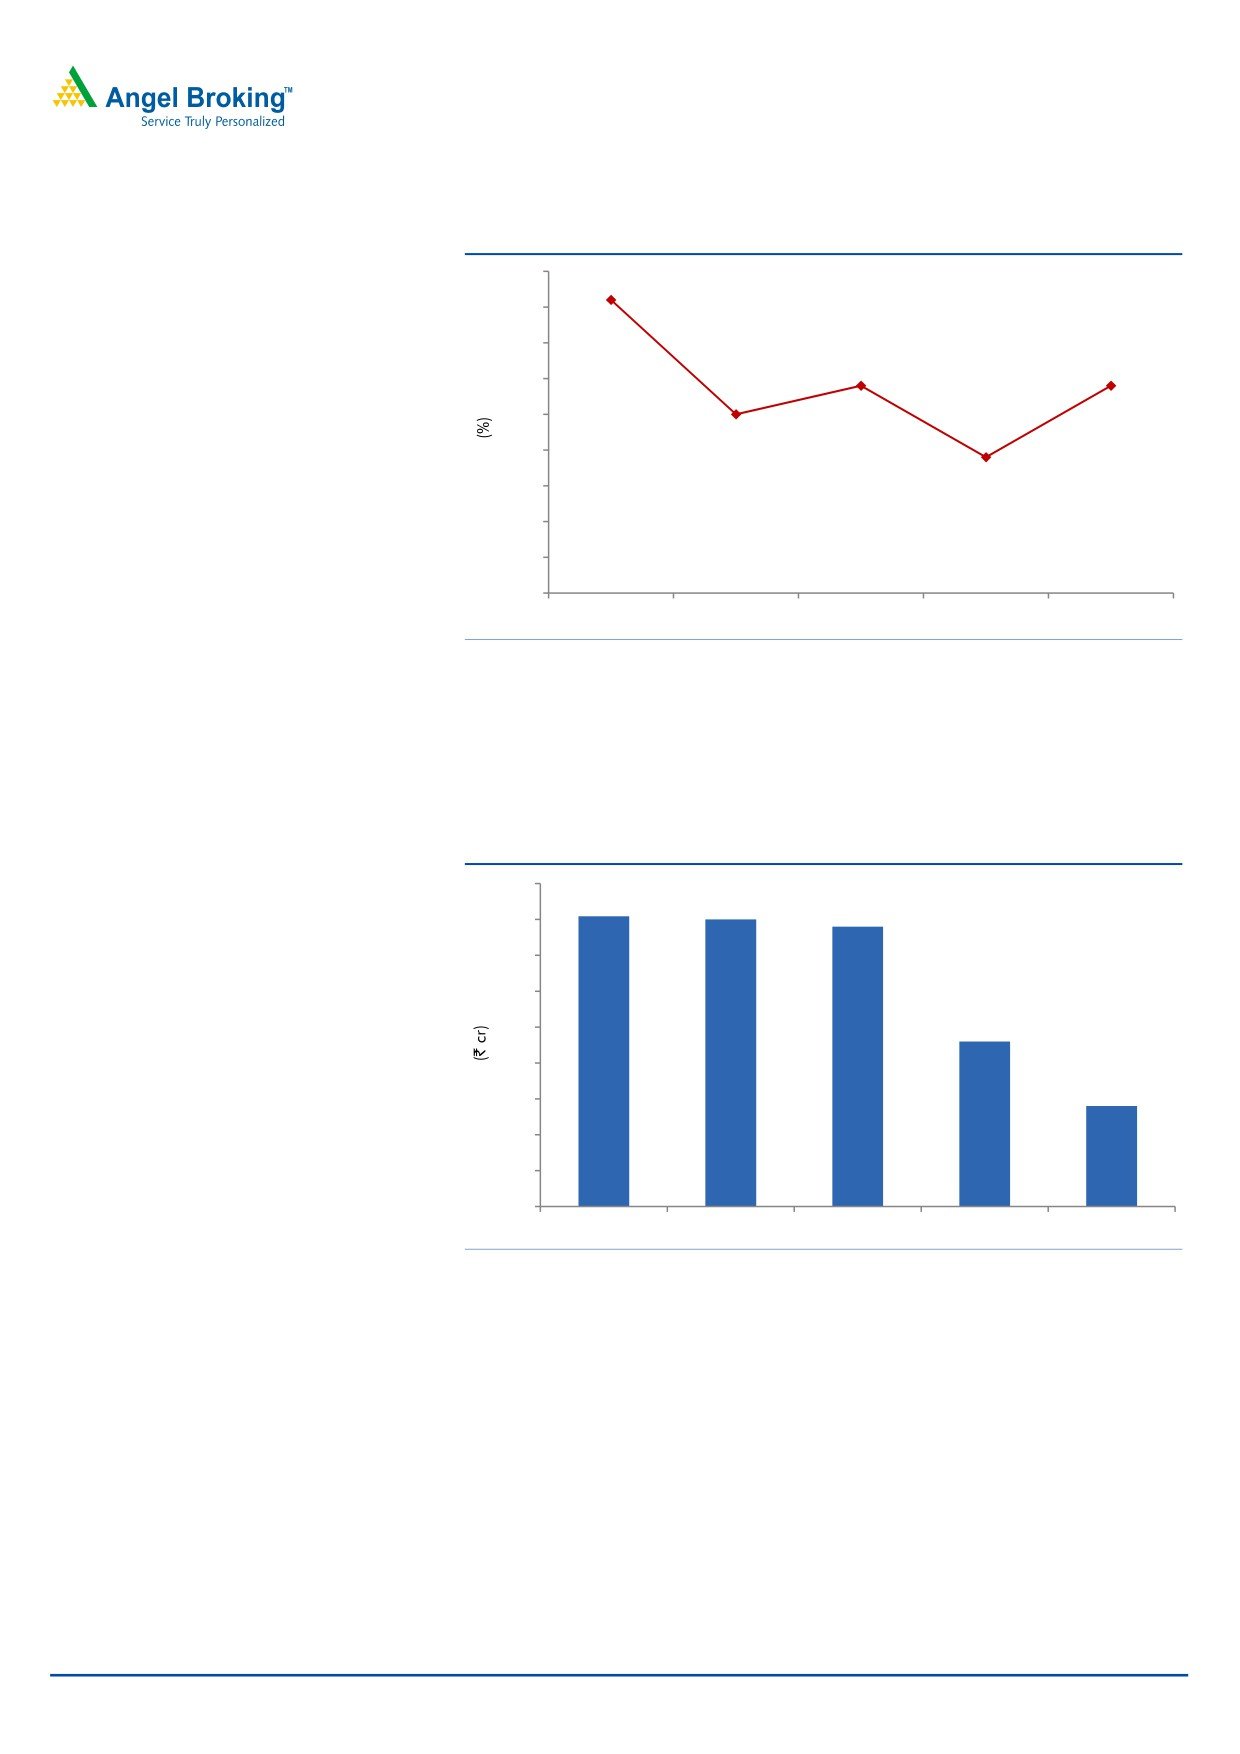
Exhibit 4: Sales trend in Domestic Formulation and Consumer Wellness Divisions
900
821
786
800
751
767
713
700
600
500
400
300
200
112
118
117
116
112
100
0
2QFY2016
3QFY2016
4QFY2016
1QFY2017
2QFY2017
Domestic Formulation
Consumer division
Source: Company, Angel Research
OPM mostly in line with expectation
On the operating front, the EBITDA margin came in at 21.4% (vs. 21.7% expected
vs. 20.3% in 2QFY2016). The dip in the OPM was contained as the GPM
improved from 63.9% (vs. 64.8% in 2QFY2016). R&D expenditure, during the
quarter, came in at 6.5% (vs. 7.3% of sales in 2QFY2016).
November 7, 2016
3
Cadila Healthcare | 2QFY2017 Result Update
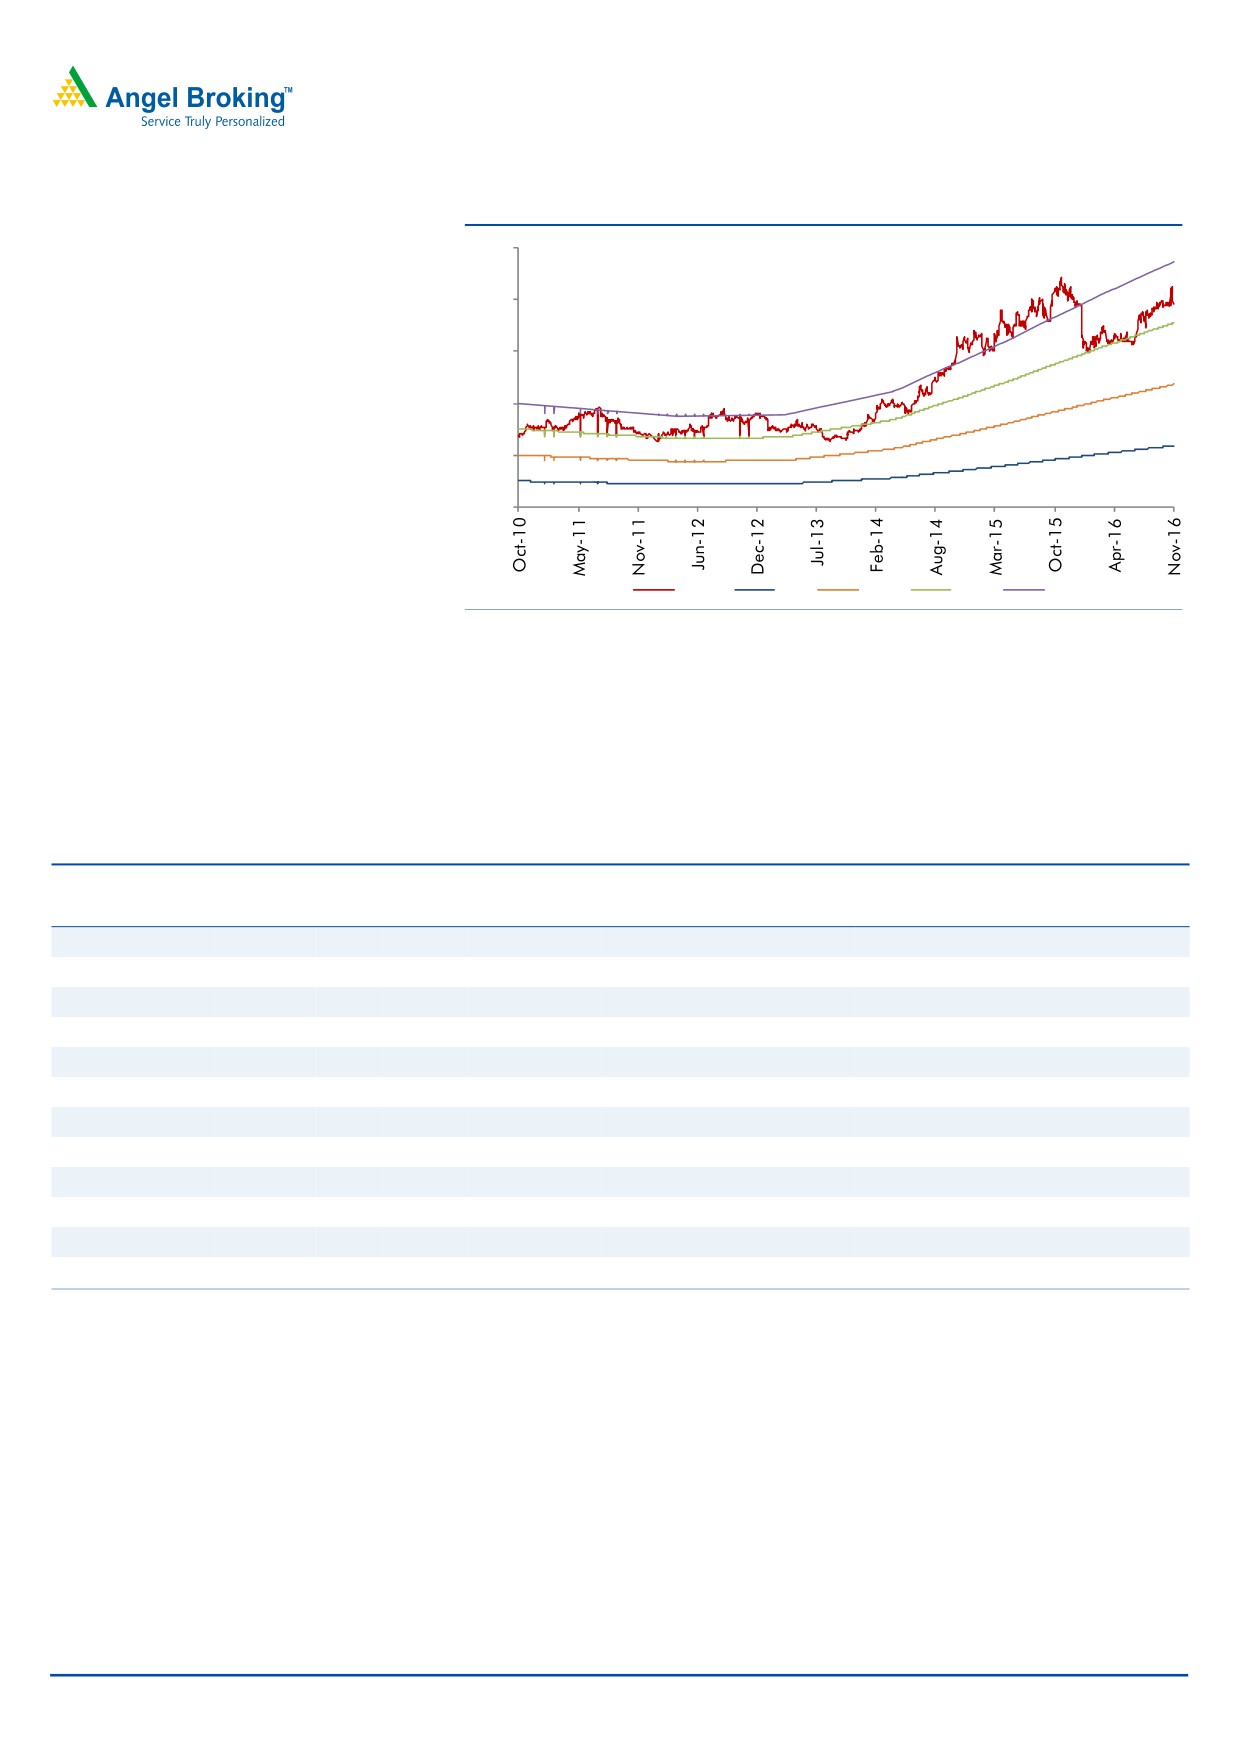
Exhibit 5: OPM trend
23.0
22.5
22.6
22.0
21.5
21.0
21.4
21.4
21.0
20.5
20.0
20.4
19.5
19.0
18.5
2QFY2016
3QFY2016
4QFY2016
1QFY2017
2QFY2017
Source: Company, Angel Research
Net profit down 29.0% yoy: Consequently, the Adj. PAT came in at `338cr (vs.
`460.7cr expected vs. `390.9cr in 2QFY2016), yoy de-growth of 29.0%. Other
reason in the dip in the net profit was the other income which came in at `40.4cr
(vs. `140cr in 2QFY2016), a yoy dip of 71.0%.
Exhibit 6: Adjusted Net profit trend
400
391
390
388
390
380
370
360
356
350
338
340
330
320
310
2QFY2016
3QFY2016
4QFY2016
1QFY2017
2QFY2017
Source: Company, Angel Research
Concall takeaways
Effective tax rate to remain at 22%-25% levels in FY2017E.
Remediation process at Moraiya completed; waiting for
inspection from
USFDA.
R&D as a percentage of sales to be at 7-8% in FY2017.
~30% of domestic portfolio is under DPCO.
Plans to file ~40 ANDAs in US annually.
November 7, 2016
4
Cadila Healthcare | 2QFY2017 Result Update
Recommendation rationale
Strong domestic portfolio: Cadila is the fifth largest player in the domestic market
with sales of about `2,973cr in FY2016; the domestic market contributes ~39% to
its top-line. The company enjoys a leadership position in the CVS, GI, women
healthcare and respiratory segments, and has a sales force of 4,500 executives.
The company, on an aggressive front, launched more than 75 new products in
FY2014. During FY2009-14, the company reported a ~13% CAGR in its top-line
in the domestic formulation business.
Further, the company has a strong consumer division through its stake in Zydus
Wellness, which has premium brands such as Sugarfree, Everyuth and Nutralite,
under its umbrella. This segment which contributes ~4.7% of sales, registered a
growth of 3.2% during FY2016.
Going forward, the company expects the segment to grow at an above-industry
rate on the back of new product launches and field force expansion. In FY2014,
sales were lower; however, FY2016 witnessed a rebound. During FY2016-18E, we
expect the domestic segment to grow at a CAGR of 9.6%.
Exports on a strong footing: Cadila has a two-fold focus on exports, wherein it is
targeting developed as well as emerging markets, which contributed around 61%
to its FY2016 top-line. The company has established a formidable presence in the
developed markets of US, Europe (France and Spain) and Japan. In the US, the
company achieved critical scale of `3,393cr on the sales front in FY2016. The
growth in exports to the US along with other regions like Europe would be driven
by new product launches, going forward. Overall, exports are expected to post a
CAGR of 17.5% over FY2016-18E.
Outlook and valuation
We expect Cadila’s net sales to post 14.1% CAGR to `12,318cr and EPS to report
13.4% CAGR to `19.2 over FY2016-18E. We maintain our Neutral rating on the
stock.
Exhibit 7: Key Assumptions
Key assumptions
FY2017E
FY2018E
Domestic growth (%)
10.0
15.0
Exports growth (%)
10.0
20.0
Growth in employee expenses (%)
14.7
18.1
Operating margins (excl tech. know-how fees) (%)
22.6
22.0
Capex (` cr)
650
650
Source: Company, Angel Research
November 7, 2016
5
Cadila Healthcare | 2QFY2017 Result Update
Exhibit 8: One-year forward PE band
500
400
300
200
100
0
Price
7x
14x
21x
28x
Source: Company
Company background: Cadila Healthcare‘s operations range across API,
formulations, animal health products and cosmeceuticals. The group has global
operations spread across USA, Europe, Japan, Brazil, South Africa and 25 other
emerging markets. Having already achieved the US$1bn sales mark in 2011, the
company aims to be a research-driven pharmaceutical company by 2020.
Exhibit 9: Recommendation Summary
Company
Reco
CMP Tgt. price Upside
FY2018E
FY16-18E
FY2018E
(`)
(`)
% PE (x) EV/Sales (x) EV/EBITDA (x)
CAGR in EPS (%) RoCE (%) RoE (%)
Alembic Pharma
Neutral
656
-
-
21.6
2.9
13.4
(10.8)
27.5
25.3
Aurobindo Pharma Accumulate
727
877
20.7
15.4
2.5
10.7
18.1
22.5
26.1
Cadila Healthcare Neutral
390
-
-
20.4
3.1
14.3
13.4
22.7
25.7
Cipla
Neutral
545
-
-
20.0
2.5
13.8
20.4
13.5
15.2
Dr Reddy's
Neutral
3,077
-
-
21.5
2.8
12.4
1.7
16.2
15.9
Dishman Pharma Neutral
227
-
-
20.1
2.3
9.9
3.1
10.3
10.9
GSK Pharma
Neutral
2,775
-
-
46.7
6.0
42.1
15.9
33.7
30.6
Indoco Remedies Neutral
276
-
-
17.7
2.1
11.3
31.5
19.1
19.2
Ipca labs
Accumulate
583
613
5.1
29.6
2.0
13.4
36.5
8.8
9.4
Lupin
Buy
1,421
1,809
27.3
20.5
3.9
12.6
17.2
24.4
20.9
Sanofi India*
Neutral
4,276
-
-
25.3
3.4
18.2
21.2
24.9
28.4
Sun Pharma
Buy
653
944
44.6
19.9
3.9
12.6
22.0
33.1
18.9
Source: Company, Angel Research; Note: *December year ending
November 7, 2016
6
Cadila Healthcare | 2QFY2017 Result Update
Profit & Loss statement (Consolidated)
Y/E March (` cr)
FY2013
FY2014
FY2015
FY2016
FY2017E
FY2018E
Gross sales
6,285
7,208
8,658
9,660
10,626
12,550
Less: Excise duty
129
148
161
190
197
232
Net sales
6,155
7,060
8,497
9,469
10,429
12,318
Other operating income
203
164
154
368
368
368
Total operating income
6,358
7,224
8,651
9,838
10,797
12,686
% chg
20.8
13.6
19.8
13.7
9.8
17.5
Total expenditure
5,232
6,024
6,896
7,457
8,070
9,602
Net raw materials
2,320
2,714
3,197
3,277
3,650
4,434
Other mfg costs
387
443
534
595
699
774
Personnel
903
1,071
1,209
1,334
1,530
1,807
Other
1,622
1,796
2,107
2,252
2,190
2,587
EBITDA
923
1,036
1,601
2,012
2,360
2,715
% chg
1.4
12.3
54.6
25.6
21.9
15.1
(% of Net Sales)
15.0
14.7
18.8
21.2
22.6
22.0
Dep. & amortisation
183
201
287
302
393
439
EBIT
740
835
1,314
1,710
1,966
2,277
% chg
(1.7)
12.8
57.4
30.1
20.4
15.8
(% of Net Sales)
12.0
11.8
15.5
18.1
18.9
18.5
Interest & other charges
169
90
68
49
84
84
Other income
37
51
55
94
94
94
(% of PBT)
5
5
4
4
4
4
Recurring PBT
811
959
1,456
2,124
2,344
2,655
% chg
2.1
18.3
51.8
45.9
10.4
13.2
Extraordinary exp./(Inc.)
-
17
10
2
-
-
PBT (reported)
811
942
1,445
2,124
2,344
2,655
Tax
119.5
106.0
259.4
571.1
586.1
663.6
(% of PBT)
14.7
11.3
17.9
26.9
25.0
25.0
PAT (reported)
692
836
1,186
1,553
1,758
1,991
Less: Minority int. (MI)
36.4
32.6
35.5
30.0
30.0
30.0
PAT after MI (reported)
655
804
1,151
1,523
1,728
1,961
ADJ. PAT
655
819
1,159
1,524
1,728
1,961
% chg
0.8
25.0
41.5
31.5
13.4
13.5
(% of Net Sales)
10.6
11.4
13.5
16.1
16.6
15.9
Adj.Basic EPS (`)
6.4
8.0
11.3
14.9
16.9
19.2
Adj. Fully Diluted EPS (`)
6.4
8.0
11.3
14.9
16.9
19.2
% chg
0.8
25.0
41.5
31.5
13.4
13.5
November 7, 2016
7
Cadila Healthcare | 2QFY2017 Result Update
Balance Sheet (Consolidated)
Y/E March (` cr)
FY2013
FY2014
FY2015
FY2016
FY2017E
FY2018E
SOURCES OF FUNDS
Equity share capital
102
102
102
102
102
102
Reserves & Surplus
2,938
3,337
4,149
5,250
6,690
8,364
Shareholders funds
3,040
3,439
4,252
5,352
6,793
8,467
Minority interest
119
144
169
135
165
195
Total loans
2,681
2,265
2,334
2,107
2,107
2,107
Other Long Term Liabilities
47
55
43
61
45
46
Long Term Provisions
64
76
110
77
78
79
Deferred tax liability
100
96
59
88
121
122
Total liabilities
6,053
6,075
6,966
7,820
9,186
10,892
APPLICATION OF FUNDS
Gross block
4,104
3,756
4,353
5,296
5,946
6,596
Less: Acc. depreciation
1,358
1,540
1,827
2,130
2,523
2,962
Net block
2,746
2,214
2,526
3,166
3,423
3,634
Capital Work-in-Progress
248
892
892
892
892
892
Goodwill
862
908
733
733
733
733
Investments
21
87
154
266
266
266
Long Term Loans and Adv.
411
495
637
756
663
730
Current assets
3,191
3,391
4,105
4,205
6,033
7,972
Cash
582
549
670
695
2,002
3,271
Loans & advances
279
341
334
335
336
337
Other
2,330
2,501
3,102
3,174
3,695
4,364
Current liabilities
1,426
1,912
2,081
2,196
2,824
3,335
Net Current assets
1,765
1,480
2,024
2,008
3,209
4,637
Mis. Exp. not written off
-
-
-
(1)
-
-
Total assets
6,053
6,075
6,966
7,820
9,186
10,892
November 7, 2016
8
Cadila Healthcare | 2QFY2017 Result Update
Cash Flow Statement (Consolidated)
Y/E March (` cr)
FY2013 FY2014 FY2015 FY2016 FY2017E FY2018E
Profit before tax
811
942
1,445
2,124
2,344
2,655
Depreciation
183
201
287
302
393
439
(Inc)/Dec in Working Cap.
(223)
168
(565)
(78)
141
(28)
Less: Other income
37
51
55
94
94
94
Direct taxes paid
119
106
259
571
586
664
Cash Flow from Operations
614
1,154
853
1,683
2,198
2,308
(Inc.)/Dec.in Fixed Assets
(860)
(296)
(597)
(943)
(650)
(650)
(Inc.)/Dec. in Investments
3
(65)
(68)
(112)
-
-
Other income
37
51
55
94
94
94
Cash Flow from Investing
(820)
(310)
(609)
(960)
(556)
(556)
Issue of Equity
-
-
-
-
-
-
Inc./(Dec.) in loans
382
(397)
91
(242)
(16)
2
Dividend Paid (Incl. Tax)
(175)
(216)
(287)
(287)
(287)
(287)
Others
115
(264)
74
(168)
(33)
(198)
Cash Flow from Financing
322
(877)
(122)
(697)
(335)
(483)
Inc./(Dec.) in Cash
116
(33)
121
25
1,307
1,269
Opening Cash balances
467
582
549
670
695
2,002
Closing Cash balances
582
549
670
695
2,002
3,271
November 7, 2016
9
Cadila Healthcare | 2QFY2017 Result Update
Key Ratios
Y/E March
FY2013
FY2014
FY2015
FY2016
FY2017E
FY2018E
Valuation Ratio (x)
P/E (on FDEPS)
61.0
48.8
34.5
26.2
23.1
20.4
P/CEPS
47.6
39.1
27.6
21.8
18.8
16.6
P/BV
13.1
11.6
9.4
7.5
5.9
4.7
Dividend yield (%)
1.9
1.9
1.9
1.9
1.9
1.9
EV/Sales
6.8
5.8
4.9
4.4
3.8
3.1
EV/EBITDA
45.8
39.8
25.6
20.2
16.7
14.0
EV / Total Assets
6.9
6.8
5.9
5.2
4.3
3.5
Per Share Data (`)
EPS (Basic)
6.4
8.0
11.3
14.9
16.9
19.2
EPS (fully diluted)
6.4
8.0
11.3
14.9
16.9
19.2
Cash EPS
8.2
10.0
14.2
17.9
20.8
23.5
DPS
7.5
7.5
7.5
7.5
7.5
7.5
Book Value
29.7
33.6
41.5
52.3
66.4
82.7
Dupont Analysis
EBIT margin
12.0
11.8
15.5
18.1
18.9
18.5
Tax retention ratio
85.3
88.7
82.1
73.1
75.0
75.0
Asset turnover (x)
1.2
1.3
1.5
1.5
1.5
1.7
ROIC (Post-tax)
12.8
13.8
18.6
19.4
21.3
23.8
Cost of Debt (Post Tax)
5.8
3.2
2.4
1.6
3.0
3.0
Leverage (x)
0.7
0.6
0.4
0.3
0.1
0.0
Operating ROE
17.7
20.1
25.8
25.2
23.9
23.8
Returns (%)
ROCE (Pre-tax)
13.2
13.8
20.2
23.1
23.1
22.7
Angel ROIC (Pre-tax)
19.5
20.6
31.3
33.6
35.6
39.4
ROE
23.3
25.3
30.1
31.7
28.5
25.7
Turnover ratios (x)
Asset Turnover (Gross Block)
1.8
1.8
2.1
2.0
2.0
2.0
Inventory / Sales (days)
66
69
61
56
73
83
Receivables (days)
54
57
57
45
59
67
Payables (days)
42
55
46
45
57
53
WC (ex-cash) (days)
66
53
48
49
43
37
Solvency ratios (x)
Net debt to equity
0.7
0.5
0.4
0.3
0.0
(0.1)
Net debt to EBITDA
2.3
1.7
1.0
0.7
0.0
(0.4)
Interest Coverage (EBIT / Int.)
4.4
9.3
19.4
35.2
24.4
27.0
November 7, 2016
10
Cadila Healthcare | 2QFY2017 Result Update
Research Team Tel: 022 - 39357800
DISCLAIMER
Angel Broking Private Limited (hereinafter referred to as “Angel”) is a registered Member of National Stock Exchange of India Limited,
Bombay Stock Exchange Limited and Metropolitan Stock Exchange Limited. It is also registered as a Depository Participant with CDSL
and Portfolio Manager with SEBI. It also has registration with AMFI as a Mutual Fund Distributor. Angel Broking Private Limited is a
registered entity with SEBI for Research Analyst in terms of SEBI (Research Analyst) Regulations, 2014 vide registration number
INH000000164. Angel or its associates has not been debarred/ suspended by SEBI or any other regulatory authority for accessing
/dealing in securities Market. Angel or its associates/analyst has not received any compensation / managed or co-managed public
offering of securities of the company covered by Analyst during the past twelve months.
This document is solely for the personal information of the recipient, and must not be singularly used as the basis of any investment
decision. Nothing in this document should be construed as investment or financial advice. Each recipient of this document should
make such investigations as they deem necessary to arrive at an independent evaluation of an investment in the securities of the
companies referred to in this document (including the merits and risks involved), and should consult their own advisors to determine
the merits and risks of such an investment.
Reports based on technical and derivative analysis center on studying charts of a stock's price movement, outstanding positions and
trading volume, as opposed to focusing on a company's fundamentals and, as such, may not match with a report on a company's
fundamentals. Investors are advised to refer the Fundamental and Technical Research Reports available on our website to evaluate the
contrary view, if any.
The information in this document has been printed on the basis of publicly available information, internal data and other reliable
sources believed to be true, but we do not represent that it is accurate or complete and it should not be relied on as such, as this
document is for general guidance only. Angel Broking Pvt. Limited or any of its affiliates/ group companies shall not be in any way
responsible for any loss or damage that may arise to any person from any inadvertent error in the information contained in this report.
Angel Broking Pvt. Limited has not independently verified all the information contained within this document. Accordingly, we cannot
testify, nor make any representation or warranty, express or implied, to the accuracy, contents or data contained within this document.
While Angel Broking Pvt. Limited endeavors to update on a reasonable basis the information discussed in this material, there may be
regulatory, compliance, or other reasons that prevent us from doing so.
This document is being supplied to you solely for your information, and its contents, information or data may not be reproduced,
redistributed or passed on, directly or indirectly.
Neither Angel Broking Pvt. Limited, nor its directors, employees or affiliates shall be liable for any loss or damage that may arise from
or in connection with the use of this information.
Disclosure of Interest Statement
Cadila Healthcare
1. Financial interest of research analyst or Angel or his Associate or his relative
No
2. Ownership of 1% or more of the stock by research analyst or Angel or associates or relatives
No
3. Served as an officer, director or employee of the company covered under Research
No
4. Broking relationship with company covered under Research
No
Ratings (Based on expected returns
Buy (> 15%)
Accumulate (5% to 15%)
Neutral (-5 to 5%)
over 12 months investment period):
Reduce (-5% to -15%)
Sell (< -15)
November 7, 2016
11