
1
Please refer to important disclosures at the end of this report
1
1
Computer Age Management Services Ltd (CAMS) is India’s largest registrar and
transfer agent (RTA) of mutual funds with an aggregate market share of
approximately 70% based on mutual fund average assets under management
(AAUM) managed by its clients and fastest growing RTA for last 5 years. CAMS is
responsible for entire back end work of its mutual fund clients i.e. from account
creation to processing to redemption and also provides statutory statements,
transaction origination, operations, investor & distributor services, risk
management services and compliance services. For all the above service, CAMS
charges fees of 0.036% (FY20) on AUM managed by its clients. All 41 mutual
funds outsource back end/operational work to RTA.
Huge growth potential in Mutual Fund AUM to support CAMS’ revenue: Over the
past five years (FY15-20), equity AUM for the Indian MF industry has increased
2.7x from `3.24 lakh cr to `9 lakh cr. Further, overall AUM has nearly jumped
2.4x from `11.48 lakh cr to `27.14 lakh cr over the same period. There is a huge
growth potential for MF industry as the penetration of mutual funds is low in India
with an AUM/GDP ratio of 12% as of Dec 2019 vs. that of developed countries at
>50%. Lower attraction in real estate by investors due to subdued returns coupled
with lower inflation will direct investors from physical assets to financial savings,
resulting in MF AUM to grow at a healthy rate. Given that CAMS’ 87% revenue is
linked to AUM growth, MF industry growth is positive for CAMS.
Leadership position in MF RTA business and foray in new growing business:
CAMS is the largest RTA of mutual funds with an aggregate market share of 70%.
Its mutual fund clients include four of the five largest mutual funds as well as nine
of the 15 largest mutual funds based on AAUM during July 2020. Most of the
bank-led top mutual funds are CAMS’ clients. Leveraging on current domain
expertise, processes, and infrastructure, CAMS has also started to cater to AIFs,
insurance companies, banks and NBFCs.
Healthy financials to support higher dividend payout: Revenue has grown at a
steady CAGR of 13% over FY15-20.Its leadership position has helped to report a
healthy EBIDTA margin of 41% for FY20. Return on equity (ROE) for FY20 was
34% and the last 3 years average ROE was 31.3%. For FY20, CAMS has
registered dividend payout of 41%. Considering the ability to generate strong
cash flow from operations, we expect the company would continue to pay a
generous dividend to shareholders.
Outlook & Valuation: At the upper end of the IPO price band, it is offered at
34.6x its FY20 EPS and 11x its FY20 book value, demanding `6,000cr market
cap, which we believe is reasonable. Given CAMS’ leadership position, huge
growth potential of MF industry, strong return ratios, asset-light business and
higher dividend payout ratio, we are positive on this IPO and rate it as
SUBSCRIBE.
Key Financials
Y/E March (` cr)
FY2018
FY2019
FY2020
1FY21
Net Sales
642
694
700
149
% chg
8
1
-
Net Profit
146
131
173
41
% chg
(11)
33
-
EBITDA (%)
40
35
41
35
EPS (`)
30
27
36
-
P/E (x)
41
46
35
-
ROE (%)
32
29
32
-
Note - Valuation done on pre IPO financials
SUBSCRIBE
Issue Open: Sep 21, 2020
Issue Close: Sep 23, 2020
QIBs 50% of issue
Non-Institutional 15% of issue
Retail 35% of issue
Promoters 44%
Others 57%
Fresh issue: -
Issu e Details
Face Value: `10
Present Eq. Paid up Capital: `48.8cr
Offer for Sale: **1.82cr Shares
Post Issu e Sh areh oldin g Pattern
Post Eq. Paid up Capital: `48.8cr
Issue size (amount): *`2,240cr -
**2,242 cr
Price Band: `1,229-1,230
Lot Size: 12 shares and in multiples
thereafter.
Post-issue implied mkt. cap: *`5,996cr
- **`6,001cr
Promoters holding Pre-Issue: 43.50%
Promoters holding Post-Issue: 43.50%
*Calculated on lower price band
** Calculated on upper price band
Book Building
Jaikishan J Parmar
Research Analyst
+022 39357600, Extn: 6810
Jaikishan.parmar@angelbroking.com
Computer Age Management Services Limited
IPO Note | Financials
Sep 19, 2020
2
Computer Age Management Services Limited I PO Note
Sep 19,2020
2
Company Background
Promoted by Great Terrain Investment Ltd (Affiliate of Warburg Pincus), Computer
Age Management Services Limited (CAMS) was incorporated on May 25, 1988.
CAMS is a technology-driven financial infrastructure and services provider to
mutual funds and other financial institutions with over 2 decades of experience.
CAMS is India’s largest registrar and transfer agent of mutual funds with an
aggregate market share of 70% based on mutual fund average assets under
management (AAUM) managed by its clients and serviced by them during
November 2019.
Its mutual fund clients include 4 of the 5 largest mutual funds as well as 9 of the
15 largest mutual funds based on AAUM during July 2020.
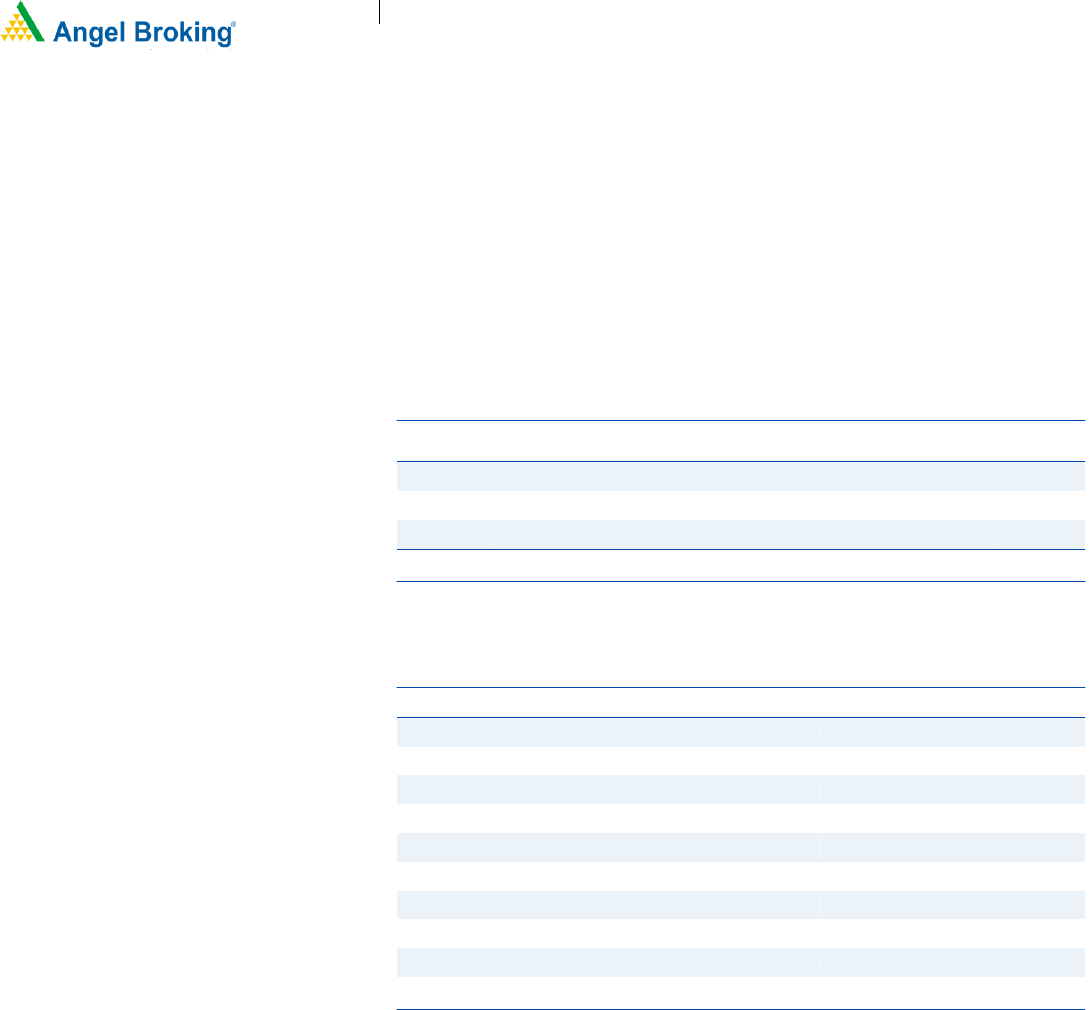
Exhibit 1: Key Performance Indicators
Particular
FY16
FY17
FY18
FY19
FY20
Q1FY21
Total AAUM of the mutual funds serviced (` in Cr)
793.15
1,029.36
1,375.85
1,584.12
1814.97
1743.33
Equity Oriented (` in Cr)
232.74
292.11
488.48
623.25
670.67
575.07
Number of transactions handled (in Cr)
11.52
15.18
25
31.29
32.84
7.59
Number of live folios (in Cr)
1.93
2.3
3.18
3.71
3.94
3.98
Number of total investor folios (in Cr)
4
4.4
5.48
6.36
7.09
7.18
Number of PAN accounts handled (in Cr)
0.72
0.87
1.24
1.48
1.59
1.6
Number of SIP transactions processed (in Cr)
6.32
8.39
13.22
19.17
23.75
5.85
Source: RHP
Key Management Personnel:
Anuj Kumar is the whole time Director and CEO of the company. He was
previously associated with Godrej & Boyce Mfg. Co. Ltd., Blow Plast Limited,
Escorts Finance Ltd, BillJunction Payments Ltd, IBM India Pvt. Ltd. and Concentrix
Daksh Services India Pvt. Ltd. He joined the company in March, 2016.
Somasundaram M. is the Chief Financial Officer of the company. He joined the
company on July 6, 2009.
Srikanth Tanikella is the Chief Operations Officer of the company. He joined the
company on December 18, 2014.
3
Computer Age Management Services Limited I PO Note
Sep 19,2020
3
Issue details
This IPO is purely on offer for sale and the issue is worth `2,242cr. Of this issue
worth `22cr, 1,82,500 shares are reserved for employees of CAMS.
NSE Investment, an arm of NSE, will be the only selling shareholder under the
IPO. Notably, the markets regulator in February had directed NSE to divest its
entire 37.5% stake in CAMS within a year.
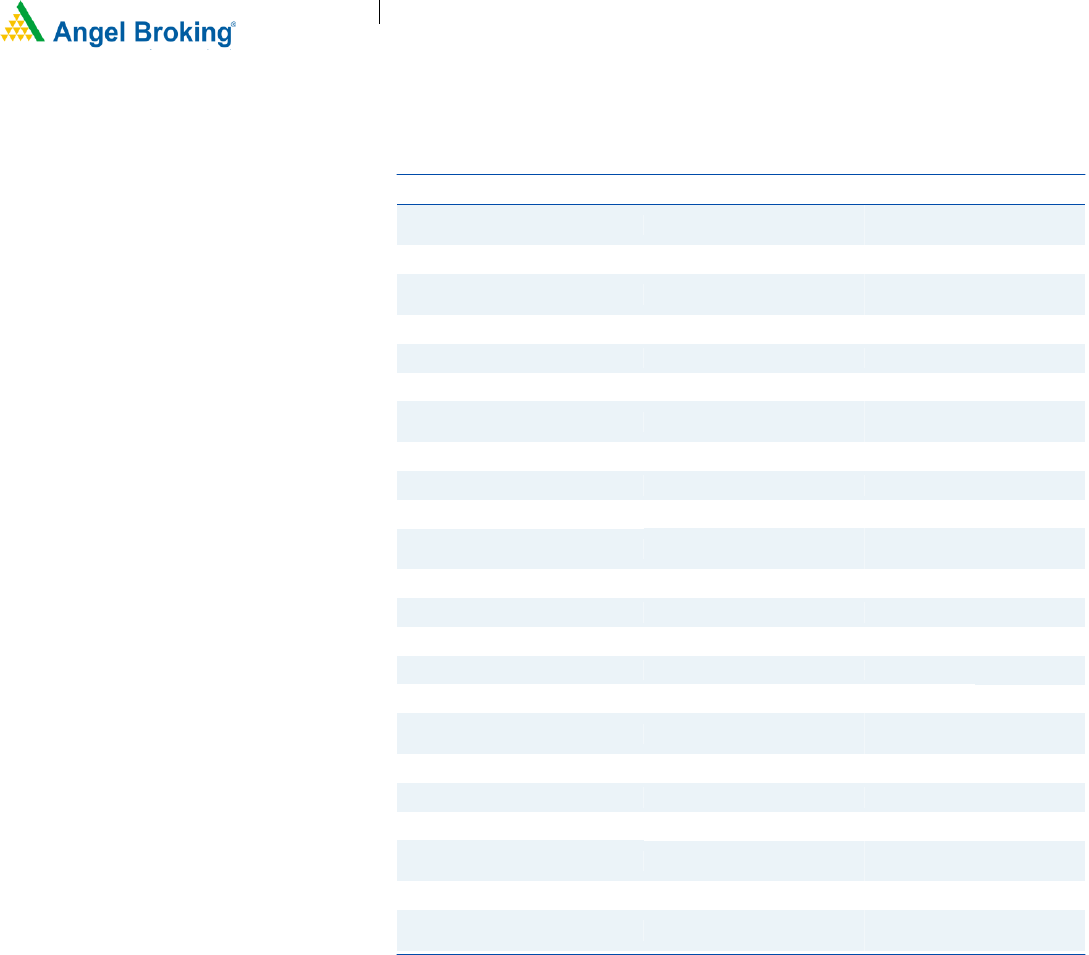
Exhibit 2: Pre and Post-IPO shareholding pattern
Particular
No of shares
(Pre-issue)
%
No of shares
(Post-issue)
%
Promoter
2,12,24,000
44
2,12,24,000
44
Institution
2,75,62,800
56
93,16,200
19
Public (OFS)
1,82,46,600
37
Total
4,87,86,800
100
4,87,86,800
100
Source: RHP Note,: Calculated on upper price band
Exhibit 3: Pre-Offer Equity Share capital
Share Holder
No Of share
% Stake
Great Terrain
2,12,24,000
43.5
NSE Investments
1,82,85,000
37.5
HDFC
29,20,724
6.0
HDFC Bank
16,23,708
3.3
HDB Trust
15,55,444
3.2
Faering Capital India Evolving Fund II
12,41,430
2.5
Acsys
9,44,724
1.9
Faering Capital India Evolving Fund III
7,08,970
1.5
Other
2,82,800
0.6
Total
4,87,86,800
100
Source:RHP
Objects of the offer
The markets regulator in February had directed NSE to divest its entire 37.5%
stake in CAMS within a year.
To achieve the benefits of listing the Equity Shares on the Exchanges and to
carry out offer for sale of equity shares
Risk
87% of the revenue comes from Mutual fund industry, hence, degrowth in
AUM and decline in yield would impact the company’s financials.
Significant disruptions in CAMS’ information technology systems or breach of
data security could adversely affect business and reputation.
4
Computer Age Management Services Limited I PO Note
Sep 19,2020
4
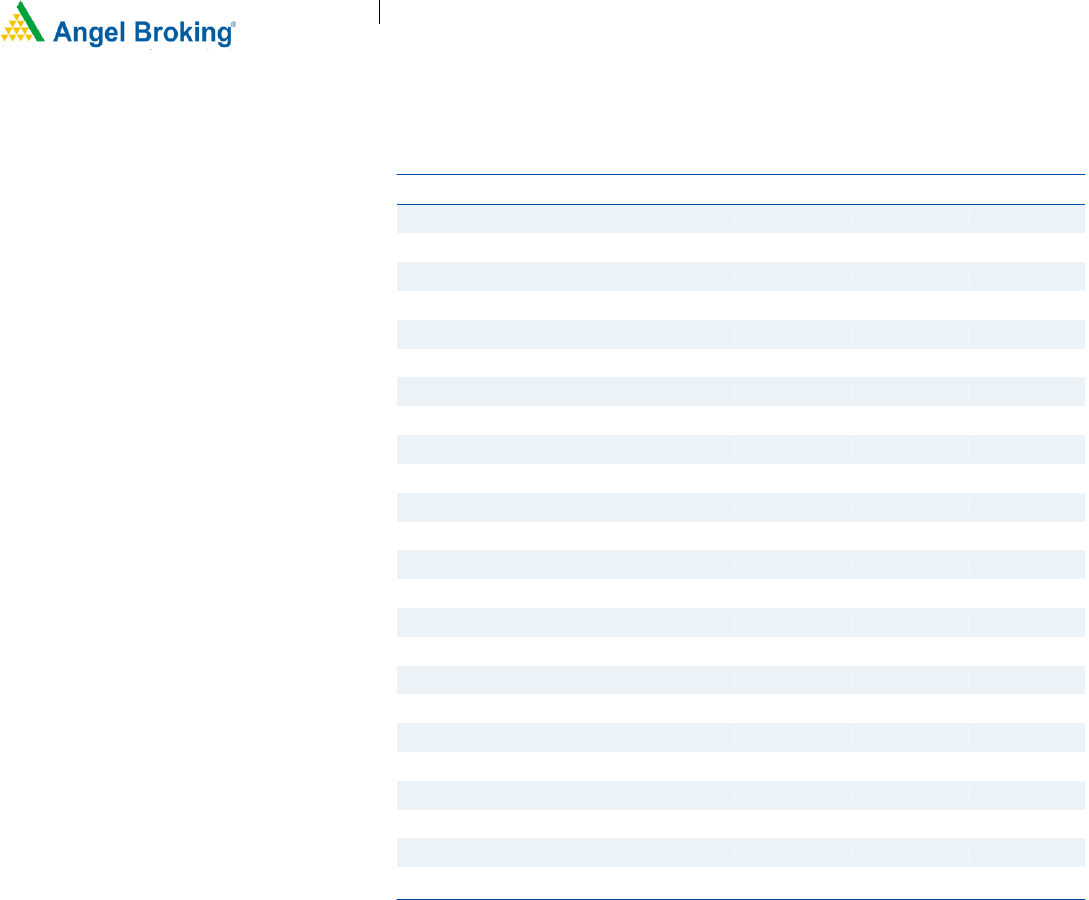
Income Statement
Y/E March (` cr)
FY2018
FY2019
FY2020
Q1FY21
Net Sales
642
694
700
149
% chg
8.1
0.9
Total Expenditure
383
450
412
97
Personnel
226
275
258
65
Operating Exp
94
106
87
17
Others Expenses
63
70
68
16
EBITDA
258
244
287
51
% chg
(5.7)
17.9
(% of Net Sales)
40.3
35.1
41.1
34.6
Depreciation& Amortisation
40
50
49
11
EBIT
218
193
239
41
% chg
(11.5)
23.6
(% of Net Sales)
34.0
27.9
34.1
Interest & other Charges
8
10
10
2
Other Income
16
18
22
15
(% of PBT)
7.2
9.0
8.7
Recurring PBT
227
201
251
53
% chg
(11.3)
24.8
Tax
80
70
77
12
(% of PBT)
35.4
34.8
30.8
23.4
PAT (reported)
146
131
173
41
(% of Net Sales)
22.8
18.9
24.8
27.5
Basic EPS (`)
30.0
26.8
35.6
8.2

5
Computer Age Management Services Limited I PO Note
Sep 19,2020
5
Balance Sheet
Y/E March (` cr)
FY2018
FY2019
FY2020
Q1FY21
SOURCES OF FUNDS
Equity Share Capital
49
49
49
48.8
Reserves& Surplus
402
401
491
479
Shareholders Funds
451
449
540
528
Financial Laibility
87
84
77
65
Provision
57
71
74
75
Total Liabilities
595
605
691
668
APPLICATION OF FUNDS
Net Block
177
168
154
136
Intangible assets
147
152
145
142
Investments
228
242
318
329
Current Assets
123
150
177
218
Inventories
-
-
-
-
Sundry Debtors
23
27
32
44
Cash
28
44
51
84
Loans & Advances
0.5
0.7
0.6
0.8
Other Assets
72
79
94
90
Current liabilities
103
132
112
168
Net Current Assets
20
18
65
50
Deferred Tax Asset
6
2
0
1
Other Asset
17
22
9
10
Total Assets
594
605
691
668
Cashflow Statement
Y/E March (`s cr)
FY2018
FY2019
FY2020
Q1FY21
Profit before tax
227
201
251
53
Depreciation
40
50
49
11
Change in Working Capital
(5)
19
(10)
(6)
Interest / Dividend (Net)
Direct taxes paid
(89)
(76)
(83)
(11)
Others
(11)
(8)
(5)
(9)
Cash Flow from Operations
162
187
201
39
(Inc.)/ Dec. in Fixed Assets
(43)
(35)
(15)
(1)
(Inc.)/ Dec. in Investments
24
4
(69)
3
Cash Flow from Investing
(19)
(31)
(84)
1
Issue of Equity
0
0
0
2
Inc./(Dec.) in loans
(14)
(16)
(18)
(5)
Dividend Paid (Incl. Tax)
(116)
(132)
(72)
(54)
Interest / Dividend (Net)
(8)
(10)
(9)
(2)
Cash Flow from Financing
(138)
(158)
(99)
(60)
Inc./(Dec.) in Cash
5
(3)
18
(20)
Opening Cash balances
3
7
5
23
Closing Cash balances
7
5
23
3
Source: Company
6
Computer Age Management Services Limited I PO Note
Sep 19,2020
6
Key Ratio
Y/E March
FY2018
FY2019
FY2020
Valuation Ratio (x)
P/E (on FDEPS)
41.0
45.8
34.6
P/CEPS
31.9
32.8
26.8
P/BV
13.3
13.4
11.1
Dividend yield (%)
1.9
2.2
1.2
EV/Sales
9.1
8.4
8.2
EV/EBITDA
22.6
23.8
19.9
EV / Total Assets
9.8
9.6
8.3
Per Share Data (`)
EPS (Basic)
30.0
26.8
35.6
EPS (fully diluted)
30.0
26.8
35.6
Cash EPS
38.2
37.2
45.5
DPS
23.9
27.1
14.7
Book Value
92.5
92.1
110.6
Returns (%)
ROCE
40.6
36.2
38.7
Angel ROIC (Pre-tax)
77.4
78.0
96.1
ROE
32.4
29.1
32.2
Turnover ratios (x)
Asset Turnover (Gross Block)
2.0
2.2
2.3
Inventory / Sales (days)
-
-
-
Receivables (days)
4
4
5
Payables (days)
19
18
19
Working capital cycle (ex-cash) (days)
(16)
(15)
(14)
Valuation done on upper price band

7
Computer Age Management Services Limited I PO Note
Sep 19,2020
7
Research Team Tel: 022 - 39357800 E-mail: [email protected] Website: www.angelbroking.com
Angel Broking Limited (hereinafter referred to as “Angel”) is a registered Member of National Stock Exchange of India Limited, Bombay
Stock Exchange Limited, Metropolitan Stock Exchange Limited, Multi Commodity Exchange of India Ltd and National Commodity &
Derivatives Exchange Ltd It is also registered as a Depository Participant with CDSL and Portfolio Manager and Investment Adviser with
SEBI. It also has registration with AMFI as a Mutual Fund Distributor. Angel Broking Limited is a registered entity with SEBI for Research
Analyst in terms of SEBI (Research Analyst) Regulations, 2014 vide registration number INH000000164. Angel or its associates has not
been debarred/ suspended by SEBI or any other regulatory authority for accessing /dealing in securities Market. Angel or its
associates/analyst has not received any compensation / managed or co-managed public offering of securities of the company covered
by Analyst during the past twelve months.
This document is solely for the personal information of the recipient, and must not be singularly used as the basis of any investment
decision. Nothing in this document should be construed as investment or financial advice. Each recipient of this document should
make such investigations as they deem necessary to arrive at an independent evaluation of an investment in the securities of the
companies referred to in this document (including the merits and risks involved), and should consult their own advisors to determine
the merits and risks of such an investment.
Reports based on technical and derivative analysis center on studying charts of a stock's price movement, outstanding positions and
trading volume, as opposed to focusing on a company's fundamentals and, as such, may not match with a report on a company's
fundamentals. Investors are advised to refer the Fundamental and Technical Research Reports available on our website to evaluate the
contrary view, if any
The information in this document has been printed on the basis of publicly available information, internal data and other reliable
sources believed to be true, but we do not represent that it is accurate or complete and it should not be relied on as such, as this
document is for general guidance only. Angel Broking Limited or any of its affiliates/ group companies shall not be in any way
responsible for any loss or damage that may arise to any person from any inadvertent error in the information contained in this report.
Angel Broking Limited has not independently verified all the information contained within this document. Accordingly, we cannot testify,
nor make any representation or warranty, express or implied, to the accuracy, contents or data contained within this document. While
Angel Broking Limited endeavors to update on a reasonable basis the information discussed in this material, there may be regulatory,
compliance, or other reasons that prevent us from doing so.
This document is being supplied to you solely for your information, and its contents, information or data may not be reproduced,
redistributed or passed on, directly or indirectly.
Neither Angel Broking Limited, nor its directors, employees or affiliates shall be liable for any loss or damage that may arise from or in
connection with the use of this information.
