Initiating Coverage | Hotels
September 9, 2015
The Byke Hospitality
BUY
CMP
`153
Appealing business model in a growing industry segment
Target Price
`181
The Byke Hospitality Ltd (Byke) is an India based hospitality services company. The company
Investment Period
12 Months
operates under two business segments - 1) managing hotels and 2) room chartering.
Investment Arguments
Stock Info
Asset light business model: Byke has 11 properties as of now, of which, 9 properties
Sector
Hotels
are on a long term lease of over 10-15 years. In the last 5 to 6 years, the company
Market Cap (` cr)
613
has increased its number of rooms from 102 to 697 (as in 1QFY2016). Going
forward, the company has strong expansion plans through the lease model, which will
Net Debt (` cr)
10
enable it to grow at a faster pace with minimal capex requirement.
Beta
0.9
Expansion on the cards: Currently, the company operates 697 rooms, including both
52 Week High / Low
180 / 147
owned and leased, across 11 properties. The company is now planning to add 8 more
Avg. Daily Volume
1,15,983
properties, which would lead to an addition of ~450-500 rooms over the next two
Face Value (`)
10
years. Such expansion would be based on the lease model (for 10-20 years), thus not
BSE Sensex
25,318
requiring any significant capex. The company plans to increase the number of
properties from 11 to 50 within 5 years, following the asset light expansion plan.
Nifty
7,688
Reuters Code
TBKH.BO
Presence in vegetarian budget hotels (mid-size) segment: Byke has presence in the
vegetarian budget hotel segment at popular leisure destinations such as Goa,
Bloomberg Code
BYKE@IN
Matheran, Jaipur, Manali, Shimla, Puri and Mumbai while it has plans to expand
across other destinations like Kerala, Lonavala, Chandigarh, Mahabaleshwar etc. In our
view, the vegetarian budget hotels at leisure destinations in domestic market is a huge
Shareholding Pattern (%)
opportunity. Also in absence of track records, non-branded (single hotel players) hotels face
Promoters
44.0
issues in running their businesses. Byke, a branded vegetarian budget hotel follows a
MF / Banks / Indian Fls
10.2
differentiated market penetration strategy. It leases hotels and address the challenges on back
FII / NRIs / OCBs
0.3
of their management experience; strong track record, marketing and distribution network,
which further leads to higher occupancy, thereby maximizing the company’s profitability.
Indian Public / Others
45.6
Strong growth in chartering business to drive overall revenue: Under the room
chartering business Byke books third-party hotel rooms, mainly during peak seasons,
Abs. (%)
3m 1yr
3yr
at strategically identified cultural and religious destinations on bulk basis and lets them
Sensex
(4.5)
42.4
42.6
out to tourists. In the chartering segment, the company has a strong track record, with its
Byke
(2.2)
(4.8)
84.6
revenue having grown by 3.5x (`90cr in FY2015) in the last three years. Going forward
we expect strong growth momentum in this segment due to the huge industry size.
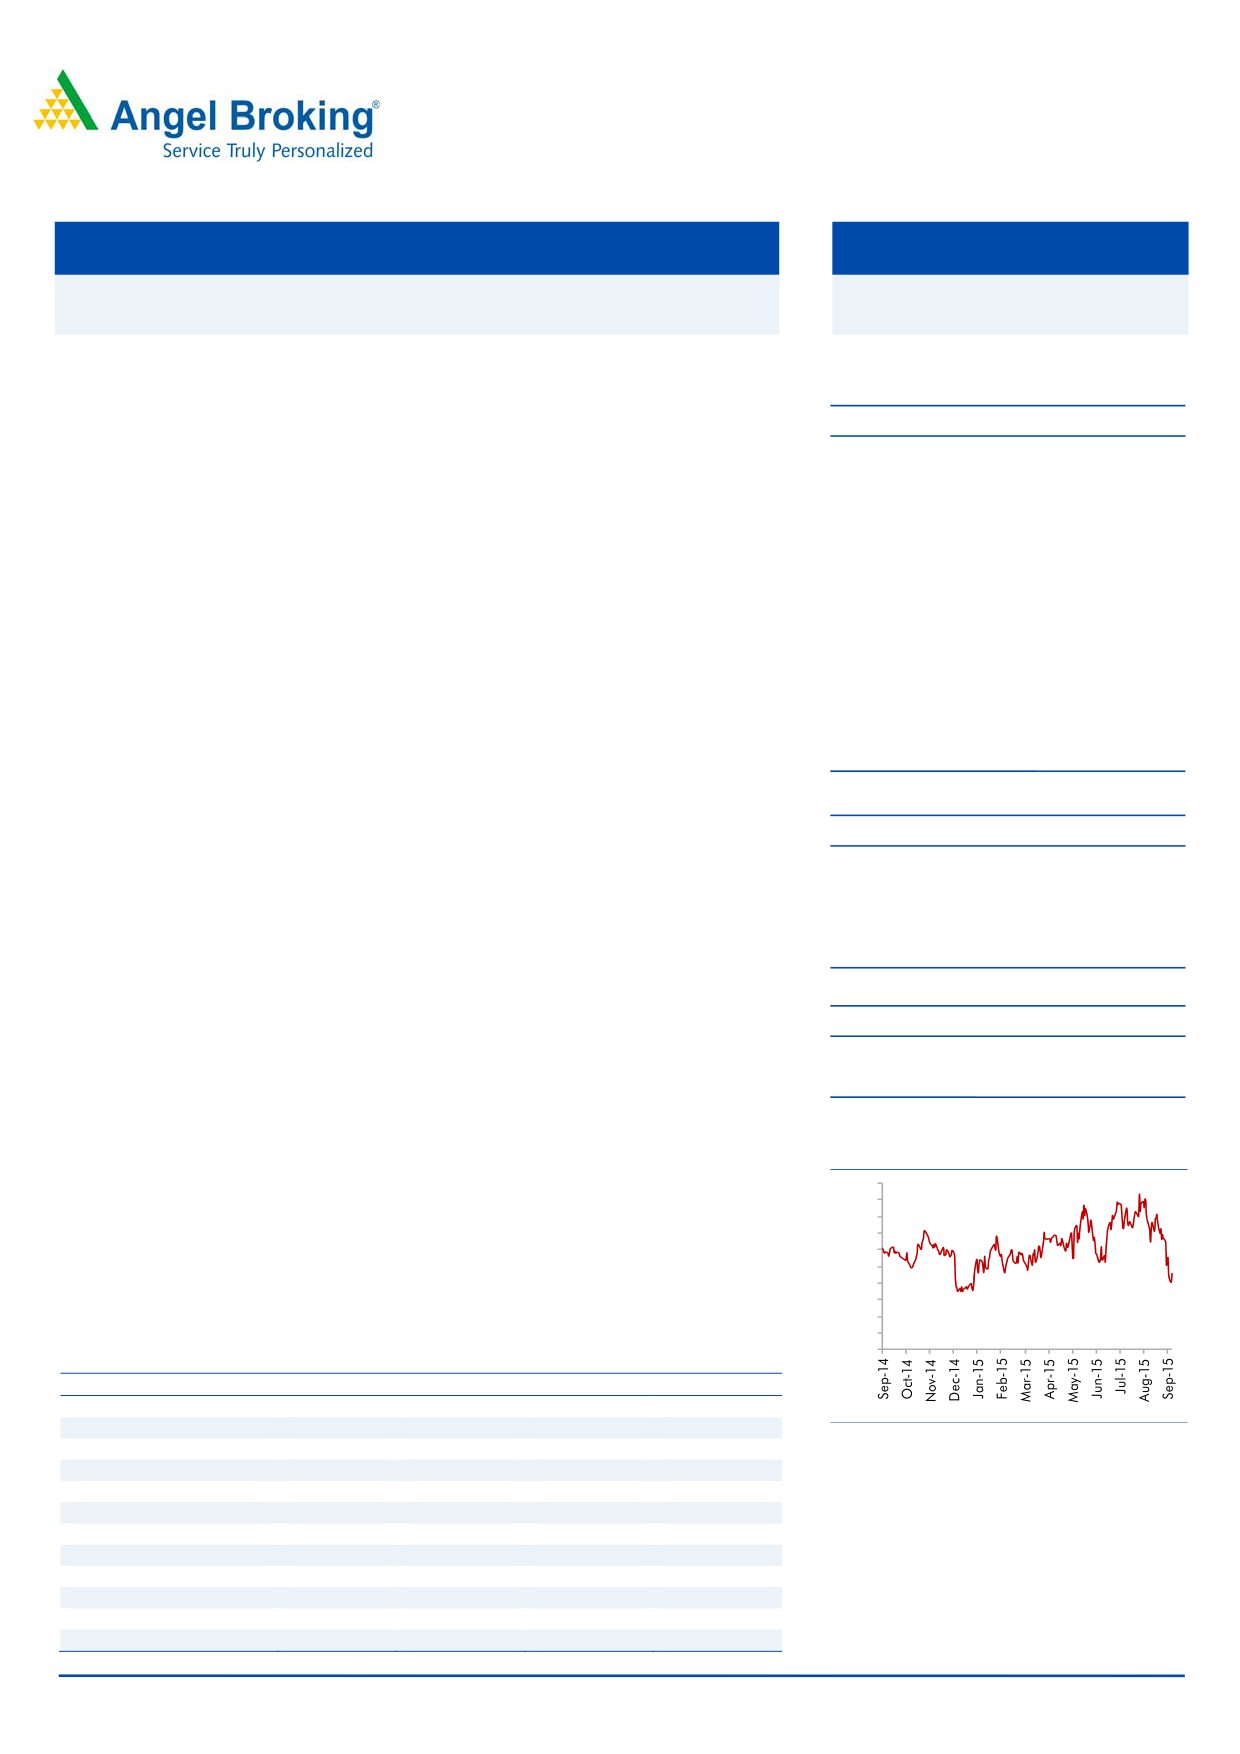
Outlook and Valuation: Given the company’s proven track records and taking into
3 years - share price chart
consideration its strong expansion plans, we expect the company to report strong top-
180
line and bottom-line CAGR of ~28% and ~29% respectively, over FY2015-18E.
175
170
Moreover, the company is asset light, has negligible debt, and has been posting
165
healthy return ratios, which make its balance sheet all the more attractive. At the
160
155
current market price, the stock trades at a P/E of 14.3x its FY2018E EPS. We initiate
150
coverage on the stock with a Buy recommendation and target price of `181 (17x
145
140
FY2018E EPS), indicating an upside of ~19% in the stock price from the present levels.
135
130
Key financials
Y/E March (` cr)
FY2015
FY2016E
FY2017E
FY2018E
Net sales
181
222
287
384
% chg
16.5
22.2
29.4
33.7
Source: Company, Angel Research
Net profit
20
23
30
43
% chg
26.2
12.8
34.0
41.3
EBITDA margin (%)
20.5
20.5
20.5
20.5
EPS (`)
5.0
5.6
7.6
10.7
P/E (x)
30.6
27.1
20.3
14.3
P/BV (x)
6.1
5.1
4.2
3.4
RoE (%)
20.0
18.8
20.7
23.5
RoCE (%)
24.1
26.2
29.3
33.4
Amarjeet S Maurya
EV/Sales (x)
3.4
2.8
2.2
1.6
022-39357800 Ext: 6831
EV/EBITDA (x)
16.7
13.6
10.5
7.8
Source: Company, Angel Research, Note: CMP as of September 8, 2015
Please refer to important disclosures at the end of this report
1
The Byke Hospitality | Hotels
Investment Arguments
Expansion on the cards
Byke is a fast growing hospitality services company, currently operating hotels (own
+ leased) at popular holiday destinations such as Goa, Matheran, Mandawa,
Jaipur, Manali, Shimla, Puri and Mumbai. Its average occupancy level stands at
around 70%.
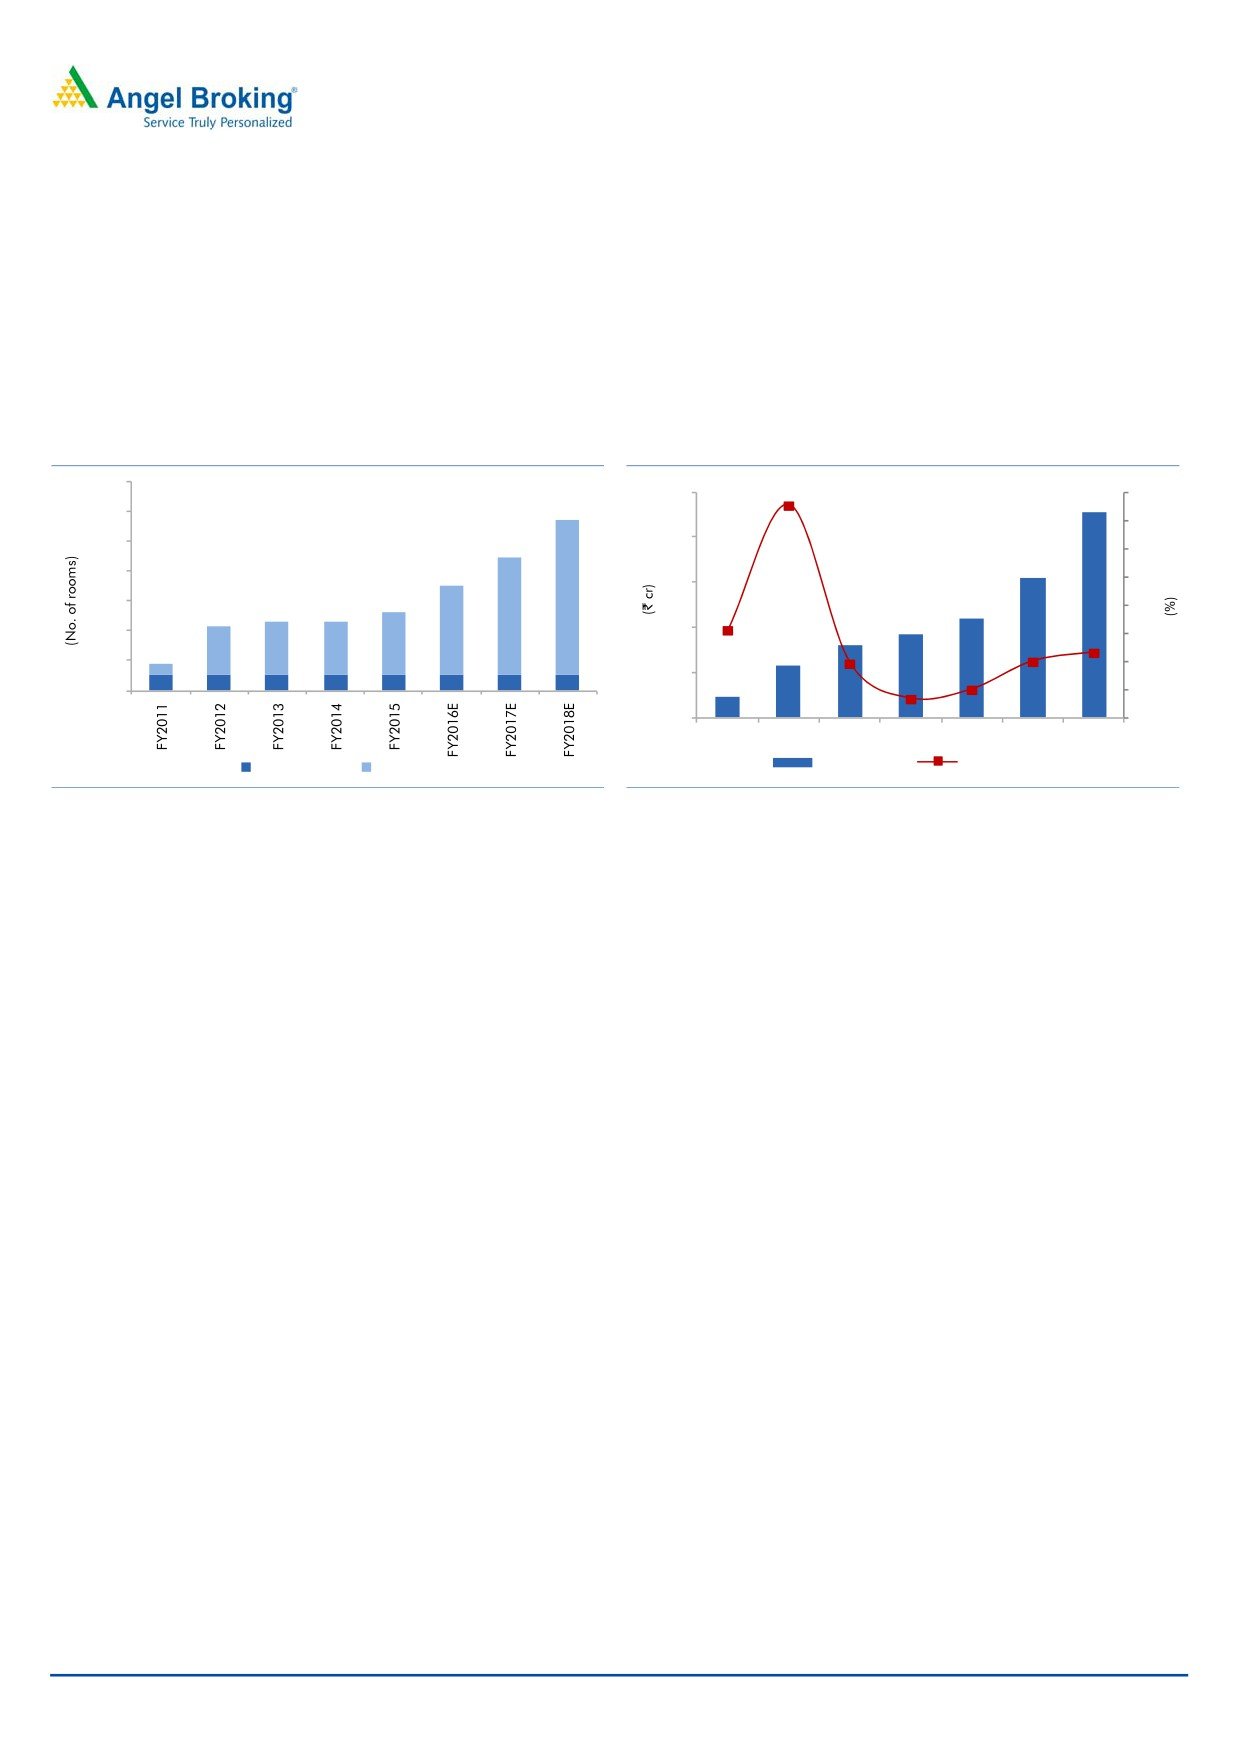
Exhibit 1: Projected growth in hotel rooms
Exhibit 2: Revenue growth from hotel business
1,400
151.1
250
228
160
1,200
140
1,000
200
120
155
800
100
150
1,042
111
600
62.7
80
792
92
400
595
100
81
46.7
60
40.3
323
363
363
417
58
200
40
80
50
20.4
23
13.9
102
102
102
102
102
102
102
102
39.0
0
20
0
0
FY2012
FY2013
FY2014
FY2015
FY2016E FY2017E FY2018E
Owned rooms
Leased rooms
Net Revenue
yoy growth (%)
Source: Company, Angel Research
Source: Company, Angel Research
Byke is now planning to add 8 more
Currently, the company operates 697 rooms, including both owned and leased,
properties, which would lead to an
across 11 properties. The company is now planning to add 8 more properties,
addition of ~450-500 rooms over the
which would lead to an addition of ~450-500 rooms over the next two years. In
next two years
FY2016, the company would be adding 3 properties; ie in Lonavala, Chandigarh,
and Mahabaleshwar, which will lead to an addition of 197 rooms. Further
expansion in addition to the aforementioned is expected to happen in FY2017,
with the tentative locations being Dalhousie, Jodhpur, Udaipur, Darjeeling and
Gangtok; these properties are expected to be fully operational by FY2018. Such
expansion would be based on the lease model (for 10-20 years), thus not
requiring any significant capex. In this segment, we expect the company to report a
top-line CAGR of ~35% over FY2015-18E to `288cr. Moreover, the company
plans to increase the number of properties from 10 to 50 within 5 years under the
asset light expansion plan.
September 9, 2015
2
The Byke Hospitality | Hotels
Exhibit 3: Hotel portfolio of Byke
Name of hotel
Location
Rooms
Type
The Byke Heritage
Matheran (Maharashtra)
80
Owned
The Byke- Sunflower
North Goa
22
Owned
The Byke - Redwood
Matheran (Maharashtra)
25
Leased
The Byke - Old Anchor
South Goa
240
Leased
The Byke- Hidden Paradise North Goa
40
Leased
The Byke - Neelkanth
Manali (Himachal Pradesh)
40
Leased
The Byke- Grassfield
Jaipur (Rajasthan)
54
Leased
The Byke Suraj Plaza
Thane (Mumbai)
122
Leased
Operational in FY16
Shimla & Puri
75
Leased
Upcoming Hotel in FY17
Lonavala
Leased
Upcoming Hotel in FY17
Chandigarh
Leased
Upcoming Hotel in FY17
mahabaleshwar
Leased
Source: Company, Angel Research
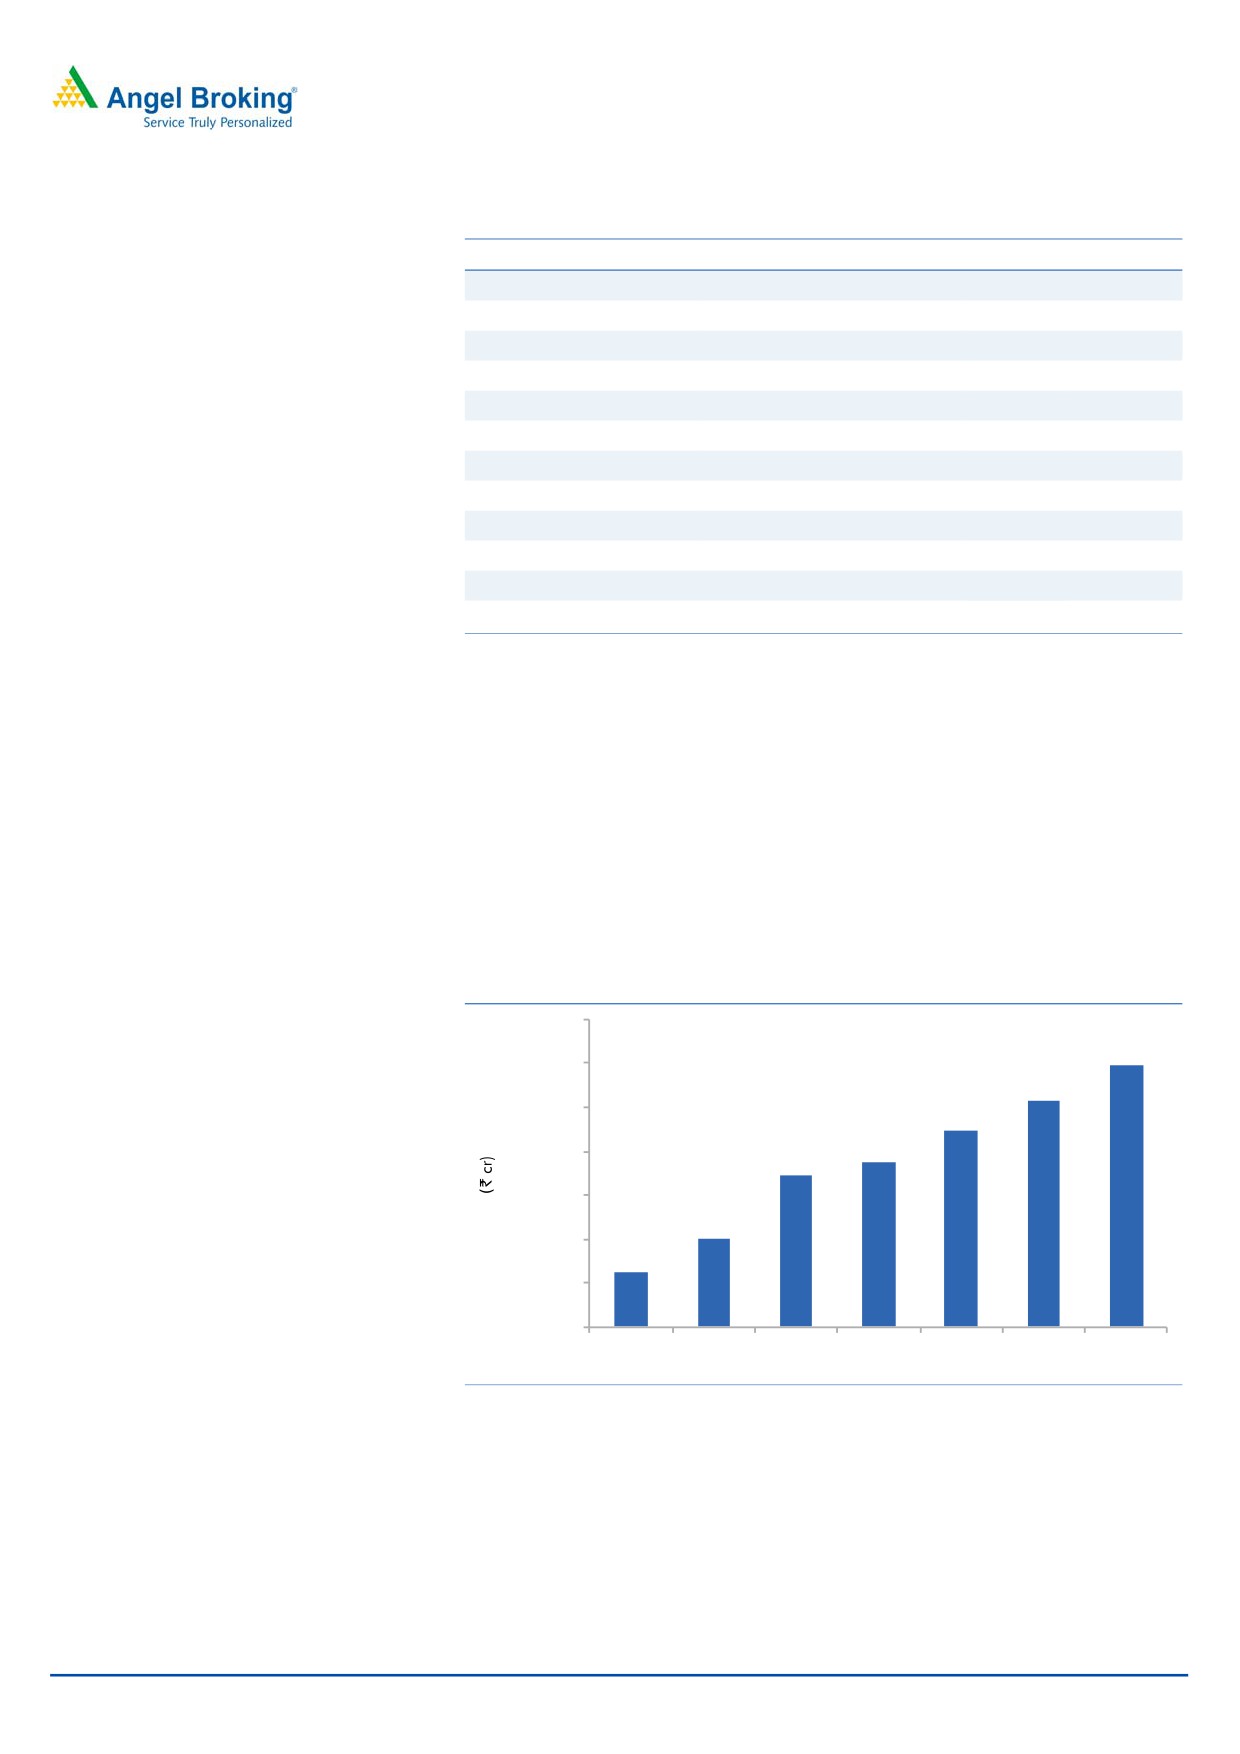
Strong growth in chartering business to drive overall revenue
The chartering model has helped Byke
The company also operates in the chartering business segment. In this segment, it
strengthen its pan-India presence, with
books third-party hotel rooms at strategically identified cultural and religious tourist
it letting out rooms across 50 cities in
destinations during peak seasons, on bulk basis, and lets them out to tourists. It
India, following the model
thus capitalises on the diverse peak seasons across the country and offers
unparalleled choice to guests through its strong marketing network. This model has
helped Byke strengthen its pan-India presence with it letting out rooms across 50
cities in India, following the model.
Exhibit 4: Projected room sales
7,00,000
5,93,728
6,00,000
5,16,286
5,00,000
4,48,944
3,73,250
4,00,000
3,45,000
3,00,000
2,01,355
2,00,000
1,23,758
1,00,000
0
FY2012
FY2013
FY2014
FY2015
FY2016E FY2017E FY2018E
Source: Company, Angel Research
September 9, 2015
3
The Byke Hospitality | Hotels
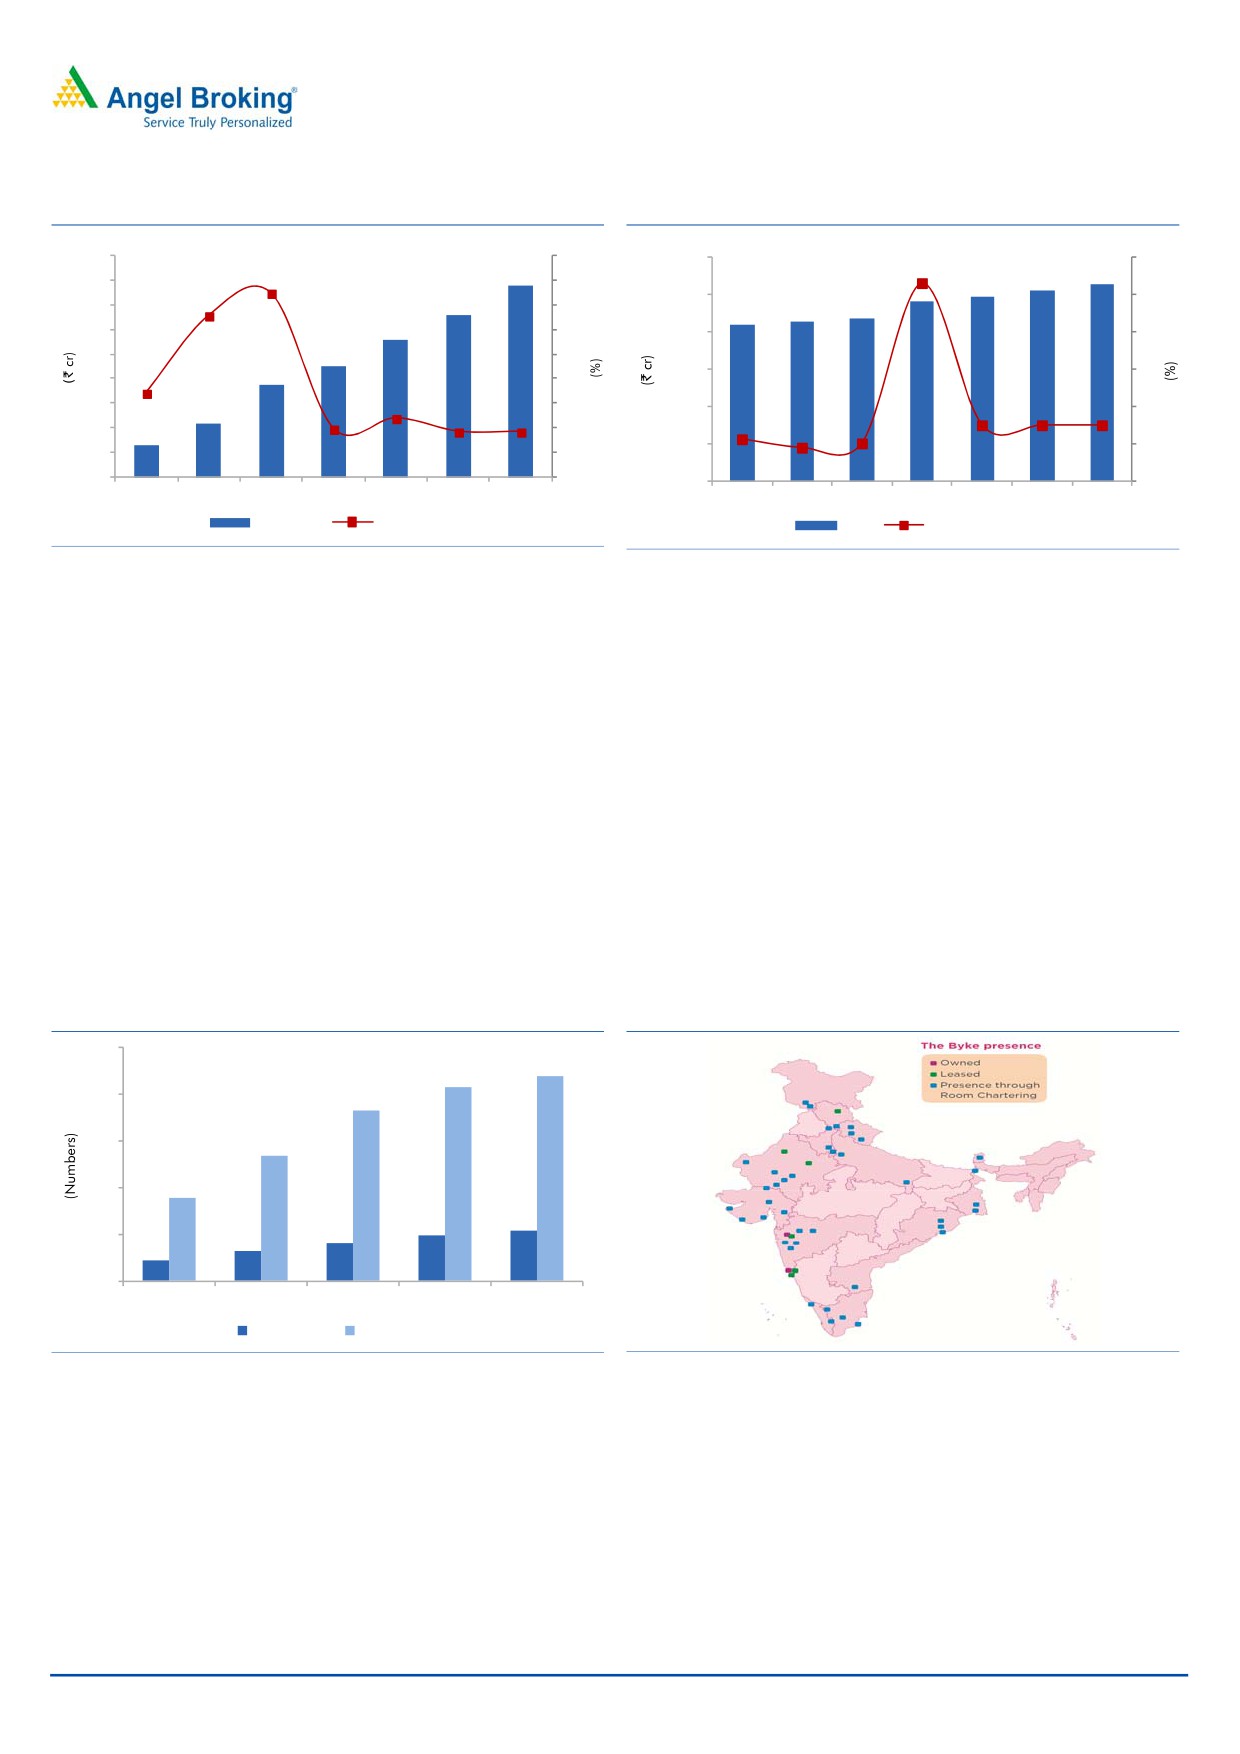
Exhibit 5: Revenue growth in Chartering business
Exhibit 6: Average realisation per room
180
90
3,000
12
156
2,404
2,627
74.8
2,550
160
80
2,476
65.6
132
2,500
10
140
70
2,131
2,174
2,093
111
10.6
120
60
2,000
8
100
90
50
34.2
75
1,500
6
80
40
60
43
23.9
30
1,000
3.0
3.0
3.0
4
19.6
18.5
18.5
2.3
2.0
40
26
20
1.8
500
2
20
10
0
0
0
0
FY2012
FY2013
FY2014
FY2015
FY2016E FY2017E FY2018E
FY2012
FY2013
FY2014
FY2015 FY2016E FY2017E FY2018E
Revenue
yoy growth (%)
ARR
yoy growth (%)
Source: Company, Angel Research
Source: Company, Angel Research
In the chartering segment, we expect
In the chartering segment, the company has a strong track record, with its revenue
the company to report a CAGR of
having grown by 3.5x (`90cr in FY2015) in the last three years. Going forward we
~20% over FY2015-18E, to `156cr
expect strong growth momentum in this segment due to the huge industry size; as
per the company’s Management, the current size of the budget hotel segment is
around `50,000cr. We expect the company to report a CAGR of ~20% over
FY2015-18E, to `156cr.
Strong marketing network supports utilization
Byke has one of the widest sales and
The company has one of the widest sales and marketing network, reaching out to
marketing networks, reaching out to the
the target audience through its 27 owned sales offices and 219 active agents. The
target audience through its 27 owned
company is also having a unique third party marketing tie-up through which the
sales offices and 219 active agents
Byke brand is present across 53 cities in the country.
Exhibit 7: Strong marketing network
Exhibit 8: “The Byke” Presence
250
219
208
200
182
150
134
89
100
48
53
41
50
32
22
0
FY2012
FY2013
FY2014
FY2015
1QFY16
No. of Cities
No. of Agents
Source: Company, Angel Research
Source: Company, Angel Research
A strong network enables the company to avail to higher utilization rates of rooms
in the owned + leased model as well as the chartering business.
September 9, 2015
4
The Byke Hospitality | Hotels
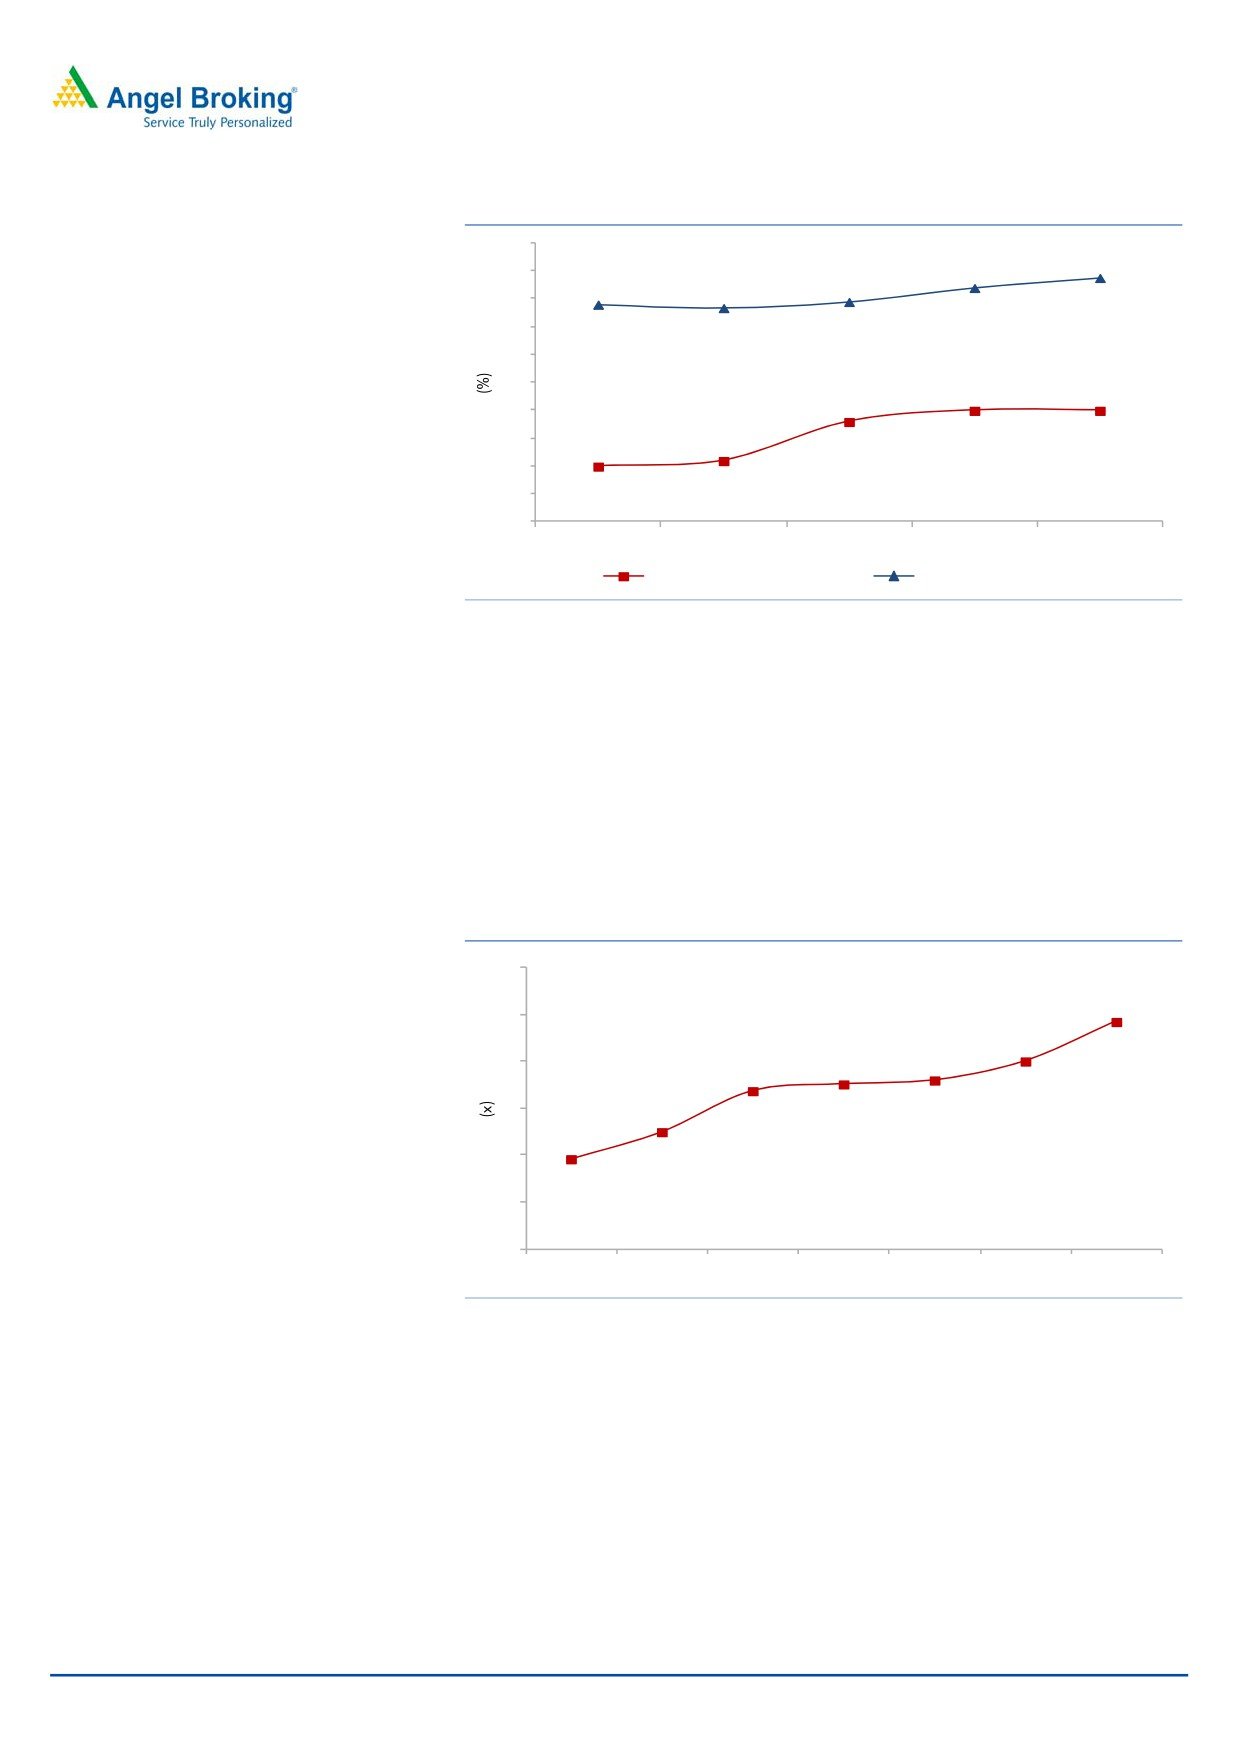
Exhibit 9: Higher utilisation in hotel segments
100
94
92
95
89
89
88
90
85
80
75
70
70
68
70
65
61
60
60
55
50
FY2011
FY2012
FY2013
FY2014
FY2015
Owned + leased business
Chartering business
Source: Company, Angel Research
Asset light business model
As of now, the company has
11
As of now, the company has 11 properties out of which 9 properties are on long
properties, of which, 9 properties are
term lease based over 10-15 years. In the last 5 to 6 years, the company has
on a long term lease over 10-15 years
increased its number of rooms from 102 to 697 as in 1QFY2016. During the
period, the company has added 595 rooms, all of which are based on the lease
model. Further, the company has strong expansion plans through the lease model,
which will also enable it to grow at a faster pace with minimal capex requirement.
Exhibit 10: Net Sales/Gross Block trend
3
2.4
3
2.0
2
1.8
1.8
1.7
2
1.2
1.0
1
1
0
FY2012
FY2013
FY2014
FY2015
FY2016E FY2017E FY2018E
Source: Company, Angel Research
September 9, 2015
5
The Byke Hospitality | Hotels
Financial outlook
Going ahead, we expect Byke to report
Going ahead, we expect Byke to report a top-line CAGR of ~28% over FY2015-
a top-line CAGR of ~28% over FY2015-
18E to ~`384cr owing to strong growth in the hotel business. The growth would
18E to ~`384cr
come on the back of robust expansion of number of rooms at popular destination.
Further, we expect the chartering business to contribute to the company’s growth
as well, aided by a strong marketing network.
On the bottom-line front, we expect the
On the bottom-line front, we expect the company to report a 29% CAGR over
company to report a 29% CAGR over
FY2015-18E on account of healthy top-line growth and operating margin.
FY2015-18E
Moreover, the company is asset light, has negligible debt, and is able to post a
healthy return ratio, which makes its balance sheet all the more attractive.
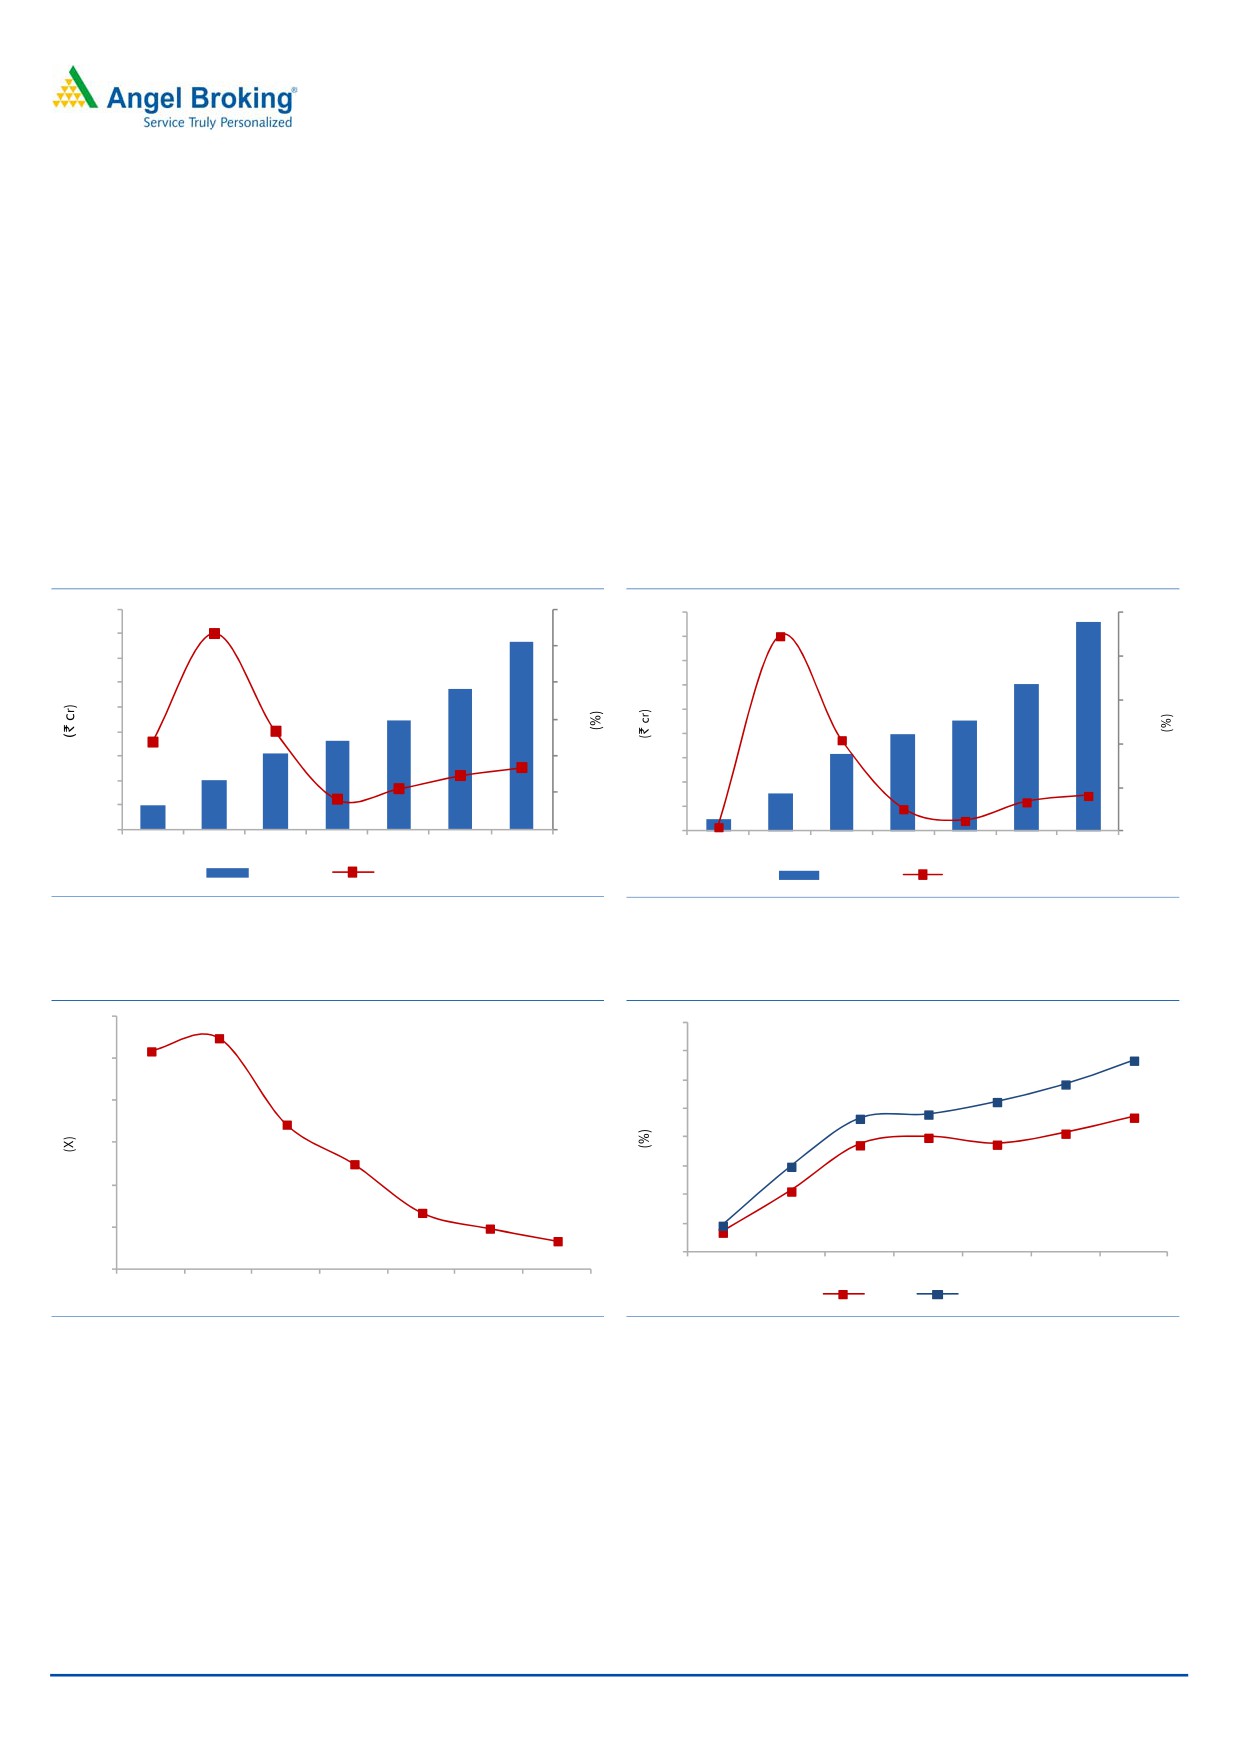
Exhibit 11: Projected Net Sales growth trend
Exhibit 12: Projected Net Profit growth trend
450
106.7
120
45
223.3
43
250
384
400
40
100
350
35
200
287
30
300
80
30
250
222
23
150
53.5
25
47.6
60
20
181
104.8
200
20
156
33.7
100
150
29.4
40
15
101
22.2
16
16.5
8
41.3
100
10
34.0
49
26.2
50
20
2
12.8
50
5
5.7
0
0
0
0
FY2012
FY2013
FY2014
FY2015
FY2016E FY2017E FY2018E
FY2012
FY2013
FY2014
FY2015
FY2016E FY2017E FY2018E
Net Sales
yoy growth (%)
Net Profit
yoy growth (%)
Source: Company, Angel Research
Source: Company, Angel Research
Exhibit 13: Debt/Equity trend
Exhibit 14: ROE and ROCE trend
0.3
40
0.3
0.3
33.4
35
0.3
29.3
30
26.2
23.3
24.1
0.2
25
0.2
20
23.5
0.2
15.0
20.0
20.7
0.1
15
18.7
18.8
0.1
10
4.8
0.1
0.0
10.7
0.1
5
0.0
0
3.6
0.0
FY2012
FY2013
FY2014
FY2015
FY2016E FY2017E FY2018E
FY2012
FY2013
FY2014
FY2015
FY2016E FY2017E FY2018E
ROE
ROCE
Source: Company, Angel Research
Source: Company, Angel Research
September 9, 2015
6
The Byke Hospitality | Hotels
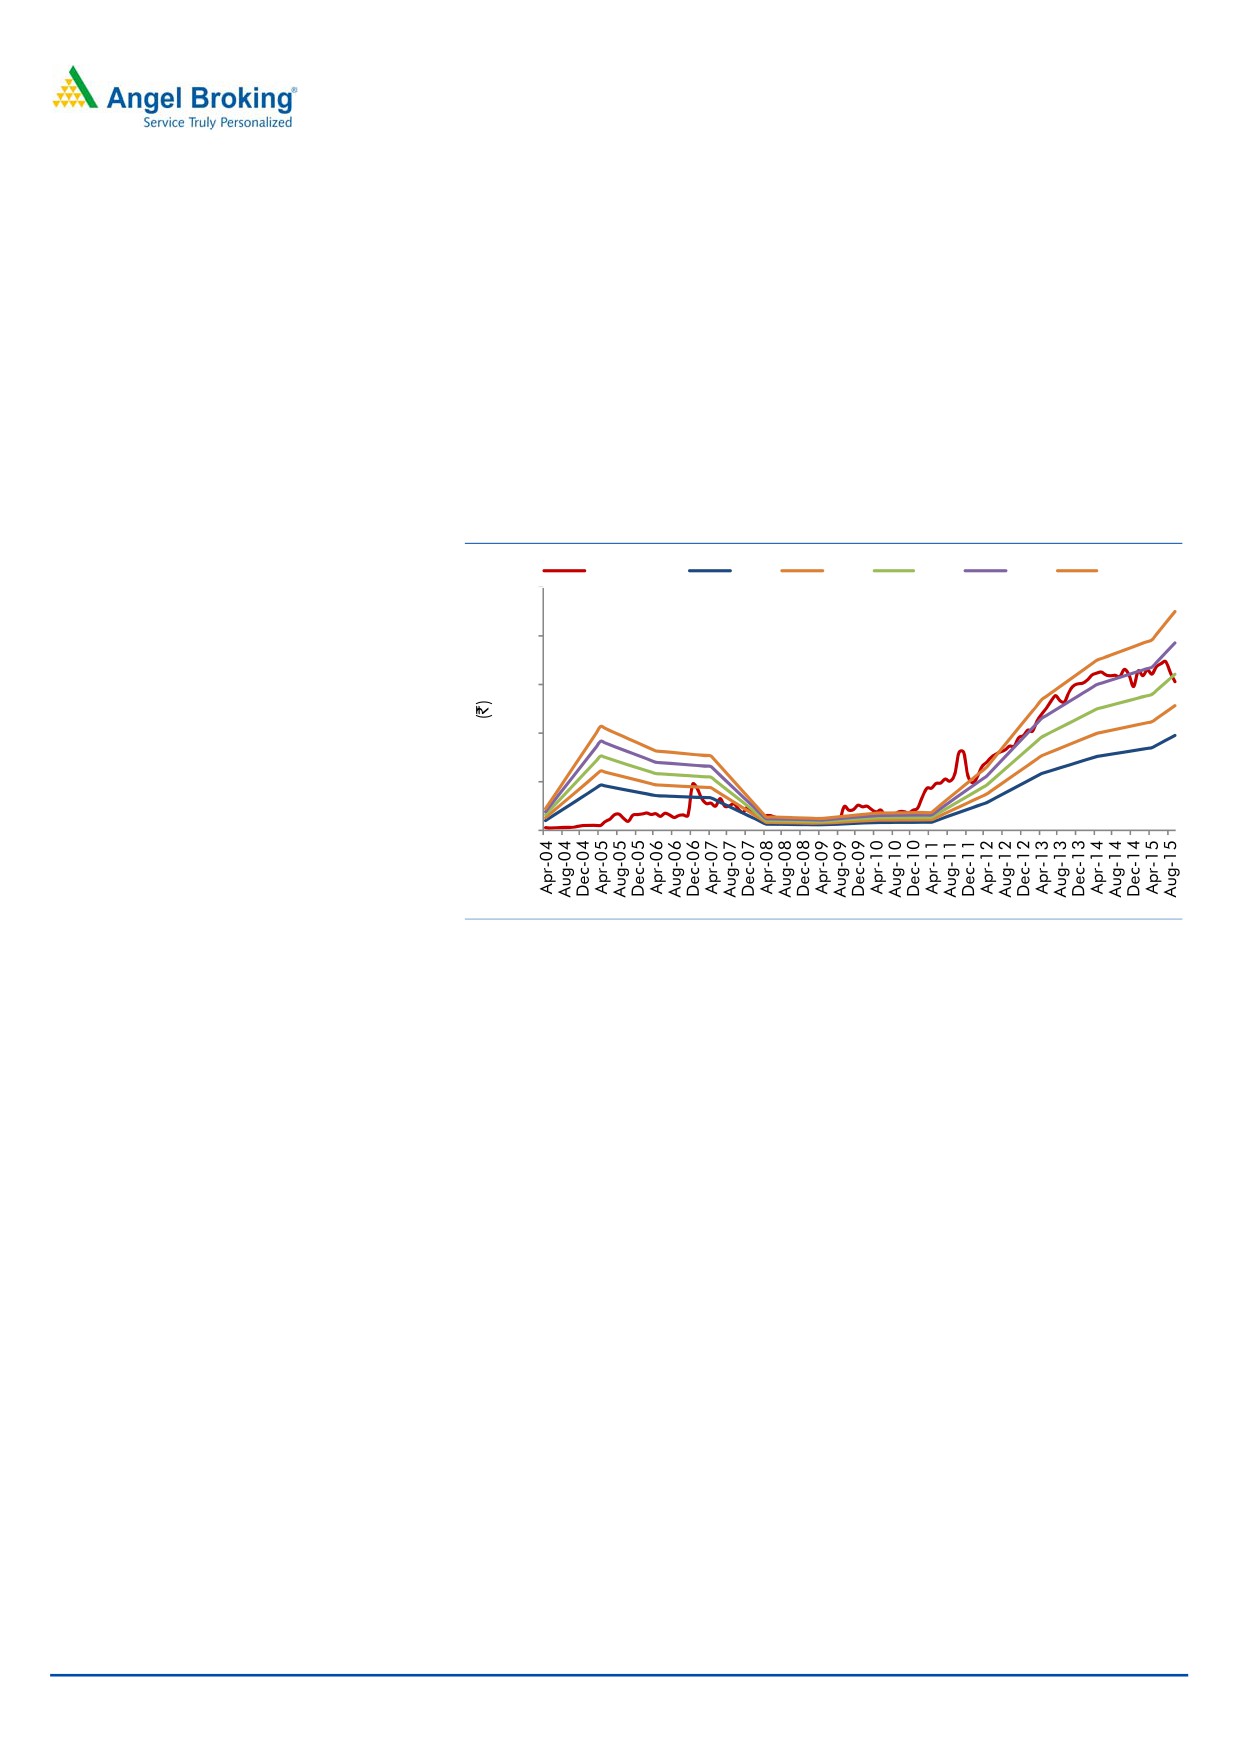
Outlook and Valuation
Given the company’s proven track records and taking into consideration its strong
expansion plans, we expect the company to report strong top-line and bottom-line
CAGR of ~28% and ~29% respectively, over FY2015-18E. Moreover, the
company is asset light, has negligible debt, and has been posting healthy return
ratios, which make its balance sheet all the more attractive. At the current market
price, the stock trades at a P/E of 14.3x its FY2018E EPS. We initiate coverage on
the stock with a Buy recommendation and target price of `181 (17x FY2018E EPS),
indicating an upside of ~19% in the stock price from the present levels.
Exhibit 15: One year PE forward chart
Share Price
15x
20x
25x
30x
35x
250
200
150
100
50
0
Source: Company, Angel Research
Downside risks to our estimates include 1) increase in competition from online
companies like oyorooms.com could impact Byke’s growth in the long term,
(2) slower pace in room addition could impact the company’s earnings,
(3)
slowdown in Indian economy could impact spending in this segment.
September 9, 2015
7
The Byke Hospitality | Hotels
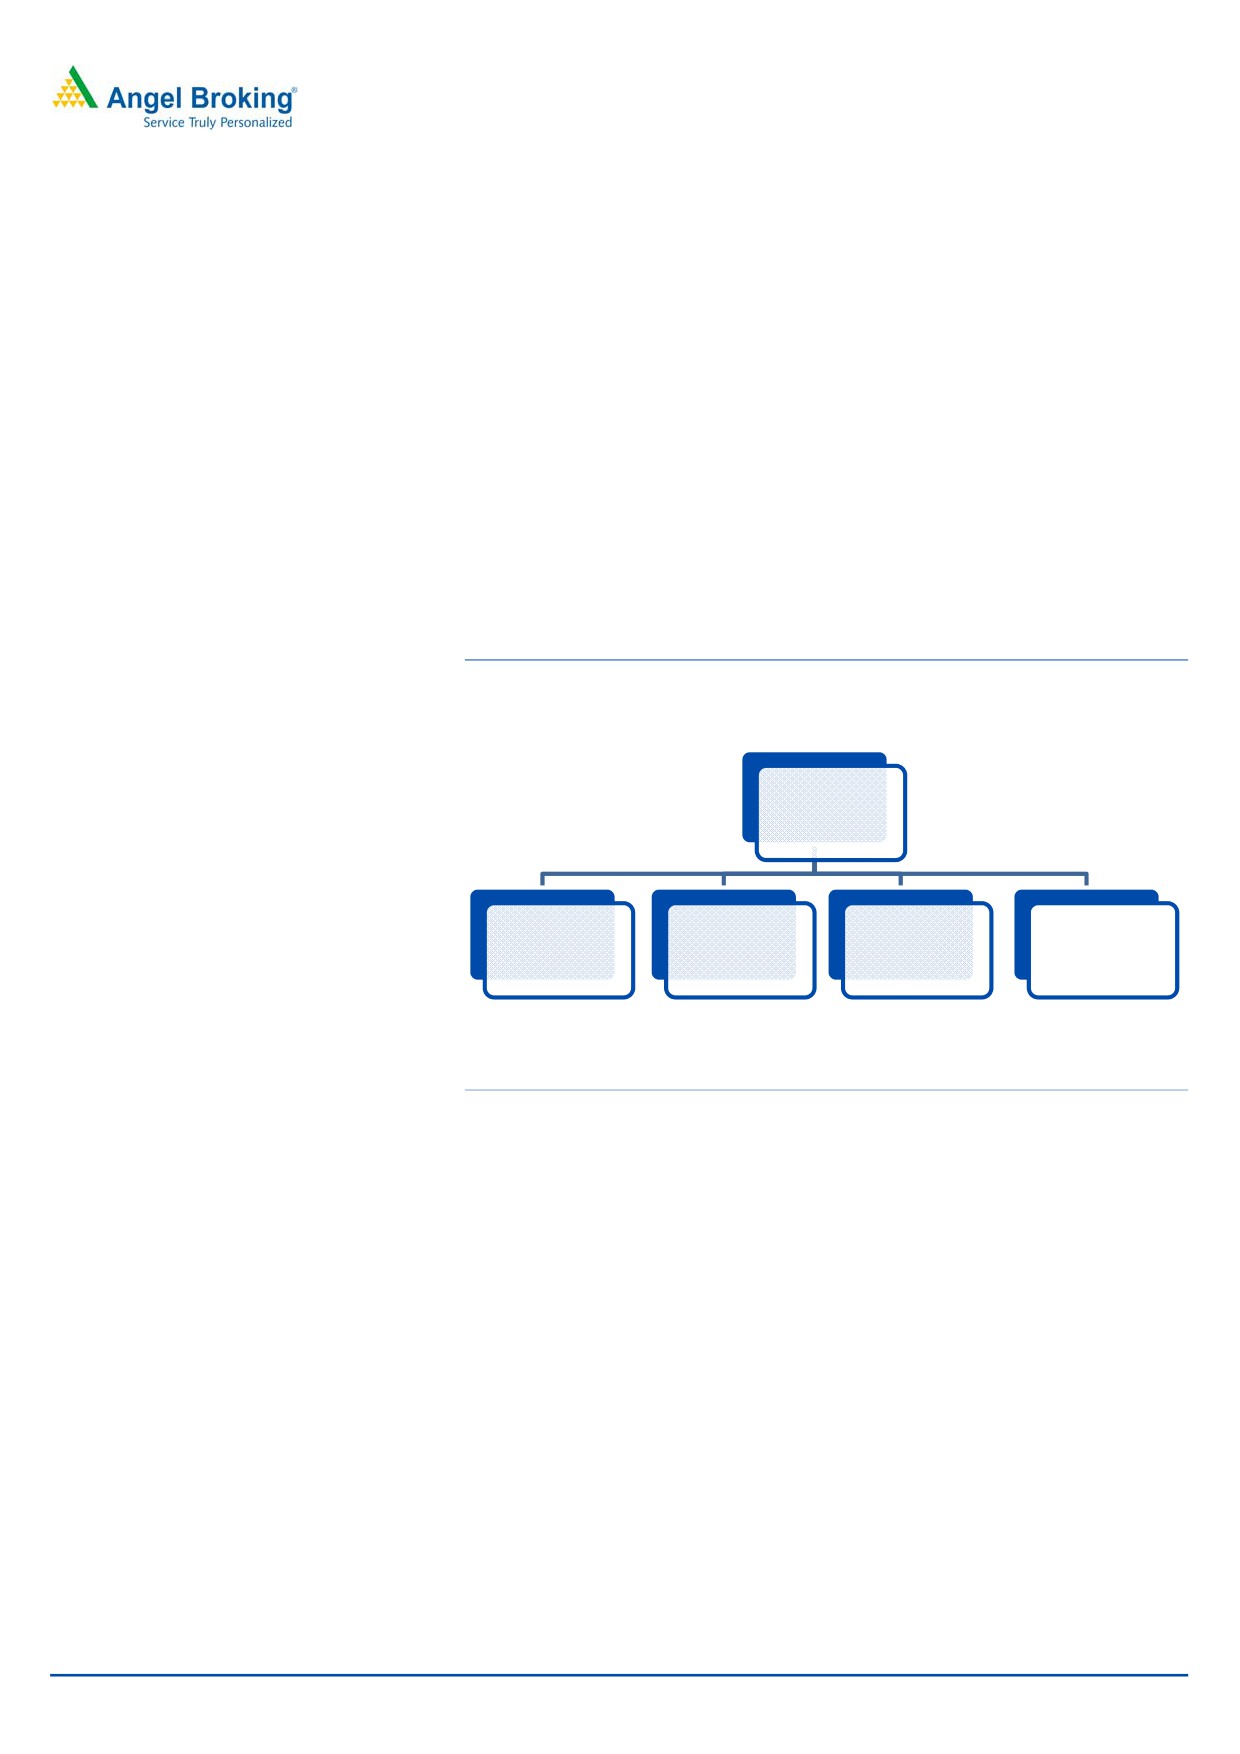
Company Background
Byke Hospitality Ltd (Byke) is an India based hospitality services company. The
company has two business segments - 1) managing properties/hotels and 2) room
chartering. The company operates 11 resorts across Maharashtra, Rajasthan, Goa
and Himachal Pradesh (Manali) with a total bouquet of 697 rooms. It operates
primarily on a lease based model. While 2 of the 11 resorts are owned, the
remaining 9 are on an operating lease of 10-15 years. Under the room chartering
business, the company manages room inventory at various locations. The
company books third-party hotel rooms at strategically identified cultural and
religious tourist destinations during peak seasons, on a bulk basis, and lets them
out to tourists. It is also under the process of developing a travel portal -
tripdeal.com - which will facilitate travel and room booking online and help bolster
Byke’s room chartering business.
Exhibit 16: Segment wise revenue break-up of Byke
Total Revenue
(`182cr )
Rooms
Resort Room
Food &
Chartering
Others (13%)
Bookings (25%)
Beverage (12%)
(49%)
Source: Company, Angel Research
September 9, 2015
8
The Byke Hospitality | Hotels
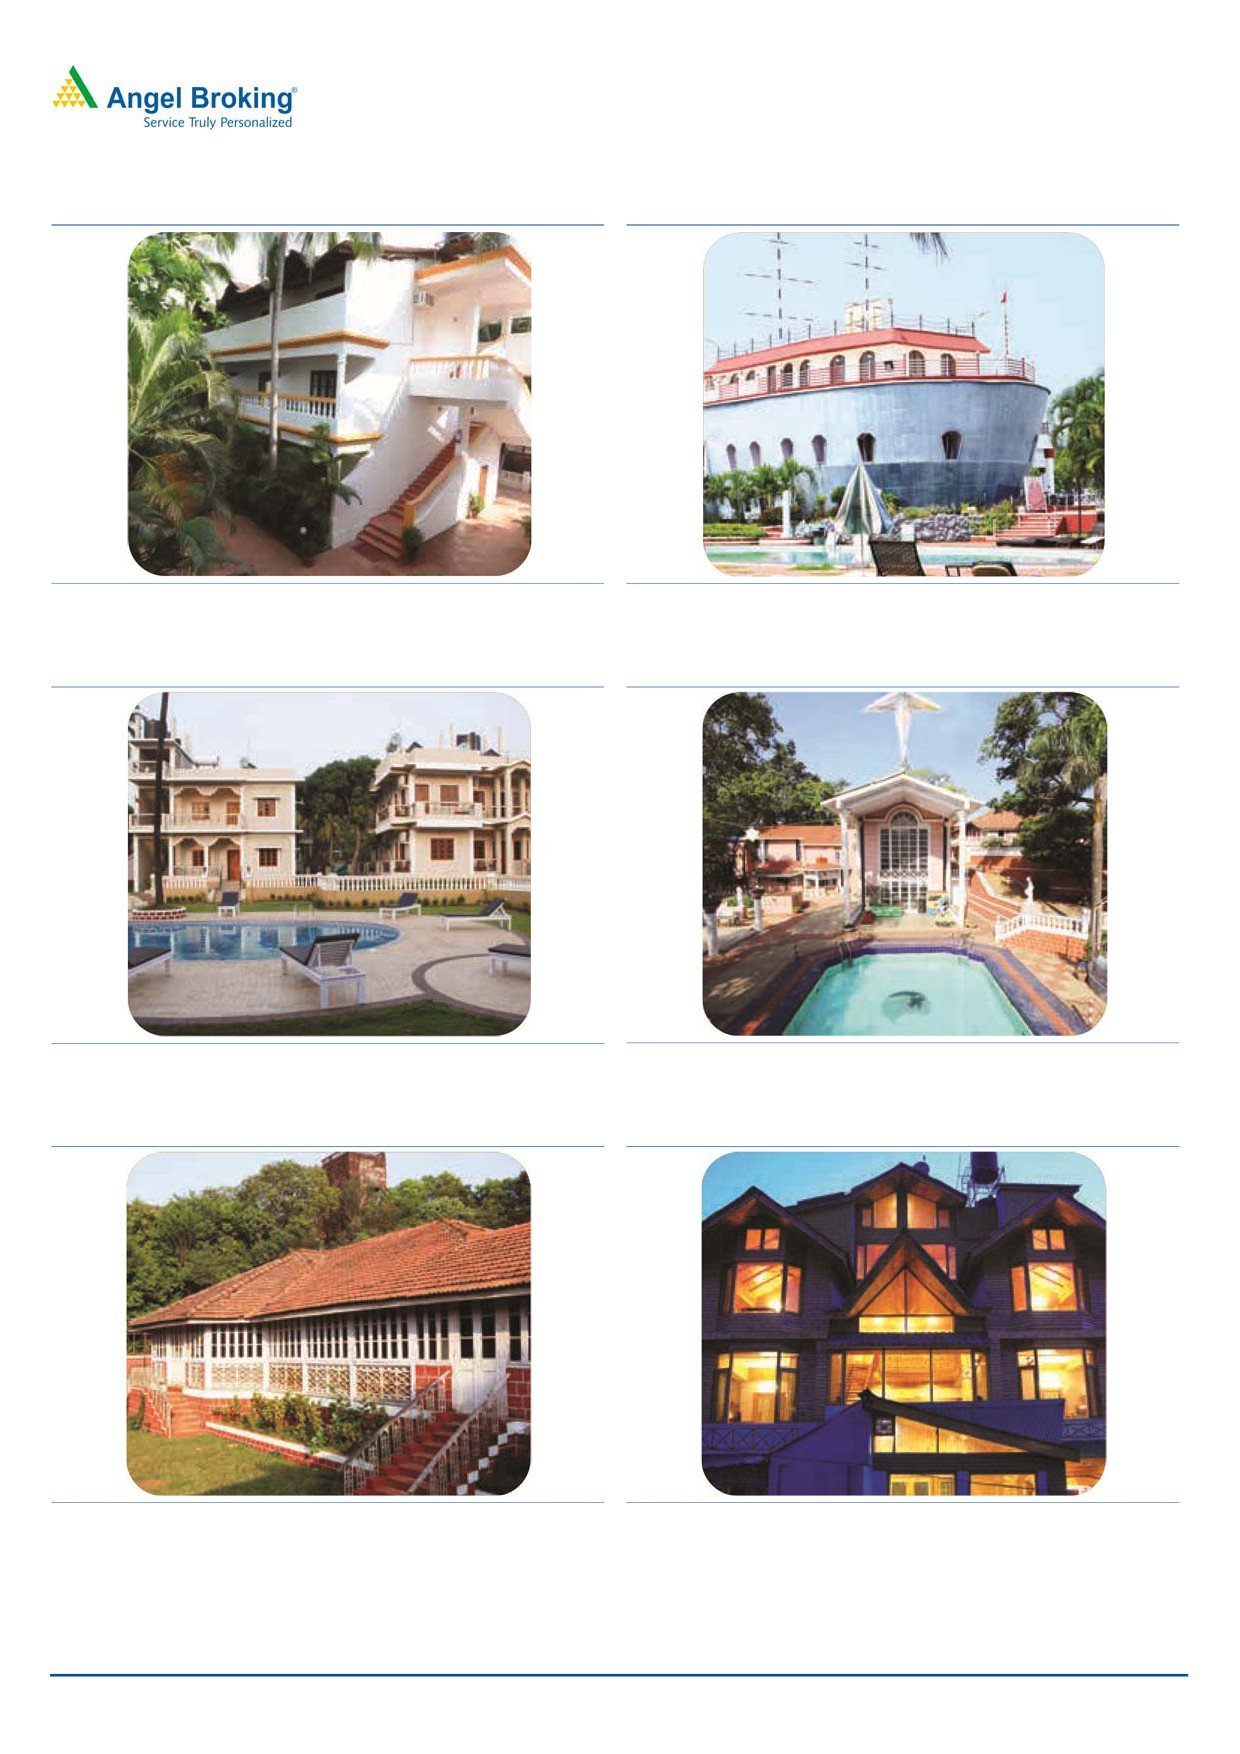
Exhibit 17: The Byke- Sunflower (Goa)
Exhibit 18: The Byke - Old Anchor (Goa)
Source: Company, Angel Research
Source: Company, Angel Research
Exhibit 19: The Byke- Hidden Paradise (Goa)
Exhibit 20: The Byke Heritage (Matheran)
Source: Company, Angel Research
Source: Company, Angel Research
Exhibit 21: The Byke - Redwood (Matheran)
Exhibit 22: The Byke - Neelkanth (Manali)
Source: Company, Angel Research
Source: Company, Angel Research
September 9, 2015
9
The Byke Hospitality | Hotels
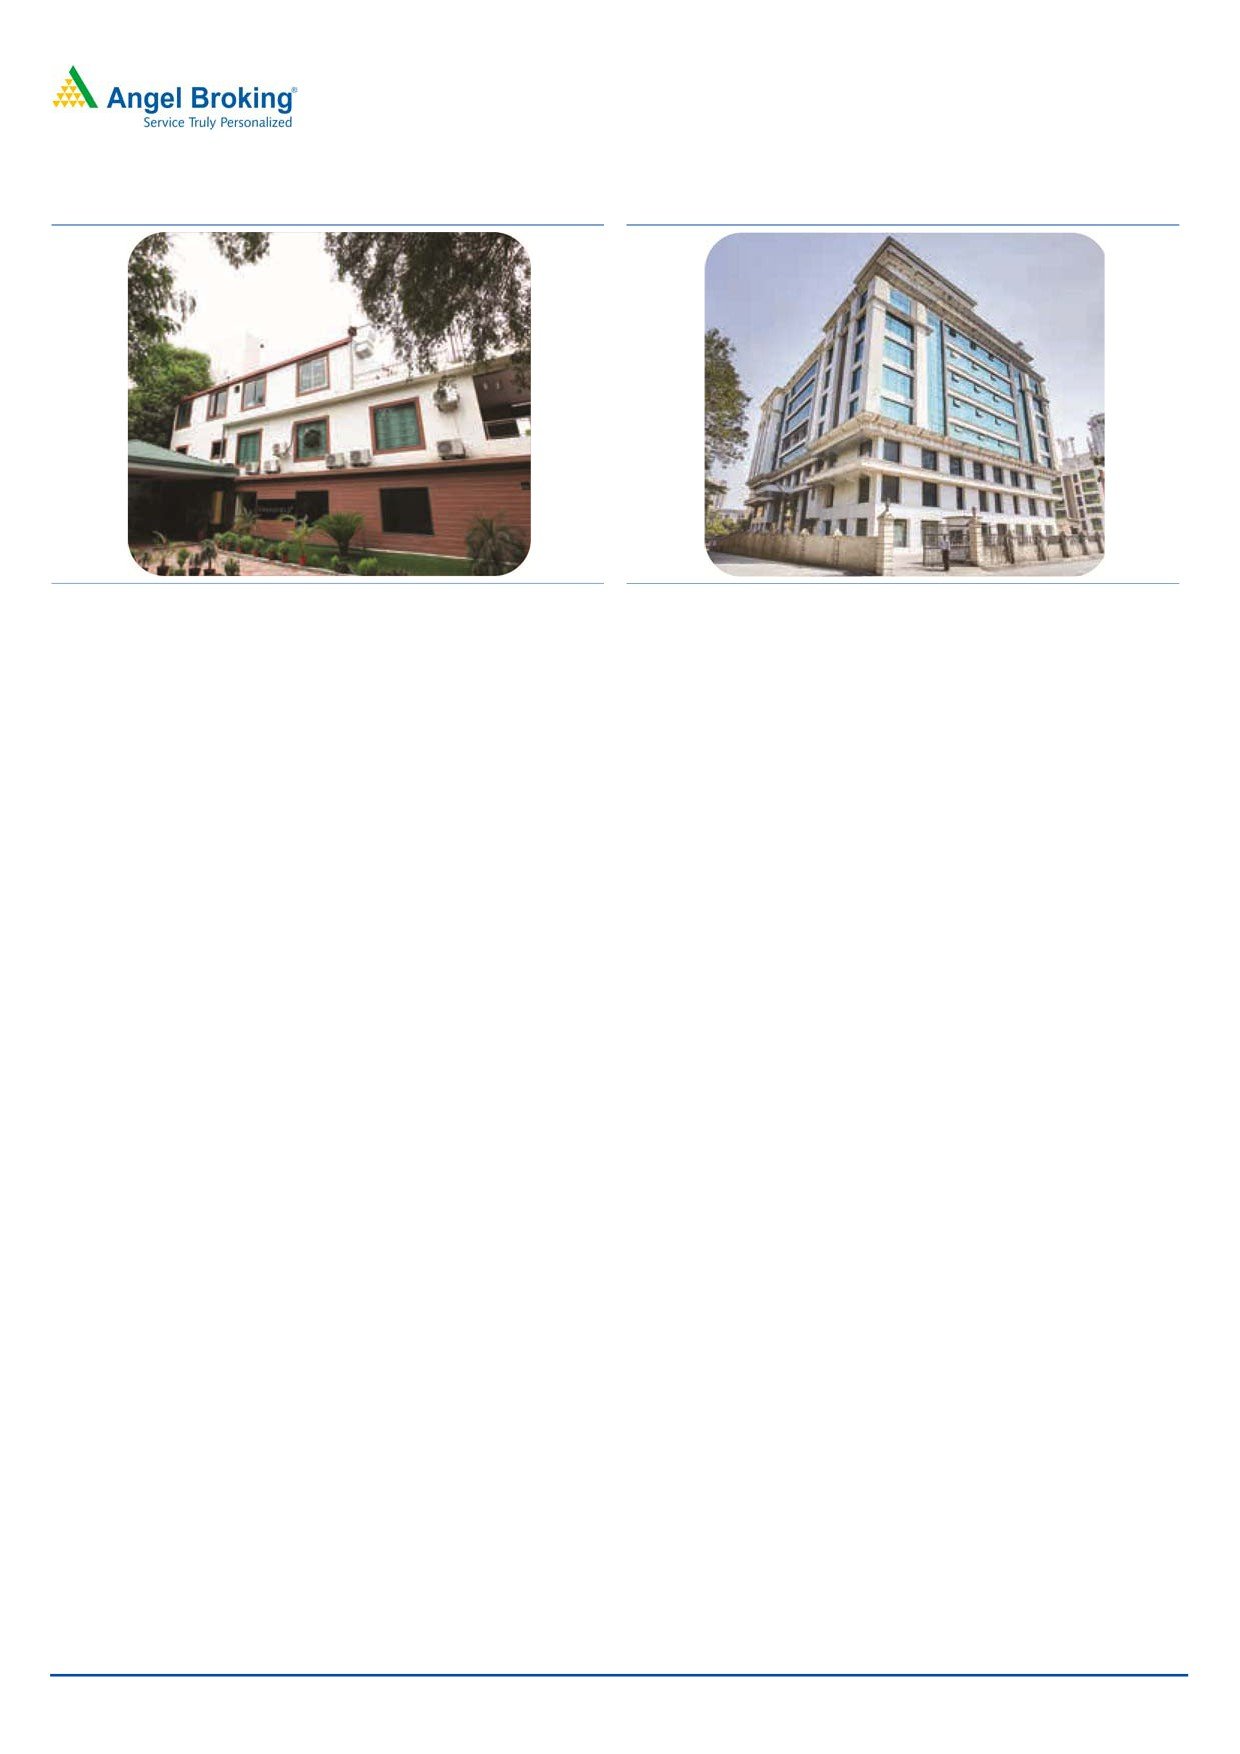
Exhibit 23: The Byke- Grassfield (Jaipur)
Exhibit 24: The Byke Suraj Plaza (Thane - Mumbai)
Source: Company, Angel Research
Source: Company, Angel Research
September 9, 2015
10
The Byke Hospitality | Hotels
Profit & Loss Statement
Y/E March (` cr)
FY2013
FY2014
FY2015
FY2016E
FY2017E
FY2018E
Total operating income
101
156
181
222
287
384
% chg
106.7
53.5
16.5
22.2
29.4
33.7
Total Expenditure
83
127
144
176
228
305
Personnel Expenses
3
3
4
5
7
9
Others Expenses
81
124
140
171
221
296
EBITDA
18
29
37
45
59
79
% chg
251.2
58.2
30.4
22.1
29.4
33.7
(% of Net Sales)
17.8
18.3
20.5
20.5
20.5
20.5
Depreciation& Amortisation
4
5
10
12
14
16
EBIT
14
23
27
34
45
63
% chg
244.8
67.2
16.8
24.0
33.5
40.1
(% of Net Sales)
13.7
14.9
14.9
15.1
15.6
16.4
Interest & other Charges
2
2
2
1
1
1
Other Income
-
0
0
0
0
0
(% of PBT)
-
0.7
0.4
0.3
0.3
0.2
Share in profit of Associates
-
-
-
-
-
-
Recurring PBT
12
21
25
32
44
62
% chg
225.6
83.8
19.4
27.3
35.9
41.3
Prior Period & Extraord. Exp./(Inc.)
-
-
-
-
-
-
PBT (reported)
12
21
25
32
44
62
Tax
4
5
5
10
14
19
(% of PBT)
32.9
25.2
21.0
30.0
31.0
31.0
PAT (reported)
8
16
20
23
30
43
Add: Share of earnings of asso.
-
-
-
-
-
-
Less: Minority interest (MI)
-
-
-
-
-
-
PAT after MI (reported)
8
16
20
23
30
43
ADJ. PAT
8
16
20
23
30
43
% chg
223.3
104.8
26.2
12.8
34.0
41.3
(% of Net Sales)
7.7
10.2
11.1
10.2
10.6
11.2
Basic EPS (`)
1.9
4.0
5.0
5.6
7.6
10.7
Fully Diluted EPS (`)
1.9
4.0
5.0
5.6
7.6
10.7
% chg
223.3
104.8
26.2
12.8
34.0
41.3
September 9, 2015
11
The Byke Hospitality | Hotels
Balance Sheet
Y/E March (` cr)
FY2013
FY2014
FY2015
FY2016E FY2017E FY2018E
SOURCES OF FUNDS
Equity Share Capital
20
20
40
40
40
40
Reserves& Surplus
52
65
60
80
106
142
Shareholders Funds
72
85
100
120
146
182
Minority Interest
-
-
-
-
-
-
Total Loans
20
15
12
8
7
6
Deferred Tax Liability
4
6
5
5
5
5
Total Liabilities
96
105
117
133
158
193
APPLICATION OF FUNDS
Gross Block
81
92
103
123
143
158
Less: Acc. Depreciation
9
14
24
36
50
66
Net Block
73
78
79
87
93
92
Capital Work-in-Progress
3
4
2
2
2
2
Investments
-
-
-
-
-
-
Current Assets
38
43
55
69
96
146
Inventories
6
6
6
7
9
11
Sundry Debtors
12
11
14
18
24
33
Cash
1
2
2
2
3
6
Loans & Advances
13
19
31
40
57
89
Other Assets
5
6
2
2
3
8
Current liabilities
17
21
19
24
33
47
Net Current Assets
20
22
37
44
63
99
Deferred Tax Asset
0
1
-
-
-
-
Mis. Exp. not written off
-
-
-
-
-
-
Total Assets
96
105
117
133
158
193
September 9, 2015
12
The Byke Hospitality | Hotels
Cashflow Statement
Y/E March (` cr)
FY2013
FY2014
FY2015
FY2016E FY2017E FY2018E
Profit before tax
12
21
25
32
44
62
Depreciation
4
5
10
12
14
16
Change in Working Capital
(2)
(4)
(16)
(7)
(18)
(33)
Interest / Dividend (Net)
2
2
2
1
1
1
Direct taxes paid
(0)
(5)
(5)
(10)
(14)
(19)
Others
0
0
(0)
-
-
-
Cash Flow from Operations
16
20
16
28
28
26
(Inc.)/ Dec. in Fixed Assets
(15)
(9)
(9)
(20)
(20)
(15)
(Inc.)/ Dec. in Investments
-
-
-
-
-
-
Cash Flow from Investing
(15)
(9)
(9)
(20)
(20)
(15)
Issue of Equity
-
-
-
-
-
-
Inc./(Dec.) in loans
2
(5)
(2)
(4)
(1)
(1)
Dividend Paid (Incl. Tax)
(2)
(2)
(4)
(3)
(4)
(7)
Interest / Dividend (Net)
(2)
(2)
(2)
(1)
(1)
(1)
Cash Flow from Financing
(2)
(10)
(7)
(9)
(6)
(9)
Inc./(Dec.) in Cash
(1)
1
0
(0)
1
3
Opening Cash balances
2
1
2
2
2
3
Closing Cash balances
1
2
2
2
3
6
September 9, 2015
13
The Byke Hospitality | Hotels
Key Ratios
Y/E March
FY2013
FY2014
FY2015 FY2016E FY2017E FY2018E
Valuation Ratio (x)
P/E (on FDEPS)
79.1
38.6
30.6
27.1
20.3
14.3
P/CEPS
51.3
28.8
20.3
17.8
13.9
10.5
P/BV
8.5
7.2
6.1
5.1
4.2
3.4
Dividend yield (%)
0.3
0.5
0.3
0.4
0.7
1.1
EV/Sales
6.2
4.0
3.4
2.8
2.2
1.6
EV/EBITDA
35.0
21.9
16.7
13.6
10.5
7.8
EV / Total Assets
5.6
5.0
4.6
3.9
3.2
2.6
Per Share Data (`)
EPS (Basic)
1.9
4.0
5.0
5.6
7.6
10.7
EPS (fully diluted)
1.9
4.0
5.0
5.6
7.6
10.7
Cash EPS
3.0
5.3
7.5
8.6
11.0
14.6
DPS
0.5
0.8
0.5
0.7
1.1
1.7
Book Value
18.1
21.2
25.0
29.9
36.4
45.4
Returns (%)
ROCE
15.0
23.3
24.1
26.2
29.3
33.4
Angel ROIC (Pre-tax)
15.2
23.8
24.6
26.7
30.0
34.5
ROE
10.7
18.7
20.0
18.8
20.7
23.5
Turnover ratios (x)
Asset Turnover (Gross Block)
1.2
1.7
1.8
1.8
2.0
2.4
Inventory / Sales (days)
22
14
12
11
11
10
Receivables (days)
43
25
28
29
30
31
Payables (days)
33
15
13
14
14
14
WC cycle (ex-cash) (days)
32
24
27
26
27
27
September 9, 2015
14
The Byke Hospitality | Hotels
Research Team Tel: 022 - 39357800
DISCLAIMER
Angel Broking Private Limited (hereinafter referred to as “Angel”) is a registered Member of National Stock Exchange of India Limited,
Bombay Stock Exchange Limited and MCX Stock Exchange Limited. It is also registered as a Depository Participant with CDSL and
Portfolio Manager with SEBI. It also has registration with AMFI as a Mutual Fund Distributor. Angel Broking Private Limited is a
registered entity with SEBI for Research Analyst in terms of SEBI (Research Analyst) Regulations, 2014 vide registration number
INH000000164. Angel or its associates has not been debarred/ suspended by SEBI or any other regulatory authority for accessing
/dealing in securities Market. Angel or its associates including its relatives/analyst do not hold any financial interest/beneficial
ownership of more than 1% in the company covered by Analyst. Angel or its associates/analyst has not received any compensation /
managed or co-managed public offering of securities of the company covered by Analyst during the past twelve months. Angel/analyst
has not served as an officer, director or employee of company covered by Analyst and has not been engaged in market making activity
of the company covered by Analyst.
This document is solely for the personal information of the recipient, and must not be singularly used as the basis of any investment
decision. Nothing in this document should be construed as investment or financial advice. Each recipient of this document should
make such investigations as they deem necessary to arrive at an independent evaluation of an investment in the securities of the
companies referred to in this document (including the merits and risks involved), and should consult their own advisors to determine
the merits and risks of such an investment.
Reports based on technical and derivative analysis center on studying charts of a stock's price movement, outstanding positions and
trading volume, as opposed to focusing on a company's fundamentals and, as such, may not match with a report on a company's
fundamentals.
The information in this document has been printed on the basis of publicly available information, internal data and other reliable
sources believed to be true, but we do not represent that it is accurate or complete and it should not be relied on as such, as this
document is for general guidance only. Angel Broking Pvt. Limited or any of its affiliates/ group companies shall not be in any way
responsible for any loss or damage that may arise to any person from any inadvertent error in the information contained in this report.
Angel Broking Pvt. Limited has not independently verified all the information contained within this document. Accordingly, we cannot
testify, nor make any representation or warranty, express or implied, to the accuracy, contents or data contained within this document.
While Angel Broking Pvt. Limited endeavors to update on a reasonable basis the information discussed in this material, there may be
regulatory, compliance, or other reasons that prevent us from doing so.
This document is being supplied to you solely for your information, and its contents, information or data may not be reproduced,
redistributed or passed on, directly or indirectly.
Neither Angel Broking Pvt. Limited, nor its directors, employees or affiliates shall be liable for any loss or damage that may arise from
or in connection with the use of this information.
Note: Please refer to the important ‘Stock Holding Disclosure' report on the Angel website (Research Section). Also, please refer to the
latest update on respective stocks for the disclosure status in respect of those stocks. Angel Broking Pvt. Limited and its affiliates may
have investment positions in the stocks recommended in this report.
Disclosure of Interest Statement
The Byke Hospitality
1. Analyst ownership of the stock
No
2. Angel and its Group companies ownership of the stock
No
3. Angel and its Group companies' Directors ownership of the stock
No
4. Broking relationship with company covered
No
Note: We have not considered any Exposure below ` 1 lakh for Angel, its Group companies and Directors
Ratings (Based on expected returns
Buy (> 15%)
Accumulate (5% to 15%)
Neutral (-5 to 5%)
over 12 months investment period):
Reduce (-5% to -15%)
Sell (< -15)
September 9, 2015
15