3QFY2016 Result Update | Cons. Durables
February 5, 2016
Blue Star
BUY
CMP
`353
Performance Highlights
Target Price
`439
Y/E March (` cr)
3QFY2016 3QFY2015
% chg (yoy) 2QFY2016
% chg (qoq)
Investment Period
12 Months
Net Sales
686
596
15.1
717
(4.3)
EBITDA
28
9
217.7
27
3.3
EBITDA margin (%)
4.1
1.5
259bp
3.8
30bp
Stock Info
Adj. PAT
7
(12)
(156.1)
10
(32.6)
Sector
Cons. Durable
Source: Company, Angel Research (Standalone)
Market Cap (` cr)
3,177
Blue Star’s standalone numbers for 3QFY2016 have come in in-line with our
Net Debt
317
estimates. The top-line for the quarter reported an impressive 15.1% yoy increase
Beta
0.7
to `686cr. Raw material cost as a percentage of sales increased by 175bp yoy to
52 Week High / Low
398 / 274
68.9% but the same got offset by a 94bp yoy and 341bp yoy decline in Employee
Avg. Daily Volume
13,947
and Other expenses as a percentage of sales to 9.7% and 17.4%, respectively.
Face Value (`)
2
The EBITDA margin expanded by 259bp yoy to 4.1%. There was an exceptional
BSE Sensex
24,388
loss of `2cr during the quarter due to bonus expenses for earlier years. Adjusting
Nifty
7,404
for the exceptional item, the net profit came in at `7cr.
Reuters Code
BLUS.BO
Bloomberg Code
BLSTR IN
Improvement in macro scenario to support growth: The Cooling
Products Division (CPD) has been the key performer for the company and is
expected to carry the baton till the Electro Mechanical Projects and Packaged
Shareholding Pattern (%)
Air-conditioning Systems (EMPPAC) division fully recovers on the back of an
Promoters
39.5
expected improvement in the macro scenario. Slow order finalization and
execution has impacted the EMPPAC division’s performance, which however is
MF / Banks / Indian Fls
23.6
likely to rebound as market conditions improve. The company has been brisk in
FII / NRIs / OCBs
9.4
adding orders after clearing out a large chunk of legacy orders. The company’s
Indian Public / Others
27.5
room air conditioning (RAC) business has been outgrowing the industry by ~10%
points over the last few quarters, resulting in the company consistently increasing its
market share (from ~7% in FY2014 to 10.5% at present). With strong brand equity
Abs.(%)
3m 1yr 3yr
and higher share in split ACs, we expect the CPD to continue to drive growth.
Sensex
(8.3)
(15.7)
23.5
Outlook and valuation: We expect Blue Star to report a CAGR of 11.2% in
BLUESTAR
(2.9)
3.5
105.7
its revenue over FY2015-18E to `4,375cr. The EBITDA margin is expected to
expand by 188bp over FY2015-18E to 7.1% due to better margin orders.
Consequently, the net profit is expected to be at `182cr in FY2018E. Moreover,
3 Year Price Chart
the proposed merger with Blue Star Infotech will provide cash influx and thus
600
strengthen the balance sheet. At the current market price, the stock trades at 20.6x and
500
18.5x its FY2017E and FY2018E earnings respectively and at 0.8x and 0.7x FY2017E
400
and FY2018E EV/sales (while its close peer Voltas trades at 1.5x its FY2017E EV/sales).
300
At a target P/E multiple of 23.0x, the implied FY2018E EV/sales multiple works out to
200
1.0x, which is comforting. Hence we recommend a Buy on the stock.
100
Key financials (Consolidated)
-
Y/E March (` cr)
FY2015
FY2016E
FY2017E
FY2018E
Net Sales
3,182
3,548
3,977
4,375
% chg
8.4
11.5
12.1
10.0
Net Profit
96
123
164
182
% chg
23.1
28.8
32.8
11.3
EBITDA (%)
5.3
6.3
6.9
7.1
EPS (`)
6.0
9.8
15.6
19.1
P/E (x)
33.2
25.8
20.6
18.5
P/BV (x)
7.0
6.5
4.2
3.6
RoE (%)
20.5
26.1
25.4
21.1
RoIC (%)
16.6
24.6
27.6
28.3
Milan Desai
EV/Sales (x)
1.1
1.0
0.8
0.7
+91 22 3935 7800 Ext: 6846
EV/EBITDA (x)
21.1
15.7
12.2
10.4
Source: Company, Angel Research; Note: CMP as of February 4, 2016
Please refer to important disclosures at the end of this report
1
Blue Star | 3QFY2016 Result Update
Exhibit 1: 2QFY2016 performance highlights (Standalone)
Y/E March (` cr)
3QFY2016
3QFY2015
yoy chg (%)
2QFY2016
qoq chg (%)
9MFY16
9MFY15
% chg
Net Sales
686
596
15.1
717
(4.3)
2,311
2,075
11.4
Net raw material
472
400
18.2
503
(6.1)
1614
1413
14.2
(% of Sales)
68.9
67.1
175bp
70.2
(133)bp
69.9
68.1
175bp
Staff Costs
67
63
5.0
64
4.2
191
188
1.6
(% of Sales)
9.7
10.7
(94)bp
8.9
79bp
8.3
9.1
(79)bp
Other Expenses
119
124
(3.8)
123
(3.0)
385
369
4.2
(% of Sales)
17.4
20.8
(341)bp
17.1
24bp
16.6
17.8
(115)bp
Total Expenditure
658
587
12.1
690
(4.6)
2,190
1,971
11.1
Operating Profit
28
9
217.7
27
3.3
121
104
15.5
OPM
4.1
1.5
259bp
3.8
30bp
5.2
5.0
19bp
Interest
9
11
(13.9)
9
(2.8)
27
32
(17.0)
Depreciation
11
10
10.3
12
(1.1)
32
29
10.8
Other Income
1.4
2.1
(36.4)
2.0
(31.0)
4
7
(42.4)
Exceptional Item
(2)
18
(16)
(18)
4
PBT
7
8
(18.6)
(8)
(189.1)
48
54
12.6
(% of Sales)
1.0
1.4
(1.1)
2.1
2.6
Tax
2
2
(2)
10
7
(% of PBT)
30
25
25
21
14
Reported PAT
5
6
(23.8)
(6)
(182.9)
38
46
(17.9)
Extraordinary Item
2
(18)
16
18
(4)
Adjusted PAT
7
(12)
(156.1)
10
(32.6)
56
43
30.7
PATM
1.0
(2.0)
1.4
1.6
2.2
Source: Company, Angel Research
Exhibit 2: Actual vs. Angel Estimates (Standalone)
(`)
Actual
Estimate
% Variation
Net Sales
686
641
7.0
EBITDA
27.9
25.9
7.7
EBIDTA margin
4.1
4.0
3bp
Adjusted PAT
6.8
7.8
(14.0)
Source: Company, Angel Research
Top-line and margin ahead of expectations
Blue Star’s 3QFY2016 numbers have come in in-line with our estimates. The
standalone top-line for the quarter reported an 15.1% yoy increase to `686cr,
which is higher than our estimate of `641cr. The raw material cost as a
percentage of sales increased by 175bp yoy to 68.9% but the same was offset by a
94bp yoy and
341bp yoy decline in Employee and Other expenses as a
percentage of sales to
9.7% and
17.4%, respectively. The EBITDA margin
expanded by 259bp yoy to 4.1%, which is in-line with our estimate of 4.0%. There
was an exceptional loss of `2cr during the quarter due to bonus expenses for
earlier years pursuant to retrospective amendment in the statute. Adjusting for the
exceptional item, the net profit came in at `7cr, which is marginally below our
estimate of `8cr.
February 5, 2016
2
Blue Star | 3QFY2016 Result Update
Segment-wise performance
Exhibit 3: Segment-wise performance (Standalone)
Y/E March (` cr)
3QFY2016 3QFY2015 % chg (yoy) 2QFY2016 % chg (qoq)
Total Revenue
A) EMPPAC
439
361
21.5
459
(4.3)
B) Cooling Products
238
197
21.0
246
(3.2)
C) PEIS
9
38
(76.2)
12
(27.9)
Total
686
596
15.1
717
(4.3)
Less: Inter-Segmental Rev.
-
-
-
Net Sales
686
596
15.1
717
(4.3)
Segmental Profit
A) EMPPAC
26
3
785.5
26
(2.2)
B) Cooling Products
17
10
67.5
14
20.6
C) PEIS
2
7
(76.0)
2
(21.5)
Segmental Margin (%)
A) EMPPAC
5.8
0.8
505bp
5.7
12bp
B) Cooling Products
7.1
5.1
198bp
5.7
140bp
C) PEIS
18.7
18.5
17bp
17.2
153bp
Source: Company, Angel Research
EMPPAC margins contract: The segment’s revenue grew by 21.5% yoy to `439cr in
3QFY2016. The EBIT margin expanded by 505bp yoy to 5.8% for the quarter as
compared to 0.8% in 3QFY2015. The margins expanded on account of enhanced
billings, lower provisioning and improvement in cash-flows. The company was
unable to close the legacy jobs in the quarter on account of issues at customers’
ends.
Cooling Products segment’s strong run continues: The segment’s top-line grew by
21.0% yoy to `238cr. The RAC business once again has managed to outgrow the
industry; as per the Management, the market grew by ~10-12% during the
quarter while Blue Star grew by ~20%. The RAC market in general saw an
improvement on account of festival buying and aggressive promotions by
retailers/e-tailers. The EBIT margin for the quarter improved by 198bp yoy to
7.1%.
PEIS segment: The Professional Electronics and Industrial Systems (PEIS) segment’s
revenue decreased by 76.2% yoy to `9cr. Margins for the business declined by
17bp yoy to 18.7%. However, these numbers are not comparable on a yoy basis
as the PEIS business was transferred into Blue Star’s wholly owned subsidiary
effective April 01, 2015. There were some orders that were booked under the
standalone business which the company will continue to execute; the quantum of
such orders will decline gradually. On a combined basis, the segment declined by
~5.0% yoy to `36cr while the segment margin declined by 492bp yoy to 13.6%.
As per the Management, the decrease in demand due to dollar appreciation and
lower capex spends in the industrial segment caused the decline in the business.
February 5, 2016
3
Blue Star | 3QFY2016 Result Update
Conference Call Highlights
Carry Forward Order Book as on December 31, 2015 increased by 14% to
`1,605cr compared `1,412cr as at December 31, 2014. Of the total order
book, a majority is accounted by private companies while 20-25% is made up
by government and infra. The order inflow during the quarter grew by 62%
yoy to `431cr.
The Electro Mechanical Projects business was almost flat compared to the
previous year. The commercial segment gained some momentum in select
metros such as Chennai, Bengaluru, Delhi NCR & Hyderabad.
The RAC business maintained its strong run on account of festive season and
enhanced channel penetration. Share of sales from a given dealer is
increasing by 20% yoy in Northern India. There were 650 outlets added.
The company's market share in RAC is 10.5% and 12.5% for inverter ACs. In
the e-commerce space, it enjoys a market share of 10% (~5% of 4mn ACs are
sold through e-commerce).
Pressure on pricing for ACs is likely to ease in 4QFY2016. The demand for
RAC was also impacted owing to Tamil Nadu floods.
The company has closed down its Thane and Bharuch plants and is planning
to invest in setting up two modern, state-of-the-art factories at Jammu and Sri
City. The new plant at Jammu will have a CENVAT exemption for 10 years.
Total capex is estimated to be at `200cr spread over the coming three-four
years.
Investment Rationale
Improvement in macro scenario to support growth
The EMPPAC division of Blue Star contributed ~54% of total revenues in FY2015.
The division mainly caters to industrial/institution clients in sectors like IT/ITeS,
retail (including malls and multiplexes), healthcare, hospitality, infrastructure, etc.
The order execution and finalization has been witnessed to be sluggish in the
recent past, thereby affecting the segment. With slow recovery in various client
industries and improvement in the economic environment post interest rate cuts,
we expect the segment to recover and be a key contributor to the company’s
overall top-line.
Quality order execution to support EBITDA margin expansion
The company continues to be selective in terms of order booking which has hurt its
margins in the past. So far, the delay in execution of high-margin projects, coupled
with delayed closure of low margin jobs, has resulted in snail-paced expansion of
the EBITDA margin. The carry forward order book has been witnessing upward
movement over the past few quarters and with legacy jobs coming off the books,
most likely in 4QFY2016, we expect the segment’s profitability to improve from
here on.
February 5, 2016
4
Blue Star | 3QFY2016 Result Update
Cooling Products division to be the backbone
The superior performance of the division is mainly on the back of high growth seen
in the RAC segment which is consistently growing at 10% points faster than the
overall RAC market. The company has been able to leverage on its perception of
being a “Cooling Expert” and successfully grown its market share from ~7% levels
in FY2015to the present 10.5%. As a result of this growth, the Cooling Products
segment’s share as a percentage of total revenue has increased from 23.4% in
FY2009 to ~42% in FY2015 and the segment in recent times has been entailing
better profitability compared to the other major segment - EMMPAC. We expect the
division to be a key contributor as there is significant potential to capitalize on the
underpenetrated RAC market in India. Blue Star can add to its current market
share as it has good channel coverage and it has been selectively expanding the
channel network in tier 3, 4 and 5 cities.
Foray into newer products and focus on growing international
business
Blue Star has forayed into new areas like air purifiers and air coolers in FY2016.
As per Management estimates, the domestic air purifiers market is of ~`200cr,
which it expects to grow by 5x over the next five years. Further the Management
sounded confident that it can rely on its brand equity to successfully scale up the
air coolers business using its vast channel network.
Additionally, the company post its merger with Blue Star Infotech Ltd (BSIL) will be
using the cash influx to grow its international business. Apart from this, the
company has entered into a 51% joint venture with W. J. Towell & Co. LLC, Oman,
in the MEP contracting business. The company intends to scale up the business to
`500cr over the next few years.
February 5, 2016
5
Blue Star | 3QFY2016 Result Update
Financials
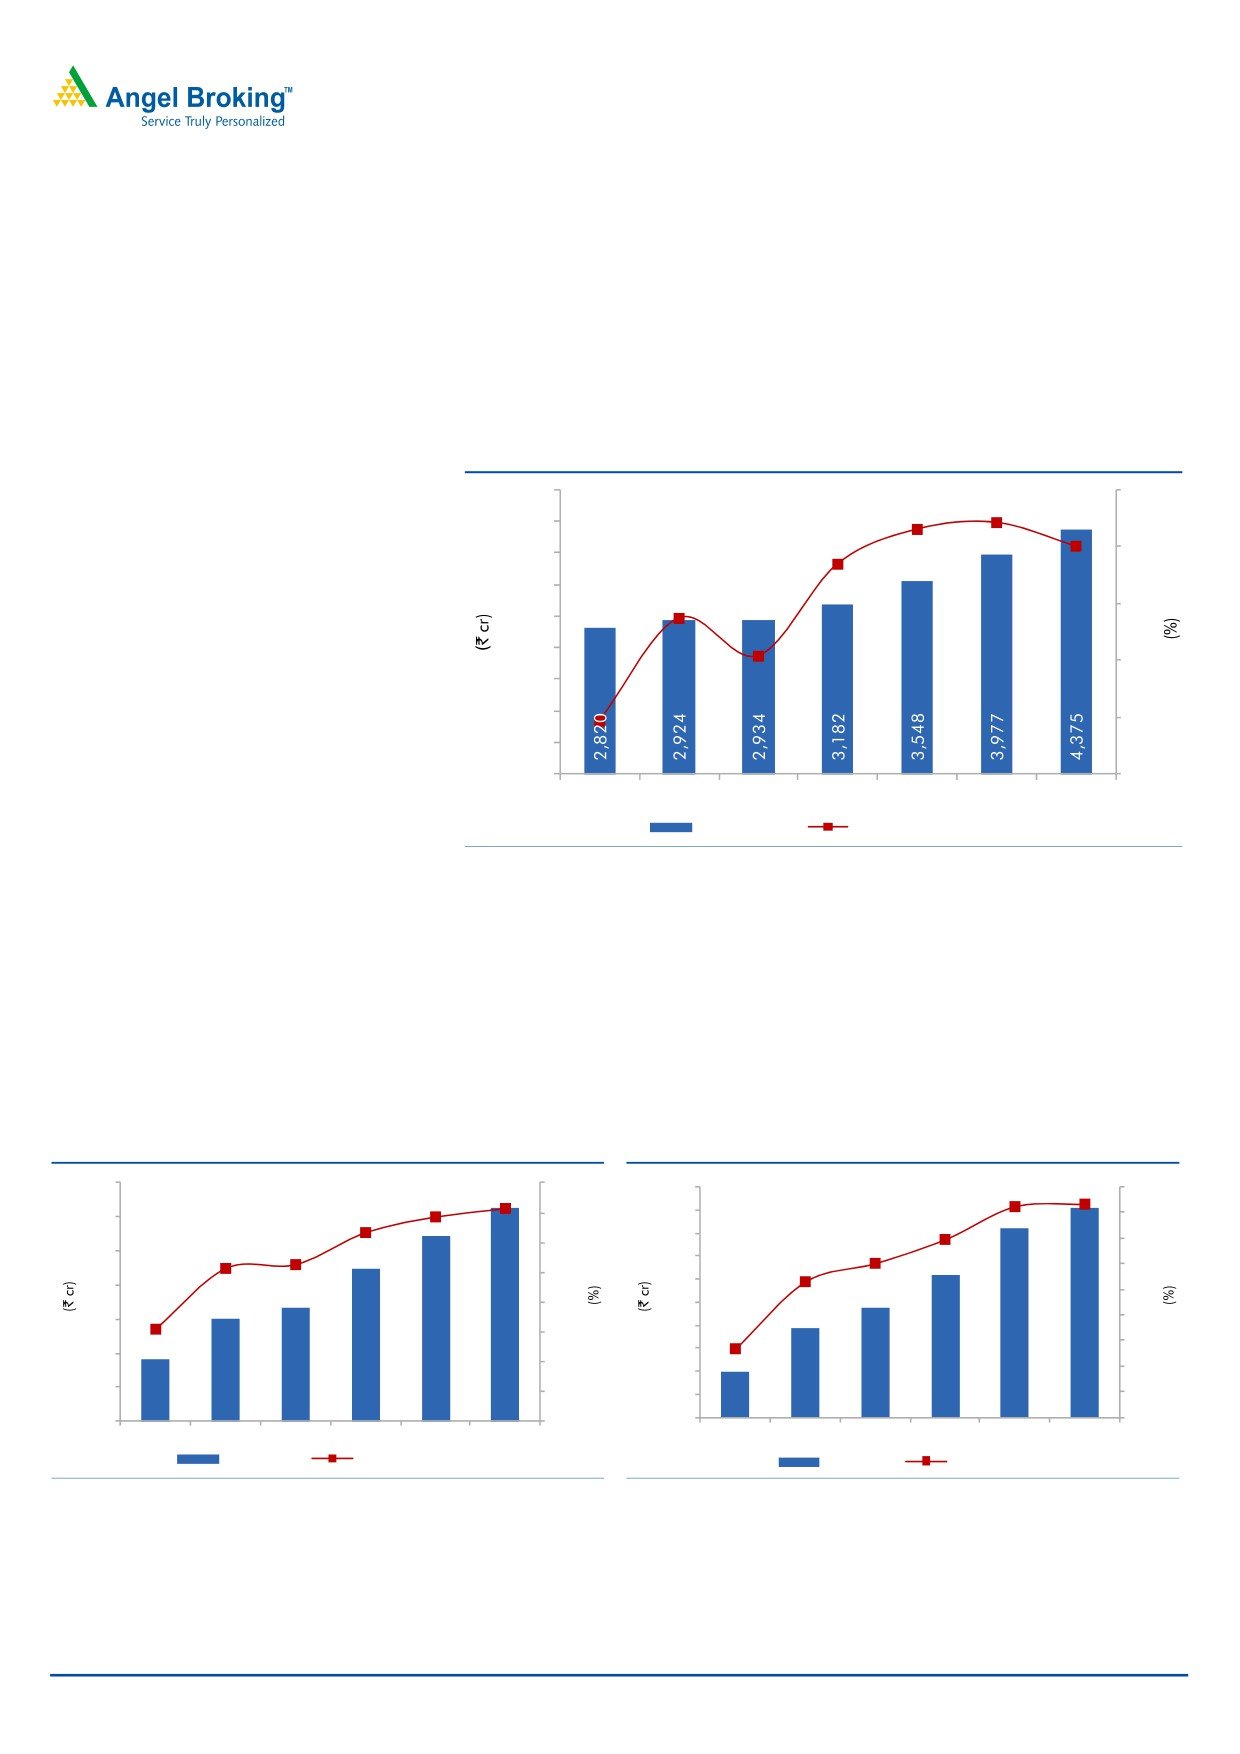
Improvement in revenue growth
We expect the revenue to grow at a CAGR of 11.2% over FY2015-18E to
`4,375cr. We believe that gradual recovery in macroeconomic conditions and
strong footing of its Cooling Products business would enable the company to post
such growth.
Exhibit 4: Revenue growth estimates
5,000
15.0
11.5
12.1
4,500
10
.0
8.4
10.0
4,000
3,500
3.7
5.0
3,000
2,500
0.4
-
2,000
1,500
(5.0)
(5.4)
1,000
500
(10.0)
FY2012
FY2013
FY2014
FY2015
FY2016E FY2017E FY2018E
Revenue (LHS)
Revenue growth (RHS)
Source: Company, Angel Research
EBITDA margin to improve
We expect the EMPPAC segment’s performance to improve mainly in anticipation
of a macroeconomic turnaround and with low/no margin orders coming off the
books this year. We expect the EBITDA margin to improve from 5.3% in FY2015 to
7.1% in FY2018E. Consequently, the net profit is expected to be at `182cr in
FY2018E.
Exhibit 5: EBITDA margin to improve
Exhibit 6: PAT expected to improve
350
8.0
4.1
4.2
200
4.5
7.1
7.0
180
4.0
300
3.5
6.9
160
3.5
6.3
6.0
3.0
250
140
5.3
3.0
5.1
5.0
120
200
2.6
2.5
4.0
100
150
2.0
80
3.1
3.0
1.5
60
1.3
100
2.0
1.0
40
50
1.0
20
0.5
90
150
167
225
273
312
39
78
96
123
164
182
-
-
-
-
FY2013
FY2014 FY2015 FY2016E FY2017E FY2018E
FY2013
FY2014 FY2015 FY2016E FY2017E FY2018E
EBITDA (LHS)
EBITDA margin (RHS)
PAT (LHS)
PAT margin (RHS)
Source: Company, Angel Research
Source: Company, Angel Research
February 5, 2016
6
Blue Star | 3QFY2016 Result Update
Outlook and valuation
We expect Blue Star to report a CAGR of 11.2% in its revenue over FY2015-18E to
`4,375cr. The EBITDA margin is expected to expand by 188bp over FY2015-17E
to 7.1% due to better margin orders. Consequently, the net profit is expected to be
at `182cr in FY2018E. Moreover, the proposed merger with Blue Star Infotech will
provide cash influx and thus strengthen the balance sheet. At the current market
price, the stock trades at 20.6x and 18.5x its FY2017E and FY2018E earnings
respectively and at 0.8x and 0.7x FY2017E and FY2018E EV/sales (while its close
peer Voltas trades at 1.5x its FY2017E EV/sales). At a target P/E multiple of 23.0x,
the implied FY2018E EV/sales multiple works out to 1.0x, which is comforting.
Hence we recommend a Buy on the stock.
Exhibit 7: One year forward EV/sales band
6,000
EV
0.3x
0.6x
0.9x
1.2x
5,000
4,000
3,000
2,000
1,000
-
Source: Company, Angel Research
Key concerns
Slowdown in investment cycle may impact the order inflow, thus impacting
revenue. It may also force the Management to compromise on its strategy of
avoiding low margin projects.
Any slowdown in consumer segments like IT/ITES, healthcare, hospitality and
infrastructure could impact the company’s growth.
Foreign exchange fluctuations have a direct impact on the profit of the
Cooling Products division since commercial refrigerators are imported. Further
depreciation in the local currency may impact the profits of Blue Star.
February 5, 2016
7
Blue Star | 3QFY2016 Result Update
Company Background
Blue Star is India's largest central air-conditioning company with a network of
32 offices, seven manufacturing facilities, over
2,000 dealers and around
2,500 employees. The company’s operations could be classified under three main
segments:
EMPPACS: This segment comprises central and packaged air-conditioning
(involving design, engineering, manufacturing, installation, commissioning and
support of large central air conditioning plants, packaged air conditioners and
ducted split air conditioners) as well as electrical projects and plumbing and fire
fighting projects. In addition, the company promotes after-sales service as a
business, by offering several value added services in the areas of upgrades and
enhancements, air management, water management, energy management and
LEED consultancy for Green Buildings.
Cooling Products: Blue Star offers a wide range of contemporary window and split
air conditioners. The company also manufactures and markets a comprehensive
range of commercial refrigeration products and services that cater to the industrial,
commercial and hospitality sectors.
PEIS: This division has been the exclusive distributor in India for many
internationally renowned manufacturers of hi-tech professional electronic
equipment and services, as well as industrial products and systems.
February 5, 2016
8
Blue Star | 3QFY2016 Result Update
Profit and loss statement (Consolidated)
Y/E March (` cr)
FY2014
FY2015
FY2016E
FY2017E
FY2018E
Total operating income
2,934
3,182
3,548
3,977
4,375
% chg
0.4
8.4
11.5
12.1
10.0
Net Raw Materials
2,087
2,214
2,453
2,756
3,049
Personnel
248
267
284
309
331
Other
450
533
586
639
684
Total Expenditure
2,784
3,015
3,323
3,704
4,063
EBITDA
150
167
225
273
312
% chg
(1.8)
8.3
10.2
11.5
9.7
(% of Net Sales)
5.1
5.3
6.3
6.9
7.1
Depreciation& Amortisation
38
43
46
50
57
EBIT
113
124
179
223
255
% chg
97.4
10.2
24.5
14.5
(% of Net Sales)
3.8
3.9
5.0
5.6
5.8
Interest (incl. forex loss)
54
49
39
33
30
Other Income
18
8
13
24
35
(% of Net Sales)
0.6
0.3
0.4
0.6
0.8
Exceptional Items
(0.1)
(41.4)
(35.0)
(15.0)
-
PBT
76
43
118
198
260
% chg
87.1
(44.0)
175.6
68.5
31.3
Tax
2
(8)
29
50
78
(% of PBT)
2.9
(18.5)
25.0
25.0
30.0
PAT (reported)
74
51
88
149
182
Extraordinary (Expense)/Inc.
0
41
35
15
-
Share of Profit of Associate
4
4
-
-
-
ADJ. PAT
78
96
123
164
182
% chg
98.6
23.1
28.8
32.8
11.3
(% of Net Sales)
2.6
3.0
3.5
4.1
4.2
Basic EPS (`)
8.6
10.6
13.7
17.2
19.1
Fully Diluted EPS (`)
8.6
10.6
13.7
17.2
19.1
% chg
198.6
123.1
128.8
125.3
111.3
February 5, 2016
9
Blue Star | 3QFY2016 Result Update
Balance sheet (Consolidated)
Y/E March (` cr)
FY2014
FY2015
FY2016E
FY2017E
FY2018E
SOURCES OF FUNDS
Equity Share Capital
18
18
18
19
19
Pref. Share Capital
18
-
-
-
-
Reserves& Surplus
443
438
472
780
905
Shareholders’ Funds
479
456
490
799
924
Total Loans
494
398
370
314
283
Deferred Tax Liability
(1)
(17)
(17)
(17)
(17)
Other Long Term Liabilities
4
7
7
7
7
Total Liabilities
976
843
850
1,103
1,197
APPLICATION OF FUNDS
Gross Block
514
549
598
670
784
Less: Acc. Depreciation
269
304
350
400
457
Net Block
245
245
249
271
327
Capital Work-in-Progress
15
22
18
90
25
Goodwill
11
11
9
8
6
Investments
33
36
36
2
2
Long term Loans & adv
120
139
149
167
184
Current Assets
1,911
1,704
1,891
2,241
2,489
Cash
68
44
19
160
204
Loans & Advances
130
116
129
145
159
Inventory
466
479
518
563
616
Debtors
833
795
923
1,035
1,139
Other current assets
414
270
301
338
371
Current liabilities
1,359
1,315
1,502
1,675
1,837
Net Current Assets
552
389
388
566
653
Misc. Exp. not written off
-
-
-
-
-
Total Assets
976
843
850
1,103
1,197
February 5, 2016
10
Blue Star | 3QFY2016 Result Update
Cash flow statement (Consolidated)
Y/E March (` cr)
FY2014 FY2015 FY2016E FY2017E FY2018E
Profit before tax
76
43
118
198
260
Depreciation
38
43
46
50
57
Change in Working Capital
(47)
139
(25)
(36)
(43)
Other income
(18)
(8)
(13)
(24)
(35)
Direct taxes paid
(2)
(7)
(29)
(50)
(78)
Others
37
28
-
-
-
Cash Flow from Operations
83
237
96
138
162
(Inc.)/Dec. in Fixed Assets
(71)
(43)
(43)
(142)
(48)
(Inc.)/Dec. in Investments
(6)
(3)
-
34
-
(Inc.)/Dec. In L.T loans and adv
(8)
(20)
(10)
(18)
(17)
Other income
18
8
13
24
35
Others
62
(14)
-
-
-
Cash Flow from Investing
(6)
(71)
(39)
(102)
(29)
Issue of Equity
18
(18)
0
1
-
Inc./(Dec.) in loans
73
(97)
(28)
(55)
(31)
(Dec.)/Inc. in long term prov.
(1)
2
-
-
-
Forex diff. on cash equivalent
-
-
-
-
-
Dividend Paid (Incl. Tax)
(42)
(54)
(54)
(57)
(57)
Others
(74)
(23)
-
217
-
Cash Flow from Financing
(26)
(190)
(82)
105
(89)
Inc./(Dec.) in Cash
52
(24)
(25)
142
43
Opening Cash balances
17
68
44
19
160
Closing Cash balances
68
44
19
160
204
February 5, 2016
11
Blue Star | 3QFY2016 Result Update
Key ratios
Y/E March
FY2014
FY2015
FY2016E
FY2017E
FY2018E
Valuation Ratio (x)
P/E (on FDEPS)
40.9
33.2
25.8
20.6
18.5
P/CEPS
27.5
22.9
18.8
15.8
14.1
P/BV
6.6
7.0
6.5
4.2
3.6
Dividend yield (%)
1.1
1.4
1.4
1.4
1.4
EV/Sales
1.2
1.1
1.0
0.8
0.7
EV/EBITDA
23.9
21.1
15.7
12.2
10.4
EV / Total Assets
3.7
4.2
4.2
3.0
2.7
Per Share Data (`)
EPS (Basic)
8.6
10.6
13.7
17.2
19.1
EPS (fully diluted)
8.6
10.6
13.7
17.2
19.1
Cash EPS
12.8
15.4
18.8
22.4
25.1
DPS
4.0
5.0
5.0
5.0
5.0
Book Value
53.2
50.7
54.4
83.8
96.9
Returns (%)
ROCE (Pre-tax)
12.5
13.6
21.1
22.8
22.2
Angel ROIC (Pre-tax)
14.6
16.6
24.6
27.6
28.3
ROE
17.7
20.5
26.1
25.4
21.1
Turnover ratios (x)
Asset Turnover (Gross Block)
6.1
6.0
6.2
6.3
6.0
Inventory / Sales (days)
61
54
51
50
49
Receivables (days)
104
93
95
95
95
Payables (days)
176
162
165
165
165
WC cycle (ex-cash) (days)
57
47
37
36
36
Solvency ratios (x)
Net debt to equity
0.9
0.8
0.7
0.4
0.1
Net debt to EBITDA
2.6
1.9
1.4
0.6
0.2
Interest Coverage (EBIT / Int.)
2.1
2.6
4.5
6.7
8.5
February 5, 2016
12
Blue Star | 3QFY2016 Result Update
Research Team Tel: 022 - 39357800
DISCLAIMER
Angel Broking Private Limited (hereinafter referred to as “Angel”) is a registered Member of National Stock Exchange of India Limited,
Bombay Stock Exchange Limited and Metropolitan Stock Exchange of India Limited. It is also registered as a Depository Participant with
CDSL and Portfolio Manager with SEBI. It also has registration with AMFI as a Mutual Fund Distributor. Angel Broking Private Limited is
a registered entity with SEBI for Research Analyst in terms of SEBI (Research Analyst) Regulations, 2014 vide registration number
INH000000164. Angel or its associates has not been debarred/ suspended by SEBI or any other regulatory authority for accessing
/dealing in securities Market. Angel or its associates including its relatives/analyst do not hold any financial interest/beneficial
ownership of more than 1% in the company covered by Analyst. Angel or its associates/analyst has not received any compensation /
managed or co-managed public offering of securities of the company covered by Analyst during the past twelve months. Angel/analyst
has not served as an officer, director or employee of company covered by Analyst and has not been engaged in market making activity
of the company covered by Analyst.
This document is solely for the personal information of the recipient, and must not be singularly used as the basis of any investment
decision. Nothing in this document should be construed as investment or financial advice. Each recipient of this document should
make such investigations as they deem necessary to arrive at an independent evaluation of an investment in the securities of the
companies referred to in this document (including the merits and risks involved), and should consult their own advisors to determine
the merits and risks of such an investment.
Reports based on technical and derivative analysis center on studying charts of a stock's price movement, outstanding positions and
trading volume, as opposed to focusing on a company's fundamentals and, as such, may not match with a report on a company's
fundamentals.
The information in this document has been printed on the basis of publicly available information, internal data and other reliable
sources believed to be true, but we do not represent that it is accurate or complete and it should not be relied on as such, as this
document is for general guidance only. Angel Broking Pvt. Limited or any of its affiliates/ group companies shall not be in any way
responsible for any loss or damage that may arise to any person from any inadvertent error in the information contained in this report.
Angel Broking Pvt. Limited has not independently verified all the information contained within this document. Accordingly, we cannot
testify, nor make any representation or warranty, express or implied, to the accuracy, contents or data contained within this document.
While Angel Broking Pvt. Limited endeavors to update on a reasonable basis the information discussed in this material, there may be
regulatory, compliance, or other reasons that prevent us from doing so.
This document is being supplied to you solely for your information, and its contents, information or data may not be reproduced,
redistributed or passed on, directly or indirectly.
Neither Angel Broking Pvt. Limited, nor its directors, employees or affiliates shall be liable for any loss or damage that may arise from
or in connection with the use of this information.
Note: Please refer to the important ‘Stock Holding Disclosure' report on the Angel website (Research Section). Also, please refer to the
latest update on respective stocks for the disclosure status in respect of those stocks. Angel Broking Pvt. Limited and its affiliates may
have investment positions in the stocks recommended in this report.
Disclosure of Interest Statement
Blue Star
1. Analyst ownership of the stock
No
2. Angel and its Group companies ownership of the stock
No
3. Angel and its Group companies' Directors ownership of the stock
No
4. Broking relationship with company covered
No
Note: We have not considered any Exposure below ` 1 lakh for Angel, its Group companies and Directors
Ratings (Based on expected returns
Buy (> 15%)
Accumulate (5% to 15%)
Neutral (-5 to 5%)
over 12 months investment period):
Reduce (-5% to -15%)
Sell (< -15)
February 5, 2016
13