2QFY2016 Result Update | Cons. Durables
November 3, 2015
Blue Star
NEUTRAL
CMP
`380
Performance Highlights
Target Price
-
Y/E March (` cr)
2QFY2016 2QFY2015
% chg (yoy) 1QFY2016
% chg (qoq)
Investment Period
-
Net Sales
717
642
11.6
909
(21.1)
EBITDA
27
26
3.9
66
(58.9)
Stock Info
EBITDA margin (%)
3.8
4.0
(28)bp
7.2
(347)bp
PAT
7
9
(24.3)
39
(82.5)
Sector
Cons. Durable
Source: Company, Angel Research (Standalone)
Market Cap (` cr)
3,418
Net Debt
317
Blue Star reported an in-line set of numbers for 2QFY2016, posting an 11.6% yoy
Beta
0.7
increase in top-line to `717cr. On the operational front, net raw material cost as
52 Week High / Low
395 / 274
a percentage of sales increased by 330bp yoy to 70.2%. However, this was offset
Avg. Daily Volume
12,053
by a 102bp yoy and 199bp yoy decline in Employee and Other expenses to 8.9%
Face Value (`)
2
and 17.1% of sales, respectively. The EBITDA margin for the quarter declined by
BSE Sensex
26,559
28bp yoy to 3.8%. On account of higher depreciation and after adjusting for
Nifty
8,051
exceptional items (VRS related expenses of `13cr), the net profit declined by
Reuters Code
BLUS.BO
24.3% yoy to `7cr.
Bloomberg Code
BLSTR IN
Improvement in macro scenario to support growth: The Cooling
Products division has been the key performer for the company and is expected to
Shareholding Pattern (%)
carry the baton till the Electro Mechanical Projects and Packaged Air-conditioning
Promoters
39.5
Systems (EMPPAC) division recovers on the back of an expected improvement in
MF / Banks / Indian Fls
21.1
the macro scenario. Slow order finalization and execution has impacted the
EMPPAC division’s performance, which however is likely to rebound as the market
FII / NRIs / OCBs
6.8
condition improves. The company has been brisk in adding orders after clearing
Indian Public / Others
32.7
out legacy orders. As for the Cooling Products business, the company has been
growing at a rapid pace in the room air conditioners (RAC) segment and thereby
enhancing its market share. The company expects its market share to increase to
Abs.(%)
3m 1yr 3yr
10.5% from the current 10.0%, in the near term.
Sensex
(5.5)
(4.7)
41.6
Outlook and valuation: We expect Blue Star to report a CAGR of 14.3% in
BLUESTAR
1.1
12.2
88.0
its revenue over FY2015-17E to `4,157cr. The EBITDA margin is expected to
expand by 256bp over FY2015-17E to 6.0% due to better margin orders.
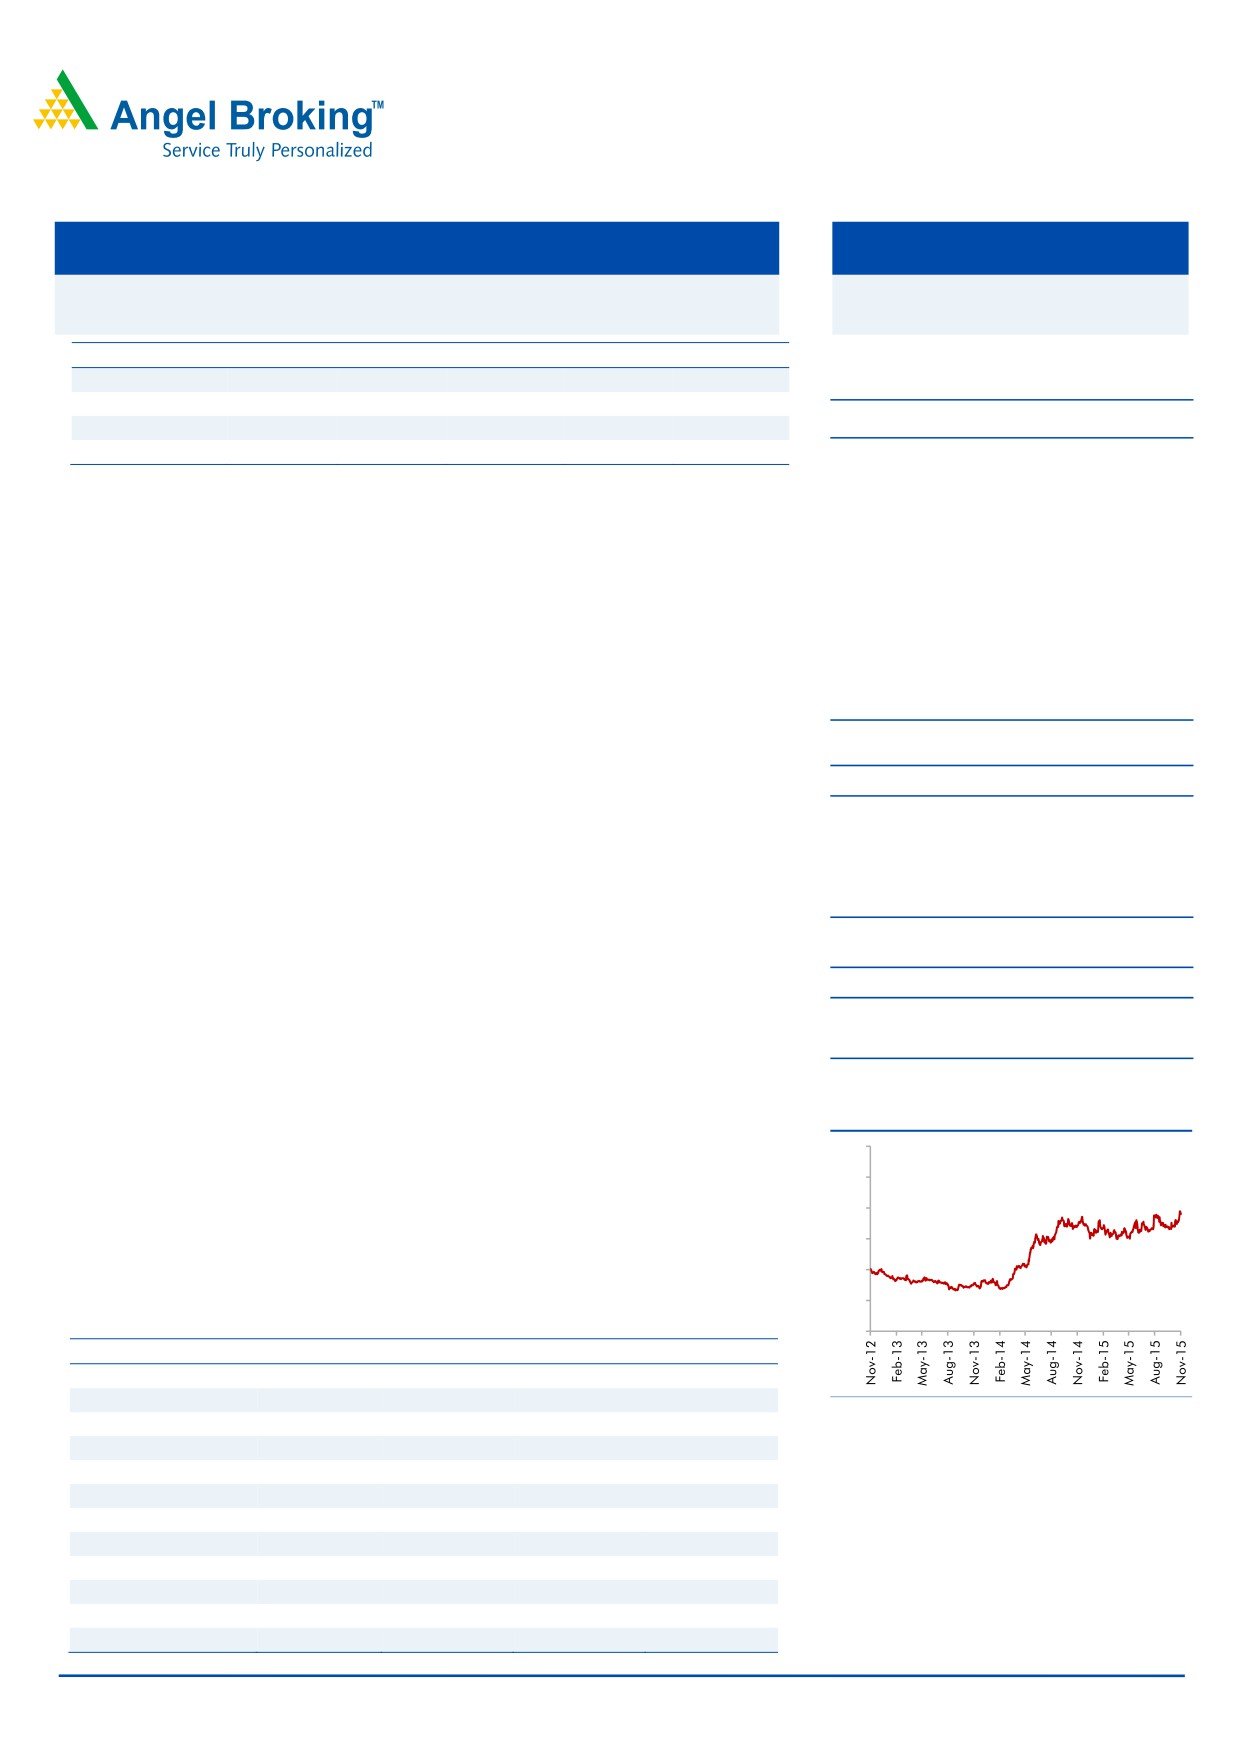
3 Year Price Chart
Consequently, the net profit is expected to be at `130cr in FY2017E as compared
600
to an adjusted net profit of `42cr in FY2015. At the current market price, the stock
is trading at EV/sales of 0.9x for FY2017E and 26.3x its FY2017 earnings. We
500
have not accounted for the merger of Blue Star Infotech into the company as the
400
same is subject to respective shareholders’ and High Court’s approval and as we
300
await more information about the deal from the company. Currently we have a
200
Neutral rating on the stock.
100
Key financials (Consolidated)
0
Y/E March (` cr)
FY2014
FY2015
FY2016E
FY2017E
Net Sales
2,934
3,182
3,624
4,157
% chg
0.4
8.4
13.9
14.7
Net Profit
66
42
87
130
% chg
68.3
(35.6)
104.2
50.3
EBITDA (%)
4.6
3.4
5.3
6.0
EPS (`)
8.2
6.0
8.2
14.5
P/E (x)
51.9
80.6
39.5
26.3
P/BV (x)
7.1
7.5
7.2
6.2
RoE (%)
15.0
9.1
18.6
25.4
RoIC (%)
12.4
8.8
19.9
25.1
Milan Desai
EV/Sales (x)
1.3
1.2
1.0
0.9
+91 22 3935 7800 Ext: 6846
EV/EBITDA (x)
28.5
34.3
19.7
15.0
Source: Company, Angel Research; Note: CMP as of November 02, 2015
Please refer to important disclosures at the end of this report
1
Blue Star | 2QFY2016 Result Update
Exhibit 1: 2QFY2016 performance highlights
Y/E March (` cr)
2QFY2016
2QFY2015
yoy chg (%)
1QFY2016
qoq chg (%)
1HFY16
1HFY15
% chg
Net Sales
717
642
11.6
909
(21.1)
1,625
1,480
9.8
Net raw material
503
430
17.1
639
(21.3)
1142
1014
12.7
(% of Sales)
70.2
66.9
70.4
70.3
68.5
Staff Costs
64
64
0.1
61
5.3
125
125
(0.1)
(% of Sales)
8.9
9.9
6.7
7.7
8.4
Other Expenses
123
123
(0.0)
143
(14.1)
266
260
2.0
(% of Sales)
17.1
19.1
15.7
16.3
17.6
Total Expenditure
690
616
11.9
843
(18.2)
1,533
1,399
9.6
Operating Profit
27
26
3.9
66
(58.9)
93
81
14.5
OPM
3.8
4.0
7.2
5.7
5.5
Interest
9
11
(11.9)
8
12.3
18
22
(18.6)
Depreciation
12
9
26.4
9
27.4
21
19
11.1
Other Income
2
3
(29.1)
0
347.7
2
4
(45.2)
Exceptional Item
(16)
-
-
(16)
-
PBT
(8)
9
(184.7)
49
(115.7)
41
45
12.6
(% of Sales)
(1.1)
1.4
5.4
2.5
3.1
Tax
(2)
0
10
8
5
(% of PBT)
25
0
20
19
11
Reported PAT
(6)
9
(164.0)
39
(114.8)
33
40
(17.0)
Extraordinary Item
13
-
-
13
0
Adjusted PAT
7
9
(24.3)
39
46
40
14.6
PATM
1.0
1.4
4.3
2.8
2.7
Source: Company, Angel Research
Exhibit 2: Actual vs. Angel Estimates
(` cr)
Actual
Estimate
% Variation
Net Sales
717
714
0.4
EBITDA
27
23.3
15.7
EBIDTA margin
3.8
3.3
50bp
Adjusted PAT
7
4
53.7
Source: Company, Angel Research
Top-line improves, margins disappoint
For 2QFY2016, Blue Star reported numbers that were broadly in line with our
estimates. The standalone top-line for the quarter reported an 11.6% yoy increase
to `717cr. This is in-line with our estimate of `714cr. The raw material cost as a
percentage of sales increased by 330bp yoy to 70.2% but this was offset by a
102bp yoy and 199bp yoy decline in Employee and Other expenses to 8.9% and
17.1% of sales, respectively. The EBITDA margin contracted by 28bp yoy to 3.8%,
but still, is higher than our estimate of 3.3%. The raw cost increased on account of
i) Rupee depreciation, ii) excess RAC inventory build-up and iii) change in mix in
the service business with a higher contribution from the relatively lower margin
segments. On account of higher depreciation and after adjusting for exceptional
items (VRS related expenses of `13cr), the net profit declined by 24.3% yoy to `7cr.
Still, the net profit has come in higher than our estimate of `4cr.
November 3, 2015
2
Blue Star | 2QFY2016 Result Update
Segment-wise performance
Exhibit 3: Segment-wise performance (Standalone)
Y/E March (` cr)
2QFY2016 2QFY2015 % chg (yoy) 1QFY2016 % chg (qoq)
Total Revenue
A) EMPPAC
459
399
14.8
327
40.2
B) Cooling Products
246
206
19.1
556
(55.9)
C) PEIS
12
37
(66.0)
25
(50.7)
Total
717
642
11.6
909
(21.1)
Less: Inter-Segmental Rev.
-
-
-
Net Sales
717
642
11.6
909
(21.1)
Segmental Profit
A) EMPPAC
26
29
(9.0)
9
199.9
B) Cooling Products
14
14
(0.1)
79
(82.3)
C) PEIS
2
8
(74.4)
5
(56.4)
Segmental Margin (%)
A) EMPPAC
5.7
7.2
(150)bp
2.7
305bp
B) Cooling Products
5.7
6.8
(110)bp
14.2
(850)bp
C) PEIS
17.2
22.8
(566)bp
19.4
(224)bp
Source: Company, Angel Research
EMPPAC margins contract: The segment’s revenue (accounting for 64% of total
revenue) grew by 14.8% yoy to `459cr in 2QFY2016. The EBIT margin witnessed a
decline of 150bp yoy to 5.7% for the quarter as compared to 7.2% in 2QFY2015
on account of slow project execution, which in turn slowed down the pace of
billing. There has been almost no movement in the closure of legacy jobs over the
past quarter, which stood at ~`30cr spread across 20-25 jobs.
Cooling Products segment’s strong run continues: Despite 2Q traditionally tending
to be a lean quarter for the segment, the segment’s top-line grew by 19.1% yoy to
`246cr. The segment once again has managed to outgrow the industry, which as
per Management has grown by ~9.0% in value terms during the quarter. The EBIT
margin for the quarter declined by 110bp yoy to 5.7% as negative currency
movement impacted raw material cost, and lower realization owing to excess
inventory buildup in the industry put pressure on the pricing.
The Cooling Products segment continues to be strong while the EMPAAC segment
continues to weather the storm. The company has significantly increased its
distribution network to 2,250 dealers as compared to 1,950 dealers in the same
period last year to further grow its business.
Top-line disappoints but margin improves for PEIS segment: The Professional
Electronics and Industrial Systems (PEIS) segment’s revenue decreased by 66.6%
yoy to `12cr. Margins for the business declined by 566bp yoy to 17.2%. However,
these numbers are not comparable on a yoy basis as the PEIS business was
transferred into Blue Star’s wholly owned subsidiary effective April 01, 2015. There
were some orders that were booked under the standalone business which the
company will continue to execute. The quantum of such orders will decline, going
forward as all the new orders are now being booked with the subsidiary.
November 3, 2015
3
Blue Star | 2QFY2016 Result Update
Conference Call Highlights
The EBITDA margin decline was owing to drop in gross margins across all
segments mainly due to combination of negative currency movement, excess
inventory buildup that put pressure on realizations, and change in business
mix in the service business. The expectations are that the currency movement
will be more or less stable, while the inventory issue has been resolved and the
mix should also get regularized by the end of the year.
The EMPPAC business’ performance was impacted by sluggish execution
along with a higher cost structure. The improvement in the top-line is on the
back of the company hitting the market more proactively after being vigilant in
the recent past. The recently launched inverter based VRF - IV Plus, is receiving
a good response from the market. The company is planning towards
introducing Inverter VRF IV + in a select export markets as well. Inverter VRFs
are more profitable than any of the company’s products businesses. The
overall market for the EMPPAC segment is yet to revive.
Order inflow has improved for Segment I- which has grown by 67% yoy to
`561cr. The segment’s order book stood at `1,55cr, representing a growth of
7% on yoy basis. The cash flow situation has improved for the market in
general. The drop in interest rates should aid order inflow.
In the Electro Mechanical Projects business, there was improvement in order
inflow from select markets in segments such as healthcare, malls, power and
metro. Integrated MEP gained more traction in segments like hospitality,
healthcare and malls. The new business margins have returned to north of
12% with favorable terms and conditions.
The company’s market share in the RAC business has improved to 10.0%. The
company is targeting a market share of 10.5% in the near term and ~12%
over the next 2-3 years. Blue Star’s Inverter ACs are growing faster than the
market. The Management pointed that going forward, inverter ACs will
account for close to 35-50% of the total RACs, citing examples of China and
Japan. The share of Inverter ACs for the industry is 10% of total sales while
that of Blue Star is at 15% of its total AC sales.
PEIS - The negative currency movement impacted the budgets of its clients
(institutions/government/PSUs; as they are in USD terms). With stable currency
and revised budgets, the business should improve. The inquiry levels have
been stronger across clients and the company expects things to return to
normalcy by 4QFY2016.
Merger with Blue Star Infotech Ltd
Blue Star group entity Blue Star Infotech Ltd (BSIL) announced the sale of its IT
business to Infogain Inc on September 29, 2015. As per the deal the aggregate
consideration for the sale of the IT business of BSIL and its subsidiaries in UK, USA
and Singapore is `181cr. BSIL will retain its real estate business, a certain amount
of cash, and tax receivables which have a fair value of `97cr. Following the sale,
which is subject to shareholders’ approval, BSIL is proposed to be merged with
Blue Star Ltd with effect from April 1, 2015. The cash and cash equivalents portion
amounts to `25cr and the market value of the real estate property is `70cr which is
November 3, 2015
4
Blue Star | 2QFY2016 Result Update
leased out to 3rd party generating annual rental of `6cr. The proceeds from the
BSIL IT division sale will be used to set up a factory for RACs - A) Phase One -
investment of `75cr, work for which will start in CY2016 and be operational by
end of FY2017 and Phase Two - investment of `75cr starting in CY2017 and will
be operational by end of FY2018. B) Investment in Services business, marketing
expenses and building up its international business.
As per the scheme, shareholders of BSIL will be issued equity shares in Blue Star as
per the share swap ratio of 7 shares of face value of `2 each in Blue Star Ltd for
10 shares of face value of `10 each held in BSIL.
Note: We have not accounted for the merger of BSIL with Blue Star as the same is
contingent upon approval from respective shareholders and the High Court.
Although the top-line is expected to remain unaffected, there will be equity dilution
of ~5-6% post the merger. We will incorporate the changes as further details are
revealed and when the merger materializes.
Joint Venture in MEP contracting business
The company has entered into a Joint Venture in MEP contracting business with W.
J. Towell & Co. LLC, Oman, by acquiring 51% stake in Oman Electro Mechanical
Contracting Co LLC (OEMC), which is 100% step down subsidiary of W. J. Towell.
Joint venture entity Blue Star Oman Electro-Mechanical Company LLC will offer
Mechanical, Electrical and Plumbing (MEP) contracting services in Oman. OEMC is
a MEP contracting company. Blue star will take over management aspect in the JV
which has an order book of `150cr. Blue Star intends to scale the business up to
`500cr over the next few years. This move is more in line with the company’s plan
to grow the MEP business along with the products business internationally.
November 3, 2015
5
Blue Star | 2QFY2016 Result Update
Investment Rationale
Improvement in macro scenario to support growth
The EMPPAC division of Blue Star contributed ~54% of total revenues in FY2015.
The division mainly caters to industrial/institution clients like IT/ITeS, retail
(including malls and multiplexes), healthcare, hospitality, infrastructure, etc. The
order execution and finalization has remained sluggish, thereby affecting the
segment. With slow recovery in various client industries and improvement in
environment post interest rate cuts, we expect the segment to recover and be a key
contributor to the company’s overall top-line.
Quality order execution to support EBITDA margin expansion
The company continues to be selective in terms of order booking which has hurt its
margins in the past. So far, the delay in execution of high-margin projects, coupled
with delayed closure of low margin jobs, has resulted in snail-paced expansion of
the EBITDA margin. The order book as on 30 September 2015 stands at `1,604cr
with almost no movement in the legacy jobs over the past quarter which stood at
~`30cr spread across 20-25 jobs. The Management is hopeful about clearing
them out in 2HFY2016.
Cooling Products division to be the backbone
The superior performance of the division is mainly on the back of the high growth
seen in the RAC segment which is growing faster than the overall RAC market. The
Cooling Products segment’s share as a percentage of total revenue has increased
from 23.4% in FY2009 to ~42% in FY2015. We expect the division to be a key
contributor as there is significant potential to capitalize on the underpenetrated
RAC market in India. Blue Star can add to its current market share as it has good
channel coverage and it has been selectively expanding the channel network in tier
3, 4 and 5 cities.
November 3, 2015
6
Blue Star | 2QFY2016 Result Update
Financials
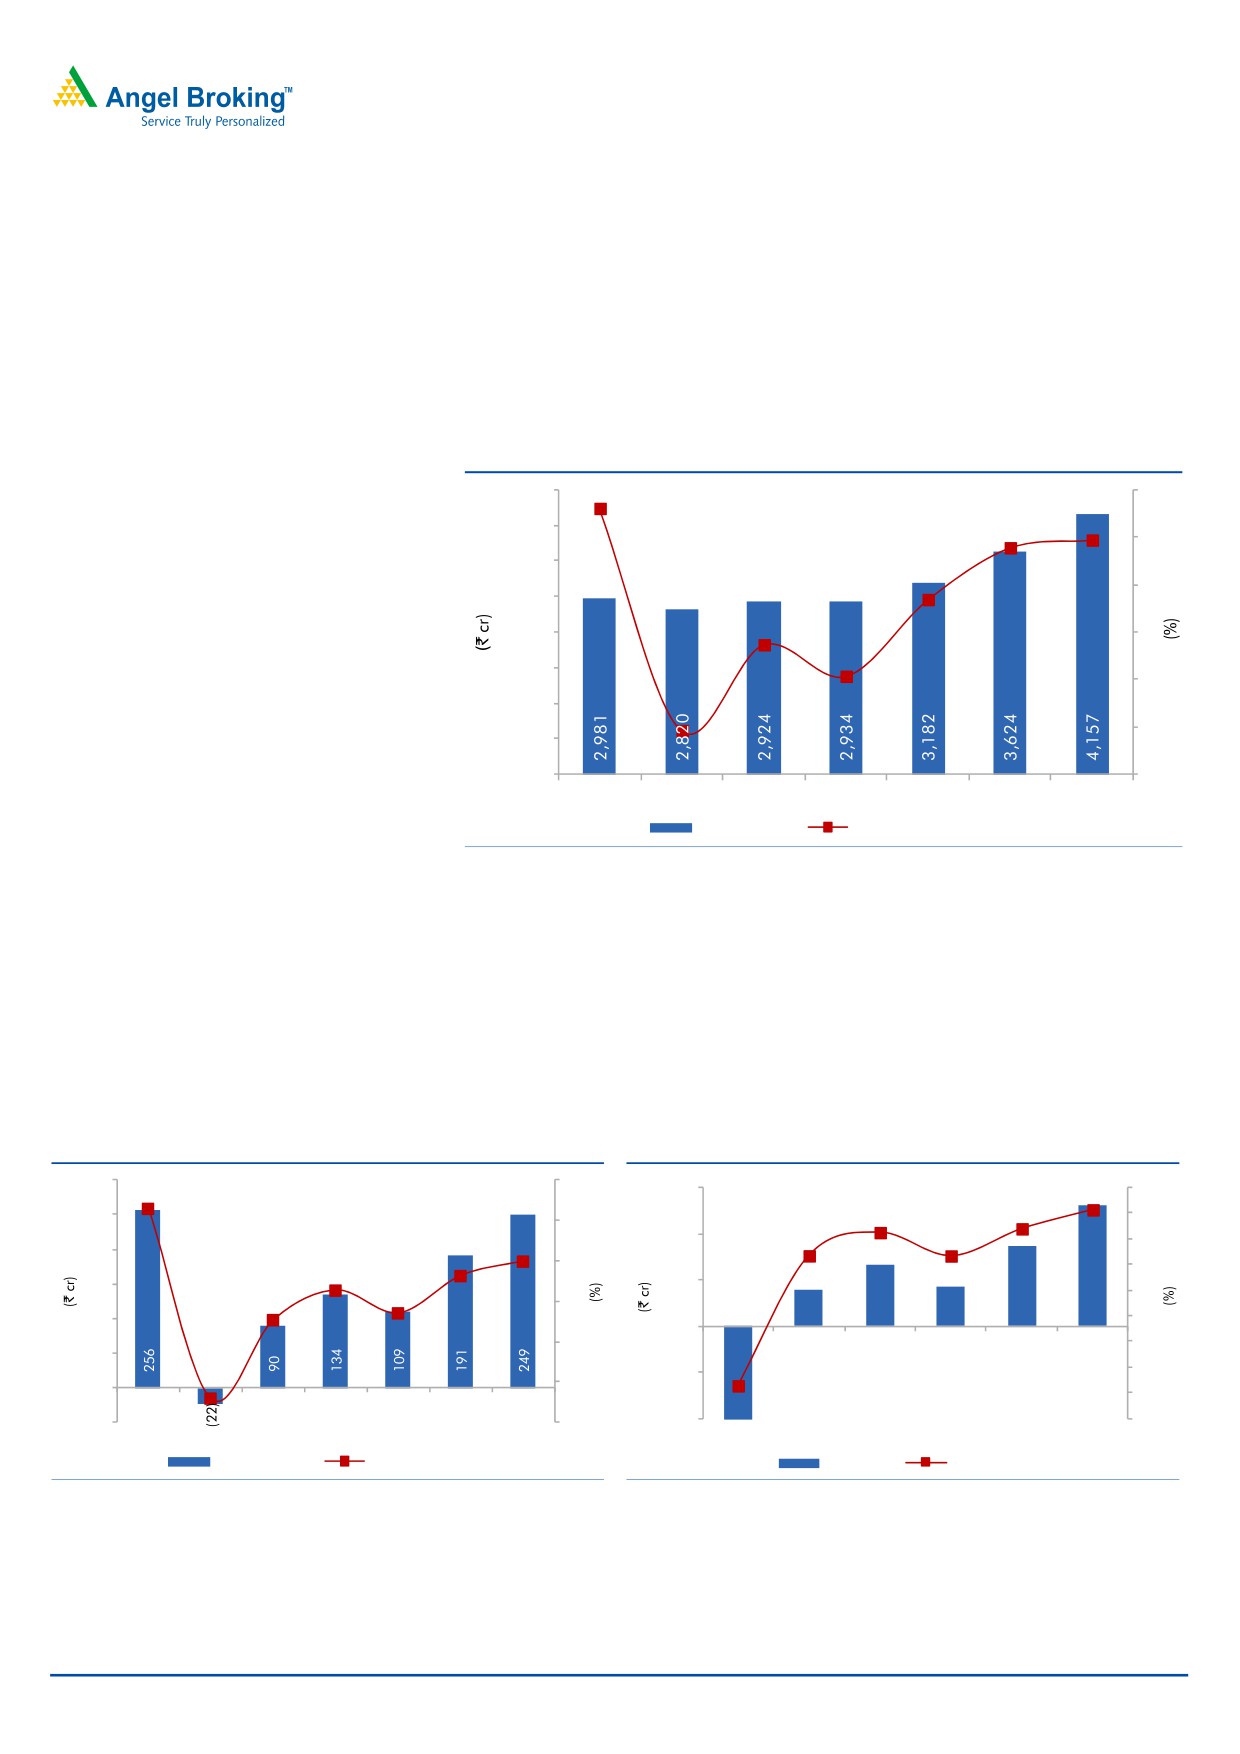
Improvement in revenue growth
We expect the revenue to grow gradually at 14.3% CAGR over FY2015-17E to
`4,157cr. We believe with gradual recovery in macro-economic conditions and
strong footing of its Cooling Products business, revenue would grow by 13.9% and
14.7% in FY2016E and FY2017E respectively.
Exhibit 4: Revenue growth estimates
4,500
20
18.0
4,000
13.9
14.715
3,500
8.4
10
3,000
5
2,500
3.7
0.4
2,000
0
1,500
(5.4)
(5)
1,000
500
(10)
FY2011
FY2012
FY2013
FY2014
FY2015
FY2016E FY2017E
Revenue (LHS)
Revenue growth (RHS)
Source: Company, Angel Research
EBITDA margin to improve
We expect the EMPPAC segment’s performance to improve mainly in anticipation
of a macroeconomic turnaround and with low/no margin orders coming off the
books this year. We expect the EBITDA margin to improve from 3.4% in FY2015 to
5.3% in FY2016E and 6.0% in FY2017E. Consequently, the net profit is expected
to be at `87cr in FY2016E and `130cr in FY2017E.
Exhibit 5: EBITDA margin to improve
Exhibit 6: PAT expected to improve
300
10
150
3.1
4
8.6
2.4
250
2.2
3
8
100
1.3
2
200
6.0
6
1.3
1
5.3
50
150
4.6
0
4
39
66
42
87
130
3.4
(1)
100
3.1
0
2
(105)
(2)
50
(3)
(50)
0
0
(3.7)
(4)
(0.8)
-50
(2)
(100)
(5)
FY2011
FY2012
FY2013
FY2014 FY2015 FY2016E FY2017E
FY2012
FY2013
FY2014 FY2015 FY2016E FY2017E
EBITDA (LHS)
EBITDA margin (RHS)
PAT (LHS)
PAT margin (RHS)
Source: Company, Angel Research
Source: Company, Angel Research
November 3, 2015
7
Blue Star | 2QFY2016 Result Update
Exhibit 7: Relative valuation
Net Sales
OPM
PAT
EPS
ROE
P/E
P/BV
EV/EBITDA
EV/Sales
Year end
(` cr)
(%)
(` cr)
(`)
(%)
(x)
(x)
(x)
(x)
Blue Star*
FY2017E
4,157
6.0
130
14.5
25.4
26.3
6.2
15.0
0.9
Voltas
FY2017E
6,413
8.9
463
14.1
18.0
20.2
3.4
15.4
1.3
Source: Angel Research, Bloomberg
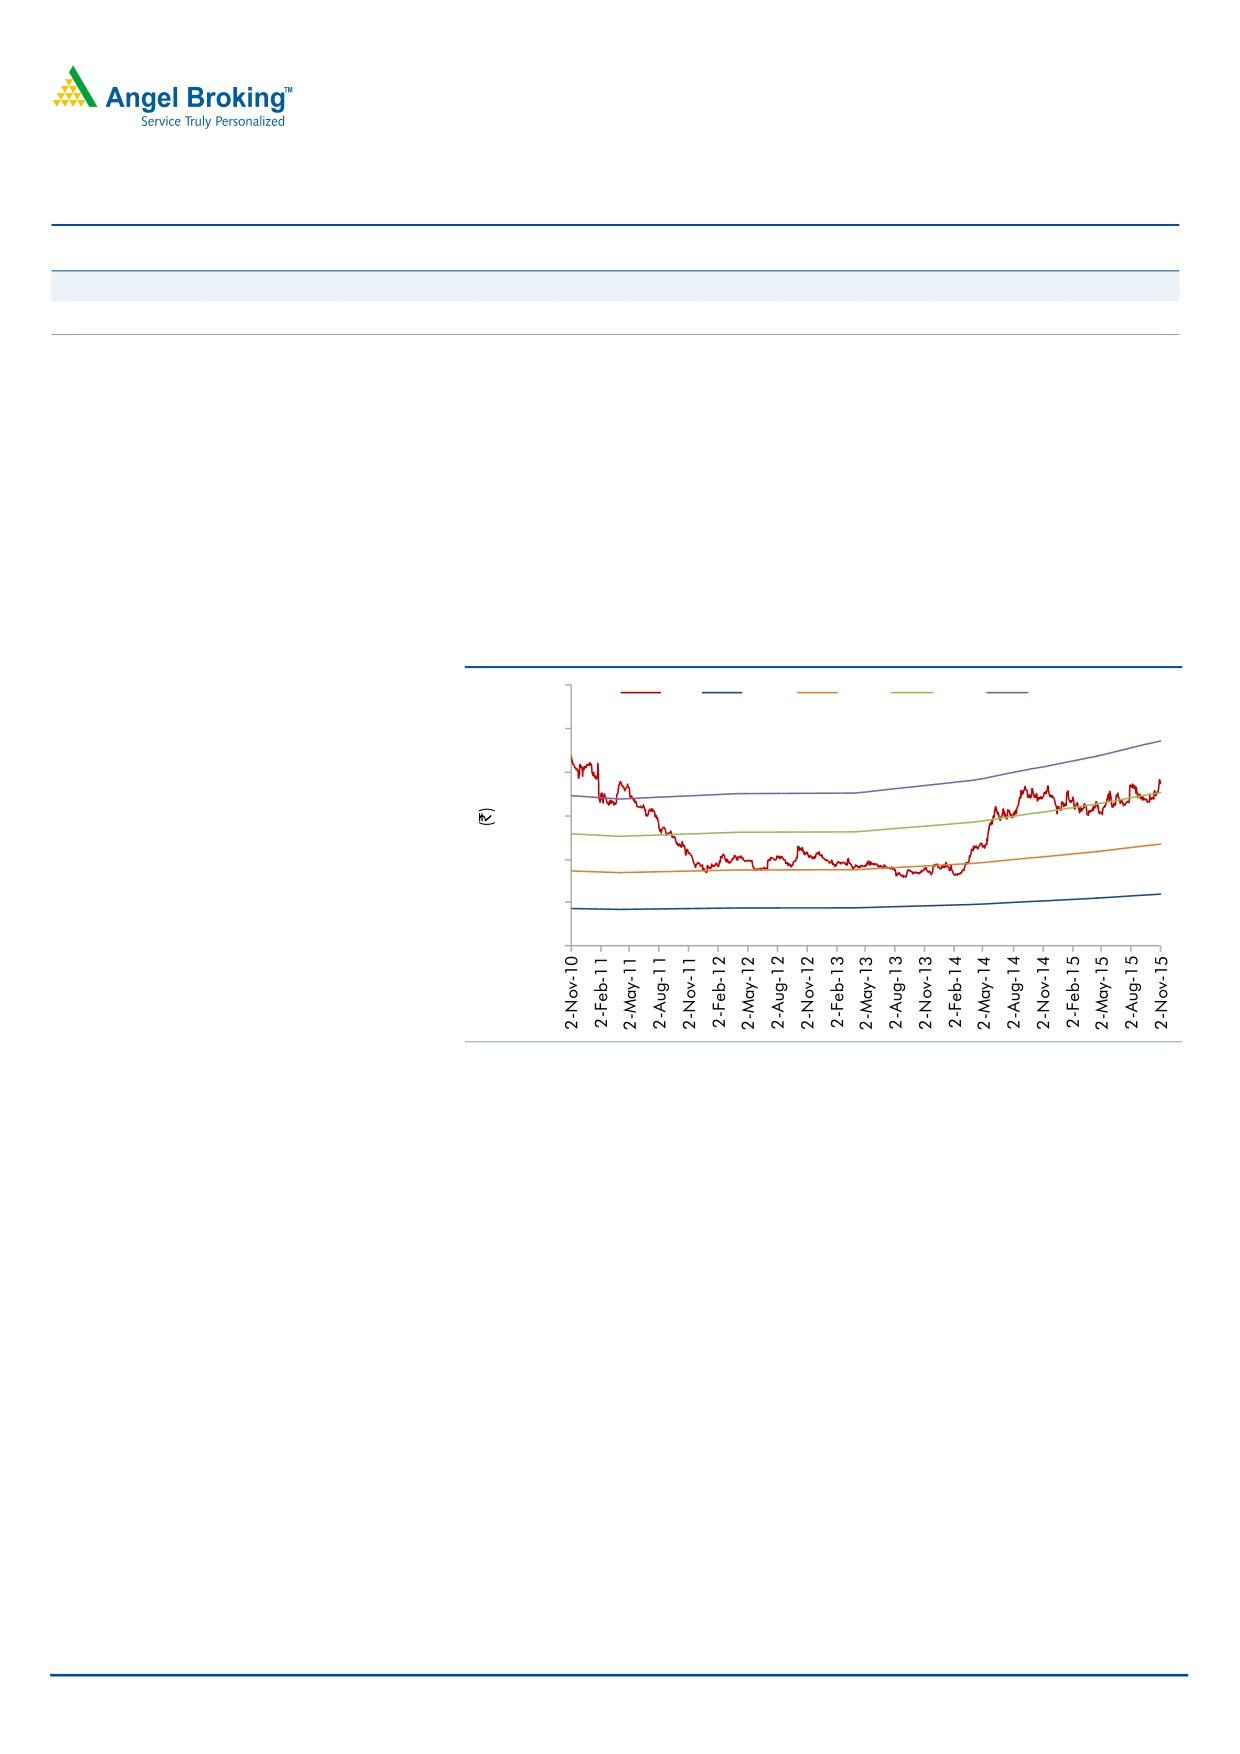
Outlook and valuation
We expect Blue Star to report a CAGR of 14.3% in its revenue over FY2015-17E to
`4,157cr. The EBITDA margin is expected to expand by 256bp over FY2015-17E
to 6.0% due to better margin orders. Consequently, the net profit is expected to be
at `130cr in FY2017E as compared to adjusted net profit of `42cr in FY2015. At
the current market price, the stock is trading at EV/sales of 0.9x for FY2017E and
26.3x its FY2017 earnings. Currently we have a Neutral rating on the stock.
Exhibit 8: One year forward EV/sales band
6,000
EV
0.3x
0.6x
0.9x
1.2x
5,000
4,000
3,000
2,000
1,000
-
Source: Company, Angel Research
Key concerns
Slowdown in investment cycle may impact the order inflow, thus impacting
revenue. It may also force the Management to compromise on its strategy of
avoiding low margin projects.
Slowdown in consumer segments like IT/ITES, healthcare, hospitality and
infrastructure is also expected to impact the company’s growth.
Foreign exchange fluctuations have a direct impact on the profit of the
Cooling Products division since commercial refrigerators are imported. Further
depreciation in the local currency may impact the profits of Blue Star.
November 3, 2015
8
Blue Star | 2QFY2016 Result Update
Company Background
Blue Star is India's largest central air-conditioning company with a network of
32 offices, seven manufacturing facilities, over
2,000 dealers and around
2,500 employees. The company’s operations could be classified under three main
segments:
EMPPACS: This segment comprises central and packaged air-conditioning
(involving design, engineering, manufacturing, installation, commissioning and
support of large central air conditioning plants, packaged air conditioners and
ducted split air conditioners) as well as electrical projects and plumbing and fire
fighting projects. In addition, the company promotes after-sales service as a
business, by offering several value added services in the areas of upgrades and
enhancements, air management, water management, energy management and
LEED consultancy for Green Buildings.
Cooling Products: Blue Star offers a wide range of contemporary window and split
air conditioners. The company also manufactures and markets a comprehensive
range of commercial refrigeration products and services that cater to the industrial,
commercial and hospitality sectors.
PEIS: This division has been the exclusive distributor in India for many
internationally renowned manufacturers of hi-tech professional electronic
equipment and services, as well as industrial products and systems.
November 3, 2015
9
Blue Star | 2QFY2016 Result Update
Profit and loss statement (Consolidated)
Y/E March (` cr)
FY2013
FY2014
FY2015
FY2016E
FY2017E
Gross sales
2,924
2,934
3,182
3,624
4,157
Less: Excise duty
-
-
-
-
-
Net Sales
2,924
2,934
3,182
3,624
4,157
Total operating income
2,924
2,934
3,182
3,624
4,157
% chg
3.7
0.4
8.4
13.9
14.7
Net Raw Materials
2,184
2,087
2,214
2,534
2,920
Personnel
230
248
267
278
306
Other
420
466
591
621
683
Total Expenditure
2,834
2,801
3,073
3,433
3,908
EBITDA
90
134
109
191
249
% chg
(0.3)
(1.2)
9.7
11.7
13.8
(% of Net Sales)
3.1
4.6
3.4
5.3
6.0
Depreciation& Amortisation
33
38
43
45
47
EBIT
57
96
66
146
202
% chg
-
67.9
(31.2)
38.3
(% of Net Sales)
2.0
3.3
2.1
4.0
4.9
Interest (incl. forex loss)
53
54
49
45
43
Other Income
36
35
31
13
15
(% of Net Sales)
1.2
1.2
1.0
0.4
0.4
Exceptional Items
-
-
(5.7)
(15.8)
-
PBT
41
76
43
99
174
% chg
-
87.1
(44.0)
131.2
76.0
Tax
3
2
(8)
25
43
(% of PBT)
6.3
2.9
(18.5)
25.0
25.0
PAT (reported)
38
74
51
74
130
Extraordinary (Expense)/Inc.
-
12
12
(13)
-
Share of Profit of Associate
1
4
4
-
-
ADJ. PAT
39
66
42
87
130
% chg
-
68.3
(35.6)
104.2
50.3
(% of Net Sales)
1.3
2.2
1.3
2.4
3.1
Basic EPS (`)
4.3
7.3
4.7
9.6
14.5
Fully Diluted EPS (`)
4.3
7.3
4.7
9.6
14.5
% chg
(37.2)
168.3
64.4
204.2
150.3
November 3, 2015
10
Blue Star | 2QFY2016 Result Update
Balance sheet (Consolidated)
Y/E March (` cr)
FY2013
FY2014
FY2015
FY2016E
FY2017E
SOURCES OF FUNDS
Equity Share Capital
18
18
18
18
18
Pref. Share Capital
-
18
-
-
-
Reserves& Surplus
383
443
438
457
533
Shareholders’ Funds
401
479
456
475
551
Total Loans
422
494
398
390
382
Deferred Tax Liability
(0)
(1)
(17)
(17)
(17)
Other Long Term Liabilities
5
4
6
6
6
Total Liabilities
827
976
843
855
923
APPLICATION OF FUNDS
Gross Block
451
514
549
603
637
Less: Acc. Depreciation
238
269
304
349
396
Net Block
213
245
245
254
241
Capital Work-in-Progress
8
15
22
18
14
Goodwill
15
11
11
9
8
Investments
27
33
36
36
36
Long term Loans & adv
112
120
139
152
175
Other non-current assets
-
-
-
-
-
Current Assets
1,785
1,911
1,704
1,938
2,238
Cash
17
68
44
14
37
Loans & Advances
98
130
116
132
151
Inventory
510
466
479
541
615
Debtors
835
833
795
943
1,082
Other current assets
325
414
270
308
353
Current liabilities
1,332
1,359
1,315
1,552
1,788
Net Current Assets
453
552
389
386
450
Misc. Exp. not written off
-
-
-
-
-
Total Assets
827
976
843
855
923
November 3, 2015
11
Blue Star | 2QFY2016 Result Update
Cash flow statement (Consolidated)
Y/E March (` cr)
FY2013 FY2014 FY2015 FY2016E FY2017E
Profit before tax
41
76
43
99
174
Depreciation
33
38
43
45
47
Change in Working Capital
(66)
(47)
139
(27)
(42)
Other income
(36)
(35)
(31)
(13)
(15)
Direct taxes paid
(3)
(2)
(7)
(25)
(43)
Others
57
37
28
-
-
Cash Flow from Operations
26
67
215
79
121
(Inc.)/Dec. in Fixed Assets
(12)
(71)
(43)
(47)
(29)
(Inc.)/Dec. in Investments
0
(6)
(3)
-
-
(Inc.)/Dec. In L.T loans and adv
(35)
(8)
(20)
(13)
(22)
Other income
36
35
31
13
15
Others
(9)
62
(14)
-
-
Cash Flow from Investing
(20)
11
(49)
(47)
(36)
Issue of Equity
(0)
18
(18)
0
-
Inc./(Dec.) in loans
55
73
(97)
(8)
(8)
(Dec.)/Inc. in long term provision
0
(1)
2
-
-
Forex difference on cash equivalent
0
-
-
-
-
Dividend Paid (Incl. Tax)
(32)
(42)
(54)
(54)
(54)
Others
(67)
(74)
(23)
-
-
Cash Flow from Financing
(44)
(26)
(190)
(62)
(62)
Inc./(Dec.) in Cash
(37)
52
(24)
(30)
22
Opening Cash balances
54
17
68
44
14
Closing Cash balances
17
68
44
14
37
November 3, 2015
12
Blue Star | 2QFY2016 Result Update
Key ratios
Y/E March
FY2013
FY2014
FY2015E
FY2016E
FY2017E
Valuation Ratio (x)
P/E (on FDEPS)
87.4
51.9
80.6
39.5
26.3
P/CEPS
47.2
33.0
39.9
25.9
19.3
P/BV
8.5
7.1
7.5
7.2
6.2
Dividend yield (%)
0.8
1.1
1.3
1.3
1.3
EV/Sales
1.3
1.3
1.2
1.0
0.9
EV/EBITDA
42.0
28.5
34.3
19.7
15.0
EV / Total Assets
4.6
3.9
4.4
4.4
4.0
Per Share Data (`)
EPS (Basic)
4.3
7.3
4.7
9.6
14.5
EPS (fully diluted)
4.3
7.3
4.7
9.6
14.5
Cash EPS
8.1
11.5
9.5
14.7
19.7
DPS
3.0
4.0
5.0
5.0
5.0
Book Value
44.6
53.2
50.7
52.9
61.3
DuPont Analysis
EBIT margin
2.0
3.3
2.1
4.0
4.9
Tax retention ratio
0.9
1.0
1.2
0.8
0.8
Asset turnover (x)
4.3
3.8
4.3
5.0
5.2
ROIC (Post-tax)
7.9
12.1
10.4
15.0
18.8
Cost of Debt (Post Tax)
0.1
0.1
0.2
0.1
0.1
Leverage (x)
0.8
0.9
0.8
0.7
0.6
Operating ROE
14.4
22.6
18.2
25.4
30.8
Returns (%)
ROCE (Pre-tax)
7.2
10.6
7.2
17.2
22.7
Angel ROIC (Pre-tax)
8.4
12.4
8.8
19.9
25.1
ROE
9.8
15.0
9.1
18.6
25.4
Turnover ratios (x)
Asset Turnover (Gross Block)
6.8
6.1
6.0
6.3
6.7
Inventory / Sales (days)
60
61
54
51
51
Receivables (days)
100
104
93
95
95
Payables (days)
171
175
159
165
167
WC cycle (ex-cash) (days)
50
57
47
36
34
Solvency ratios (x)
Net debt to equity
0.8
0.9
0.8
0.7
0.6
Net debt to EBITDA
4.2
2.9
2.9
1.8
1.2
Interest Coverage (EBIT / Int.)
1.1
1.8
1.4
3.3
4.7
November 3, 2015
13
Blue Star | 2QFY2016 Result Update
Research Team Tel: 022 - 39357800
DISCLAIMER
Angel Broking Private Limited (hereinafter referred to as “Angel”) is a registered Member of National Stock Exchange of India Limited,
Bombay Stock Exchange Limited and Metropolitan Stock Exchange of India Limited. It is also registered as a Depository Participant with
CDSL and Portfolio Manager with SEBI. It also has registration with AMFI as a Mutual Fund Distributor. Angel Broking Private Limited is
a registered entity with SEBI for Research Analyst in terms of SEBI (Research Analyst) Regulations, 2014 vide registration number
INH000000164. Angel or its associates has not been debarred/ suspended by SEBI or any other regulatory authority for accessing
/dealing in securities Market. Angel or its associates including its relatives/analyst do not hold any financial interest/beneficial
ownership of more than 1% in the company covered by Analyst. Angel or its associates/analyst has not received any compensation /
managed or co-managed public offering of securities of the company covered by Analyst during the past twelve months. Angel/analyst
has not served as an officer, director or employee of company covered by Analyst and has not been engaged in market making activity
of the company covered by Analyst.
This document is solely for the personal information of the recipient, and must not be singularly used as the basis of any investment
decision. Nothing in this document should be construed as investment or financial advice. Each recipient of this document should
make such investigations as they deem necessary to arrive at an independent evaluation of an investment in the securities of the
companies referred to in this document (including the merits and risks involved), and should consult their own advisors to determine
the merits and risks of such an investment.
Reports based on technical and derivative analysis center on studying charts of a stock's price movement, outstanding positions and
trading volume, as opposed to focusing on a company's fundamentals and, as such, may not match with a report on a company's
fundamentals.
The information in this document has been printed on the basis of publicly available information, internal data and other reliable
sources believed to be true, but we do not represent that it is accurate or complete and it should not be relied on as such, as this
document is for general guidance only. Angel Broking Pvt. Limited or any of its affiliates/ group companies shall not be in any way
responsible for any loss or damage that may arise to any person from any inadvertent error in the information contained in this report.
Angel Broking Pvt. Limited has not independently verified all the information contained within this document. Accordingly, we cannot
testify, nor make any representation or warranty, express or implied, to the accuracy, contents or data contained within this document.
While Angel Broking Pvt. Limited endeavors to update on a reasonable basis the information discussed in this material, there may be
regulatory, compliance, or other reasons that prevent us from doing so.
This document is being supplied to you solely for your information, and its contents, information or data may not be reproduced,
redistributed or passed on, directly or indirectly.
Neither Angel Broking Pvt. Limited, nor its directors, employees or affiliates shall be liable for any loss or damage that may arise from
or in connection with the use of this information.
Note: Please refer to the important ‘Stock Holding Disclosure' report on the Angel website (Research Section). Also, please refer to the
latest update on respective stocks for the disclosure status in respect of those stocks. Angel Broking Pvt. Limited and its affiliates may
have investment positions in the stocks recommended in this report.
Disclosure of Interest Statement
Blue Star
1. Analyst ownership of the stock
No
2. Angel and its Group companies ownership of the stock
No
3. Angel and its Group companies' Directors ownership of the stock
No
4. Broking relationship with company covered
No
Note: We have not considered any Exposure below ` 1 lakh for Angel, its Group companies and Directors
Ratings (Based on expected returns
Buy (> 15%)
Accumulate (5% to 15%)
Neutral (-5 to 5%)
over 12 months investment period):
Reduce (-5% to -15%)
Sell (< -15)
November 3, 2015
14