Initiating coverage | Capital Goods
December 17, 2015
Bharat Electronics
BUY
CMP
`1,206
Battlefield set
Victory likely
Target Price
`1,414
Bharat Electronics (BEL) is a PSU and a leader in the domestic defense electronics space,
Investment Period
12 Months
with major proportion of its revenue coming in from the Indian Navy and Army.
Defense spending at an inflexion point: After years of lull, government announced
Stock Info
15.4% yoy increase in Defense Capital Budget to `94,588cr. In our view, we are
Sector
Capital Goods
at an inflexion point where Indian Defense capex cycle, led by government
Market Cap (` cr)
28,944
spending is entering new era of growth. Our view strengthens on account of
following developments, (1) Defense sector getting high priority in government’s
Net debt (` cr)
(6,013)
‘Make in India’ campaign, with increased emphasis on the indigenization aspect,
Beta
1.1
(2) increase in FDI limits in defense from 26% to 49%, and (3) $47bn worth of
52 Week High / Low
1,386/869
projects cleared by Defense Acquisition Council (DAC) in last 19 months,
Avg. Daily Volume
292,634
indicating faster clearances in place. Also high expectations are being built from
Face Value (`)
10
soon to be released Defense Procurement Procedures (DPP). Current bid pipeline,
BSE Sensex
25,804
which could lead to strong award activity for next few years, along with above-
mentioned factors indicate that good times are ahead for Defense sector.
Nifty
7,844
Reuters Code
BAJE.BO
BEL to emerge as key beneficiary: At the backdrop of higher allocation made
towards defense capex with ~$47bn worth of projects cleared by DAC, we expect
Bloomberg Code
BHE@IN
good times ahead for defense players, including BEL. BEL in FY2015 had market
share of 37% in domestic defense electronics. On considering (1) bid-pipeline
dominated by Indian Airforce and Navy’s platform projects, which have high
Shareholding Pattern (%)
Defense Electronics components requirement, (2) BEL’s in-house R&D capabilities,
Promoters
75.0
(3) tie-up with Thales, France for product development, and (4) zero debt status with
MF / Banks / Indian Fls
14.7
potential for further improvement in working capital cycle, all point out that BEL should
FII / NRIs / OCBs
4.0
maintain its strong market positioning in Defense Electronics space. On a whole, we
Indian Public / Others
6.3
expect BEL to emerge as key beneficiary of the revival in Defense capex cycle.
Outlook & Valuation: At the current market price of `1,206/share, BEL is trading
at FY2016E and FY2017E P/E multiple of 22.3x and 19.6x, respectively. In the
Abs. (%)
3m 1yr 3yr
last 5 years, BEL’s stock has traded at 1-year forward P/E multiple of 14.0x. We
Sensex
(5.7)
(4.9)
33.3
expect BEL to report a 12.4% top-line and 13.7% bottom-line CAGR during
FY2015-18E; a similar growth rate is expected to be maintained beyond FY2017E
BEL
1.6
29.9
208.7
as well. We expect BEL to trade at a premium to its historical valuations on
3-Year Daily price chart
account of the uptick in investment cycle, which indicates strong long-term growth
prospects. The current low competitive intensity and the contention of it justifiably
1,600
1,400
commanding a scarcity premium, being the largest listed defense player, make
1,200
the stock all the more attractive. Considering the long-term growth prospects,
1,000
which should stretch beyond FY2017E, we assign a 1-year forward P/E multiple of
800
23.0x to arrive at price target of `1,414/share. Given the 17% upside from the
600
current levels, we initiate coverage on the stock with a BUY rating.
400
200
Key Financials
0
Y/E March (` cr)
FY13
FY14
FY15
FY16E
FY17E
FY18E
Net Sales
6,273
6,518
7,093
7,737
8,634
10,064
% chg
6.1
3.9
8.8
9.1
11.6
16.6
Source: Company, Angel Research
Net Profit
906
952
1,197
1,296
1,475
1,760
% chg
7.0
5.0
25.8
8.2
13.9
19.3
EBITDA (%)
10.6
14.1
16.6
16.8
17.2
17.6
EPS (`)
38
40
50
54
61
73
P/E (x)
31.8
30.4
24.2
22.3
19.6
16.4
P/BV (x)
4.5
4.0
3.6
3.2
2.8
2.5
RoE (%)
30.3
20.1
36.8
39.3
45.6
51.8
RoCE (%)
26.6
23.9
30.7
28.5
29.0
30.5
Yellapu Santosh
EV/Sales (x)
3.8
3.8
3.3
2.9
2.5
2.0
022 - 3935 7800 Ext: 6811
EV/EBITDA (x)
35.6
26.4
19.5
17.0
14.2
11.2
Source: Company, Angel Research; CMP as of December 17, 2015
Please refer to important disclosures at the end of this report
1
Initiating coverage | BEL
Investment Rationale
Defense Sector spending at an inflexion point
India’s Defence spend during FY2010-11 to FY2014-15 has risen at 9.6% CAGR
to `222,370cr. Notably, Capital expenditure has grown at a slower pace of 7.2%
CAGR during the same period (Average of Defense capex during FY2011-12 to
FY2015-16 (budgeted), accounts for 38% of the total Defense spends; lower than
developed nations spending).
In our view, we are at an inflexion point where the Indian Defense capex cycle is
entering a new era, with government spending cycle expected to see long-term
uptrend. Our view strengthens on account of following recent developments,
(1) Defense sector getting high priority in government’s ‘Make in India’ campaign,
where higher emphasis has been laid on the indigenization aspect, (2) increase in
Defense sector FDI limit from 26% to 49%, and (3) faster clearance processes put
into place (in 19 months after the NDA-led government having come into power,
~$47bn worth of projects have been cleared by Defense Acquisition Council
(DAC)). Amidst high expectations new Defense Procurement Procedures (DPP) are
expected to be announced soon.
The table below (“DAC cleared projects under various stages of awarding [on
page no. 3]) highlights that ~`244,089cr worth of Defense projects are at
awarding stages, and Defense companies like BEL could emerge as the biggest
beneficiaries of any such revival in the awarding activity.
Recent Defense Acquisition Council (DAC) clearances and positive Defense Ministry
announcements, indicate strong emerging bid pipeline for next few years, which in
our view are multi-thousand crore opportunity. Given that Defense projects take
longer time to materialize and are executed over 2-3 year periods, capex
commitments for given year also capture part payments for equipments purchased
earlier, thereby leaving lower budgeted spending towards purchase of new
equipments. Accordingly, we can see some short-term delays in awarding activity,
but long-term capex spending cycle is on an uptrend.
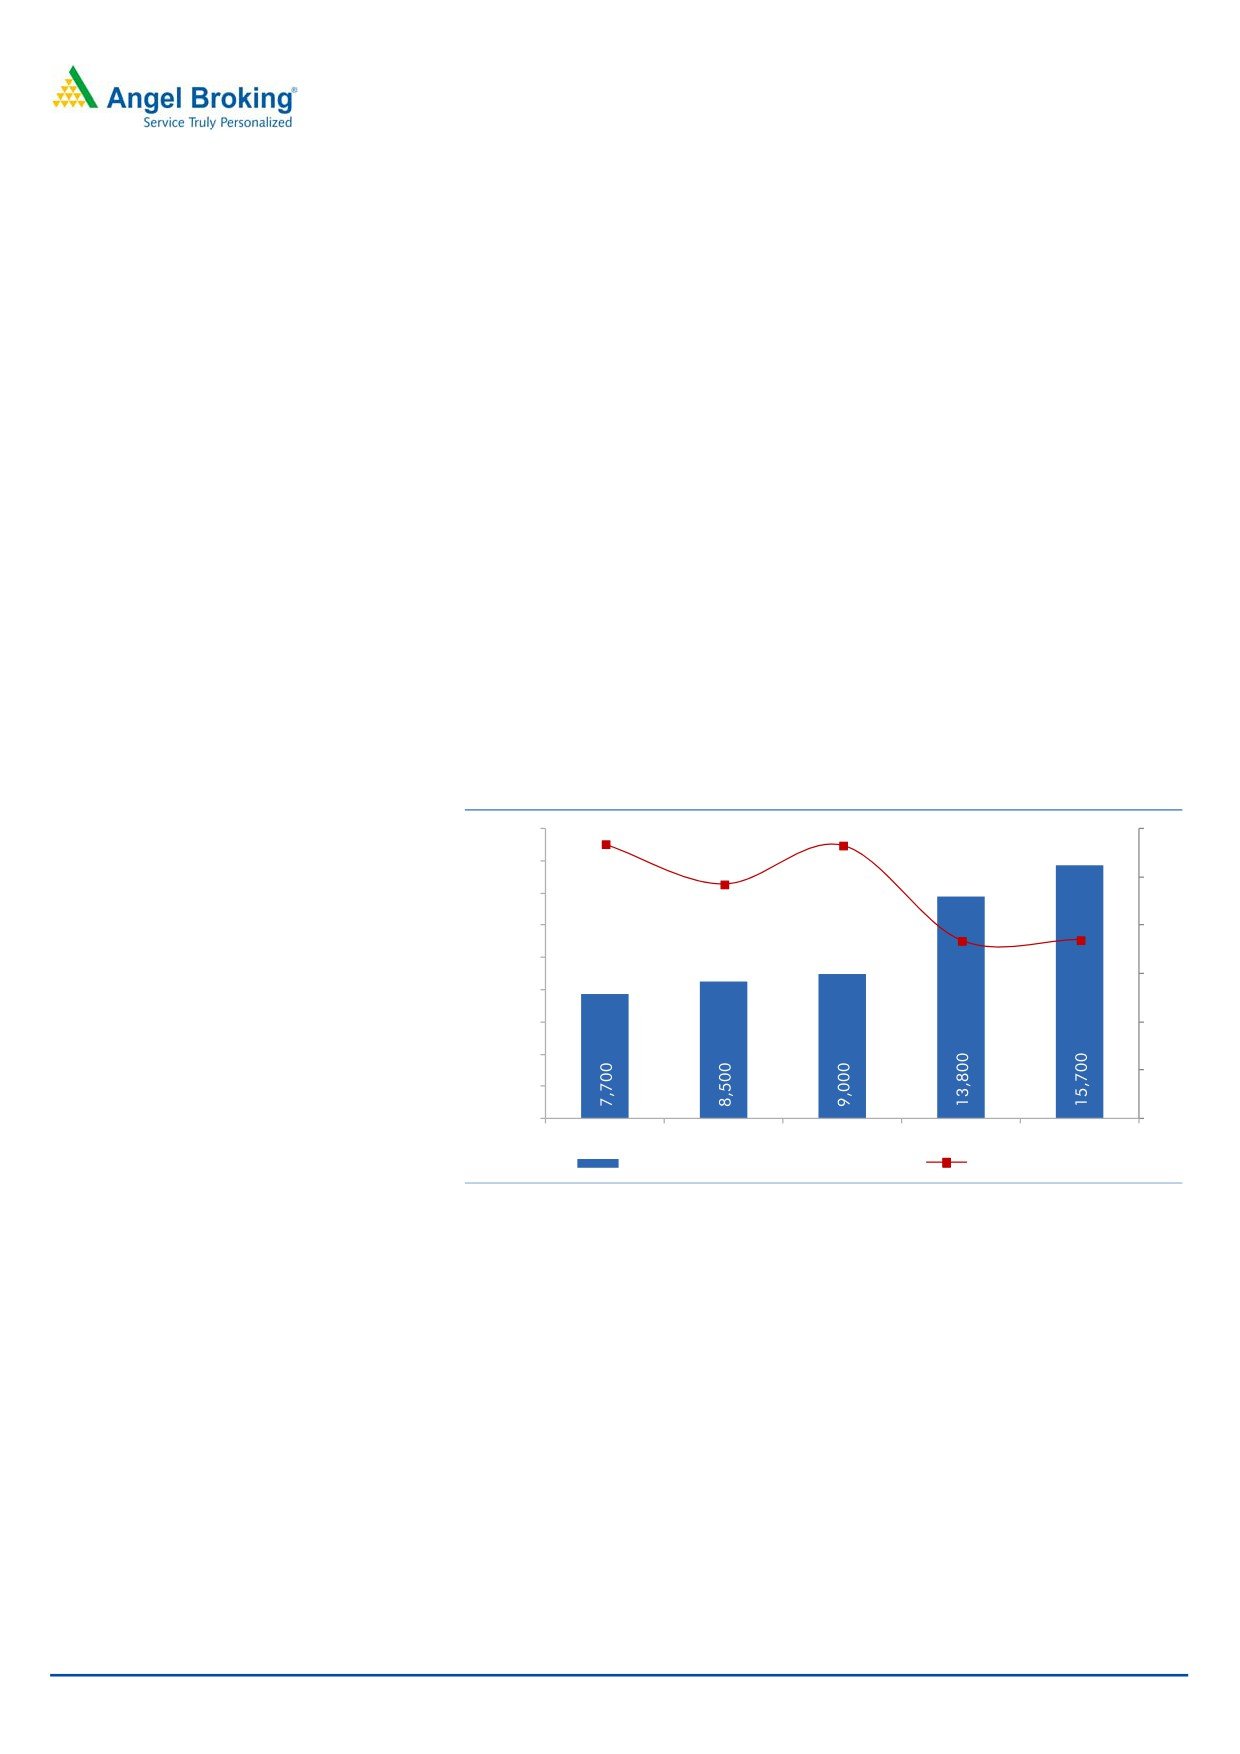
Exhibit 1: Defense Expenditure break-up...
Exhibit 2: Defence Cap. Exp Budget
154,117
170,913
181,776
203,499
222,370
246,727
18
100,000
15.4
100%
16
90,000
90%
80,000
14
80%
40
40
39
39
37
38
70,000
12
12.2
70%
60,000
10
60%
9.4
50,000
50%
8
40,000
40%
6
30,000
30%
60
60
61
61
63
62
4
3.8
3.6
20,000
20%
2
10,000
10%
0
0
0%
FY2011-12 FY2012-13 FY2013-14 FY2014-15 FY2015-16
FY2010-11 FY2011-12 FY2012-13 FY2013-14 FY2014-15 FY2015-16
Revenue
Capital
Defense Cap. Budget (` cr)
yoy growth (%)
Source: Company, Angel Research
Source: Company, Angel Research
December 17, 2015
2
Initiating coverage | BEL
Exhibit 3: DAC cleared projects under various stages of awarding
Sl.
Approx.
Orders in the pipeline
Comments
No.
value (` cr)
1
30 Weapon Locating Radars (Swati)
1,605
Cleared by DAC; to be awarded soon
2
2 French Airbus A-330 Aircrafts
5,100
Cleared by DAC; Radars mounted on the Aircraft would be made by DRDO
3
Ground based Mobile Electronic
NA
Cleared by DAC; BEL is the only domestic company to have worked on such
Intelligence System
project earlier; project to be awarded soon
4
36 Rafale Fighter Jets
60,000
Cleared by DAC; Govt. to soon sign agreement with French Govt. on this deal;
1 fighter Jet to be supplied within 3 years of signing the deal
5
8 Chetak Utility Helicopters
322
Cleared by DAC; To be ordered to HAL
6
4 Air Traffic Control (ATC) Radars
228
Cleared by DAC; to be awarded to BEL sooner
(at Avantipur, Bhita, Panagarh and Purnia)
7
Handheld Thermal Imager with Laser
4,000
Cleared by DAC; to be awarded to BEL sooner
Range Finders
8
Upgrade 428 L70 and Zu 23mm guns for
16,900
Cleared by DAC; BEL and Punj Lloyd cleared technical evaluation round;
the Army (Acceptance of Necessity)
Already executing `575cr project from Indian Army; final bid to be opened
sooner
9
4 P81 Aircrafts
4,380
Cleared by DAC;
10
Upgrade of Weapon and Sensor suite of
2,900
Cleared by DAC;
Delhi and Talwar Class Ships
11
4 large Survey Vessels for the Navy
2,324
Cleared by DAC; RFP to be announced sooner
12
Integrated Submarine Sonar - USHUS
NA
Cleared by DAC; BEL has the capabilities as it has earlier worked on such
projects earlier
13
7 Akash-2 Surface-to-Air Squadrons (14
4,790
Cleared by DAC; BEL being the lead vendor and integrator for IAF will be given
units) for Indian Airforce
the main contract under 'repeat order'; BEL manufactures surveillance radar,
tracking radar, flight control centre, support systems and integrates the
software; We expect BEL's share of the project to be ~`850cr
14
6 P 75I Submarine (Diesel Engine)
64,000
Cleared by DAC; 8-member panel has inspected all the facilities; RFP to be
soon invited; L&T, Mazgaon Dock and Pipavav Defense are strong contenders;
BEL and DRDO could get small chunk of API/ Sonar related works, given the
proximity to 5 shipyards identified by the 8-member panel
15
48 Mi 17 V-5 Choppers for Indian Airforce
6,966
DAC having negotiations with Russian entity
16
110 Naval Utility Helicopters
5,000
Cleared by DAC; 94 of the 110 are to be made in India; Companies other
than BEL could emerge as the key beneficiaries as 11 JV's/ companies have
shown interest
17
600 Unmanned Aerial Vehicles (UAVs)
NA
Director General of Infantry has already issued a Request for Information (RFI),
to be followed by Request for Proposals (RFPs); 4 Foreign players (along with
India JV partners) have participated in the RFI; BEL already is working on UAVs
and is one of the JV bidders at the RFI stage;
18
10 metre Short Span Bridges (Vehicle
490
Cleared by DAC; DRDO to benefit from this project
Mounted)
19
Mobile Integrated Electronic Warfare
1,682
Cleared by DAC; BEL has already sold ~`2,000cr worth of Electronic Warfare
System, Samyukta
Systems to Indian Army over the years; Developed Samyukta along with DRDO;
Expected to win this project as 'repeat order'; Could see competition from Tata
Power SED
20
P-7 Heavy Drop Platform (used for Military
402
Cleared by DAC;
Logistics)
21
Battlefield Management Systems
50,000
This order at very early stages; Awarding would happen only in FY2017
22
Tactical Communication Systems
13,000
This order at very early stages; Awarding would happen only in FY2017
244,089
Source: Media Articles, Company, Angel Research
Government machinery as well as media in various stances, have highlighted that
various types of Defense Equipments currently used are either outdated or are
obsolete. Government has taken due note of this and started addressing them
one-by-one. Government in its recent budget allocated 15.4% yoy increase in
Defense capital expenditure to `94,588cr.
December 17, 2015
3
Initiating coverage | BEL
In addition to higher budgetary allocation, government has laid increased
emphasis on domestic indigenization. The current bid pipeline focuses on domestic
indigenization up to the extent of 75% of project value.
Higher budgetary allocation towards Defense sector (in the back-drop of ageing/
obsolete Defense Equipments), when coupled with government’s thrust towards
indigenization, strengthen our view that we are at inflexion point of multi-year
increase in government spending towards Defense capex cycle. Based on order
pipeline and projects cleared by DAC (Defense minister highlighted that ~$35bn
worth of projects would get cleared in FY2016), we estimate strong uptick in the
domestic Defense capex cycle for next 2-3 years, post FY2016E.
Market share currently stands at ~37%….
Defense Electronics market, where BEL enjoys strong market positioning was
gradually opened for private sector participation in FY2006-07. L&T, Astra
Microwave, and Tata Power SED are the key domestic players in this space, which
have their own manufacturing facilities. Even though the sector has been open for
private sector participation, given the limited competition in Defense industry, BEL
has reported its market share in the 37-57% range during FY2011-15.
Exhibit 4: Defense Electronic Production & BEL market share
18,000
56.8
56.6
60
16,000
48.5
50
14,000
12,000
37.0
40
36.8
10,000
30
8,000
6,000
20
4,000
10
2,000
0
0
FY11
FY12
FY13
FY14
FY15
Defense Electronics Production (` cr)
BEL's Market Share (%)
Source: Dept. of Electronics & Information Technology, Angel Research
With government’s increasing Defense sector capex allocation, new private players
entered the Defense space using JV route and tying-up with foreign players. Most
of the JV’s that have shaped in the recent past have been formed with a focus on
win ‘platform’-based orders from emerging opportunities. Given that BEL focuses
only on Defense Electronics space, which is less crowded, we do not see any major
loss of market share for the company, going forward.
December 17, 2015
4
Initiating coverage | BEL
Exhibit 5: Recent Joint Ventures formed
JV Details
Segment
L&T (74%) & EADS (26%)
Defense Electronics Equipment
L&T (74%) & Thales (26%)
Avoinics
BEL (74%) & Thales (26%)
Civilian & Defense Radars
Axis Aerospace & Tech. (74%) &
Avoinics
Rosoboronexport (26%)
Mahindra & Mahindra (74%) &
Radar, Surveillance & Communication Systems
Telephonics (26%)
Source: Angel Research
Notably, 5 JV’s have been formed in Defense Electronics space, Avionics and
Radars and Surveillance space, the areas where BEL operates. Within areas where
BEL operates, management highlighted that they are facing more competitive
intensity across communications and night vision space than the traditional Radars
and Defense Electronics space. Further, management clarified that 80-90% of
contracts are won on nomination-basis. Considering all above-mentioned points,
BELs strong execution track record, when coupled with multi-fold growth in the bid
pipeline, we are optimistic that the emerging competition would not eat much in to
the growth prospects of BEL, for the next few years.
Order Inflows set to explode…
BEL during FY2013-15 has reported average yearly Order Inflows to the tune of
~`5,000cr. The huge order inflows seen during FY2011-12 is on account of large
order wins for Akash Missiles. Based on our interaction with BEL management, BEL
is optimistic of winning projects north of `10,000cr in FY2016E itself. These are the
projects where DAC has given the clearances, and BEL is either well placed to win
them or get repeat orders for works done earlier.
Following table below highlights that, projects over `6,000cr are likely to be
awarded to BEL in next few months:
Exhibit 6: Near-term potential Order Inflows for BEL
Approx.
Sl. No.
Orders in the pipeline
value (` cr)
1
30 Weapon Locating Radars (Swati)
1,605
2
Ground based Mobile Electronic Intelligence System
NA
3
4 Air Traffic Control (ATC) Radars
228
4
Handheld Thermal Imager with Laser Range Finders
4,000
5
Integrated Submarine Sonar - USHUS
NA
6
7 Akash-2 Surface-to-Air Squadrons for Indian Airforce
850
Total Value of projects in the pipeline
6,683
Source: Company, Angel Research
Our above estimates do factor works from the `4,790cr, 7 Akash-2 Surface-to-Air
Squadrons (14 units) project, where BEL’s scope of work in our view could be north
of ~`850cr. DAC has already cleared this project.
December 17, 2015
5
Initiating coverage | BEL
Exhibit 7: Order Inflow & Order Book movement
Exhibit 8: Order Book split to grow 1.8x by FY2018E
45,000
45,000
4.5
5.0
39,555
4.1
4.1
40,000
40,000
4.5
3.8
3.7
4.0
35,000
31,136
35,000
3.3
3.1
3.5
30,000
30,000
25,748
24,949
24,314
23,452
3.0
25,000
21,617
25,000
2.5
18,000
20,000
20,000
15,000
2.0
15,000
15,000
10,000
1.5
7,940
10,000
10,000
5,352
4,839
5,060
1.0
5,000
5,000
0.5
0
0
0.0
FY2012
FY2013
FY2014
FY2015
FY2016E
FY2017E FY2018E
FY2012
FY2013
FY2014
FY2015
FY2016E FY2017E FY2018E
Order Inflows
Order Book
Order Book
OB/LTM sales (x)
Source: Company, Angel Research
Source: Company, Angel Research
Again management has maintained optimism that they are strong contenders for
the `50,000/13,000cr Battlefield Management System/ Tactical Communication
System projects, which could be awarded in FY2017E.
On a whole, the strong bid pipeline and faster clearance process comforts us that
Order Inflow scenario would improve sharply from here-on and companies like
BEL should emerge as key beneficiaries. Accordingly, we expect BEL to report
~`10,000/15,000cr worth of new orders during FY2016/2017E.
Defense order wins do not translate to immediate execution, as BEL has to get
approval for Bulk Production Clearance (BPC) from its clients before it can go for
commercial production. Hence, management had given a conservative revenue
growth guidance of 8-10% for next few years. We have maintained our revenue
growth estimate of 9.1%/11.6% for FY2016/17E, respectively. Our FY2017E
revenue growth estimate is slightly ahead of management guidance, as we are
optimistic that as execution cycle improves management would revise-up it’s
revenue growth guidance for FY2017E.
As of 2QFY2016-end, BEL is sitting on an order book (OB) of `21,648cr (~3.1x
OB/LTM revenues). We expect OB of the company to grow 1.8x during FY2015-
18E to `39,555cr by FY2018-end.
12.4% revenue and 13.7% PAT CAGR during FY2015-18E…
Given that BEL has to get BPC before starting commercial production of Defense
Equipments from its client, despite almost doubling of the Order Inflows, we expect
BEL to report 12.4% revenue CAGR over FY2015-18E, majorly supported by
execution of projects in their Order Book, esp. the Akash Missile project.
Few large ticket projects, including the ~`6,500cr Akash Missiles project (won in
FY2011-12) got delayed. Recent successful tests by the Indian Air Force (IAF) and
receipt of BPC, gives better execution visibility of this project, now. Already `630cr
of revenues have been booked from this project YTDFY2016.
We expect BEL to report 12.4% revenue CAGR during FY2015-18E to `10,064cr
(ahead of management’s conservative 8-10% revenue growth outlook for next few
years).
December 17, 2015
6
Initiating coverage | BEL
Even though BEL has evolved as Systems Integrator over last few years, by focusing
more on R&D and increasing its focus on out-sourcing the non-core activities, we
sense that their 2 major cost heads, employee costs and raw material costs, would
continue to grow slightly behind revenue growth, thereby leaving some scope for
EBITDA margin expansion from here-on.
We estimate raw material cost assumption, in-line with management commentary,
that raw material costs is very much dependent on the product mix and it should
remain in 55-60% range of revenues. On the employee’s side, BEL every year has
added 200-350 staff in last few years, mainly engineers/ scientists. At the same
time BEL has reduced its staff strength from 11,545 employees in FY2010 to 9,703
employees in FY2015. We expect employee expenses as % of sales to decline from
18.1% in FY2015 to 15.5% by FY2018E.
On a whole, we expect PAT margins to expand from 16.9% in FY2015 to 17.5%
by FY2018E.
Exhibit 9: Revenue growth on uptrend...
Exhibit 10: EBITDA & PAT Margins (%) to expand...
12,000
16.6
18.0
20
17.1
16.9
17.5
16.7
16.0
18
10,000
14.6
11.6
16
14.4
17.6
14.0
17.0
16.6
16.7
14
8,000
12.0
8.8
14.1
9.1
12
10.0
6,000
10
6.1
8.0
10.6
8
4,000
6.0
3.9
6
4.0
4
2,000
2.0
2
0
0.0
0
FY13
FY14
FY15
FY16E
FY17E
FY18E
FY13
FY14
FY15
FY16E
FY17E
FY18E
Net Sales
yoy growth (%)
EBITDA Margin (%)
PAT Margin (%)
Source: Company, Angel Research
Source: Company, Angel Research
BEL to continue increasing its focus on R&D activities….
BEL is one of the exceptions to general perception that Public Sector Undertakings
(PSU’s) in India do not focus on technology upgrades. R&D spends as % of BEL’s
standalone sales increased from sub-5% levels in FY2007 (3.6%) to 7.8% by
FY2015. Same time, mix of Scientist/ Engineers to total employees increased from
29.6% in FY2010 to 41.7% in FY2015.
December 17, 2015
7
Initiating coverage | BEL
Exhibit 11: R&D spend as % of Standalone Sales...
Exhibit 12: Scientist/Engineers as % of Employees...
9.0
45.0
8.0
40.0
41.7
8.0
40.1
7.0
7.8
35.0
7.4
7.4
37.5
6.0
30.0
34.3
32.8
6.3
5.0
25.0
4.0
20.0
3.0
15.0
2.0
10.0
1.0
5.0
0.0
0.0
FY11
FY12
FY13
FY14
FY15
FY11
FY12
FY13
FY14
FY15
Source: Company, Angel Research
Source: Company, Angel Research
Higher in-house R&D spends, strong tie-ups with National Laboratories (including
Defense Research and Development Organization) and increased in-house
dependency on Scientists/ Engineers has helped BEL lower its revenue dependency
on foreign transfer of technology (ToTs) agreements. This can be seen from the
below table that revenues derived from technology acquired through foreign ToTs
has been stable at ~20% levels.
Exhibit 13: Higher contribution from indigenously developed products..
100
15
90
22
19
22
20
80
70
21
27
44
60
34
42
50
40
30
57
54
20
44
41
38
10
0
FY11
FY12
FY13
FY14
FY15
BEL developed prod.
Ass. with DRDO & Nat. Labs
Tech. acquired through foreign ToTs
Source: Company, Angel Research
This strategy of maintaining lower dependency on foreign ToTs, should avoid any
major volatility in earnings of the company. BEL management has maintained that
it would continue to pursue its strategy of increasing its focus on R&D and
outsource the non-core works. Management highlighted that they intend to set-up
a new R&D centre in Bangalore and further increase their R&D spends as % of
sales to ~10%, going forward.
Higher R&D spends in our view, would bridge the gaps in their current product
offerings and make them more efficient to the private players product offerings.
To continue capex to strengthen their product offerings…
BEL during FY2012-2015 has spent on an average of `300cr yearly towards the
capex. With improved visibility on the defense investment cycle, and government
December 17, 2015
8
Initiating coverage | BEL
increasingly emphasizing on upgrading the Defense technologies, BEL
acknowledging their product gaps (at the technology level), identified the need to
strongly further pursue the capex. Accordingly, the company has announced to
pursue `400-500cr of yearly capex for the next 3-5 years.
Exhibit 14: Capex pipeline for the next few years
Capex details
Location, State
Comments
To be set-up across 950 acres of land; proposed capex to the
New Missile Integration Range
Anantapur, A.P.
tune of `500cr; would take at least 3 years for operations to
commence;
Spread across 14 acres, this facility has started operations in
Test bed for Missile Systems
Bangalore, Karnataka
Sep-2015
BEL is supporting Atlas Elektronik on supply of 6 Sonars (as
part of contract, technology would be transferred to BEL);
Sonar Transducer Integration & Testing Facility
Bangalore, Karnataka
Expect ramp-up in capex towards this facility from FY2017
onwards;
Bangalore, Karnataka &
Additional Near Field Test Range (NFTRs)
Ghaziabad, U.P.
Manufacture Zinc Sulphide (ZnS) Domes
Highly Accelerated Life Test & Stress Screening
Facility
Tactical Communication System (TCS) Test Bed
Battlefield Management System (BMS) Test Bed
Robotic Welding Facility
50MW Solar Power Plant
Wind Energy Power Plant
Source: Company, Angel Research
Test bed for Missile Systems, Bangalore commenced operations in Sep-2015.
Whereas, Sonar Integration & Testing facility, Bangalore and Missile Integration
Range facility, Anantapur would not commence operations before FY2017E.
With roll-out of these modernization as well as expansion projects, we expect BEL
to strengthen its product portfolio in the long-run, which in turn should help them
support their key domestic client requirements. This on whole should lead to better
revenue growth visibility in the long-run.
Strong BS, Adj. RoE’s to expand to ~52% by FY2018E...
BEL is a cash rich company, sitting on net cash (adj. for debt, consol.) of `6,103cr.
Noticeably, this cash rich position is despite the point that debtors and inventory
position of BEL has deteriorated over the last few years. Management attributed
payment delays and bureaucratic functioning, as key reasons for working capital
cycle deterioration.
In our view, stretch in working capital cycle is also attributable to BEL’s transition
from being pure play products supplier to Systems Integrator (material costs
increased sharply owing to high proportion of bought-out items for a project).
BEL in our view has reached later stages of the transition process from being a
products developer to Systems Integrator. Our view stems from the point that (1)
BEL works with ~800 indigenous vendors in the domestic markets, and (2) intends
to further increase its R&D spends to 10% going forward. These pointers put BEL as
India’s largest Systems Integrator in the Defense space.
December 17, 2015
9
Initiating coverage | BEL
In the back-drop of higher budgetary allocation towards Defense capex, strong
bid-pipeline emerging, where BEL should see strong order inflow growth, roll-out
of new simplified Defense Procurement Procedure (DPP) in next few months,
comfort us that BEL’s Working Capital cycle should gradually improve, going
forward.
Considering uptick in earnings growth, improvement in working capital cycle, we
expect BEL to report improvement in its Adj. Return on Equity (RoE) levels from
20.1% in FY2014 to 51.8% by FY2018E. On a whole, BEL should continue to
report expansion in its Adj. RoEs during FY2016-18E.
BEL management has announced that it is pursuing yearly capex of ~`400-500cr
for next 3-5 years. We expect BEL to generate over `1,100cr of yearly cash flow
from operations, which should support their yearly capex plans of `400-500cr.
Going forward, we do not see BEL depending on debt to pursue its proposed
capex.
December 17, 2015
10
Initiating coverage | BEL
About the Company
Bharat Electronics Ltd. (BEL) is Bangalore based public sector undertaking (PSU)
established in 1954 under the control of Ministry of Defence (MoD) to cater to
specialised electronic needs of the Indian Defense. BEL, a Nava-Ratna company
over the years has grown to be multi-segment, multi-technology company servicing
a diverse range of clients across India and in the international markets.
Business Segments
BEL operates across 8 business segments, with ~20-30% of their current Order
Book contribution coming-in from their largest business segment- Radars, Sonars
& Weapons Systems.
Exhibit 15: Business Segments
Radars, Sonars & Weapon Systems
Communication
Electronic Warfare
Network Centric Systems
Anti Submarine Warfare
Electro-Optics
Tank Electronics
Civilian Products (such as EVM machines
Source: Company, Angel Research
Details of Manufacturing Plants
To-date BEL has set-up 9 manufacturing plants across Bangalore (headquarters),
Chennai, Machilipatnam (post take-over of Andhra Scientific Company in 1983),
Hyderabad, Pune, Navi Mumbai, Panchkula, Kotdwara, and Ghaziabad, which
are into manufacture of entire range of Defense products offered by the company.
Exhibit 16: Details of Manufacturing facilities
Production Facilities
Production details
(since)
Military Communication Equipment, Network Centric Systems,
Military Radars, Naval Systems, Electronic Warfare (Air-force),
Avionics, Weapon Management System, Telecom and
Bangalore (1966)
Broadcast System, Components, Coastal Surveillance System,
Electronic Voting Machines, Solar Products, Traffic Signals,
Security Systems, Microwave Super Components
Tank Electronics, Gun Upgrades, Multi-purpose Advanced
Chennai
Stabilized systems
Machilipatnam (1983) Electro-Optics (Night Vision Devices)
Hyderabad
Electronic Warfare Systems
Pune (1981)
X-ray Tubes, Batteries, Laser Products
Navi Mumbai
Shelters, Masks
Panchkula
Military Communication Equipment, Encryption Products
Kotdwara
Telecommunication Systems, Military Communication Systems
Network Centric Systems, Radars, Satcom (Defense),
Ghaziabad
Microwave components
Source: Company AR’s, Angel Research
December 17, 2015
11
Initiating coverage | BEL
Valuation
BEL in our view is expected to emerge as the key beneficiary of (1) increase in the
long-term defence spending and (2) government’s indigenization push (as can be
seen from their Make-in-India drive). Also, these positives when coupled the strong
market positioning within the niche area where BEL operates comforts us that good
days are ahead for BEL stock. We expect BEL to report doubling of the order
inflows to `10,000cr in FY2016E and to further accentuate to `15,000cr in
FY2017E. Accordingly, the OB of the company would increase from `21,648cr
(OB/TTM sales ratio of 3.1x) to `39,555cr (OB/TTM sales ratio of 4.1x). Despite
the strong ordering trends, given that longer time taken to get bulk production
clearances from the clients, management has given conservative 8-10% top-line
growth for next few years. We are optimistic, that BEL management would revise
upwards the revenue growth numbers as defense processes get more streamlined
and visibility on the execution front improves.
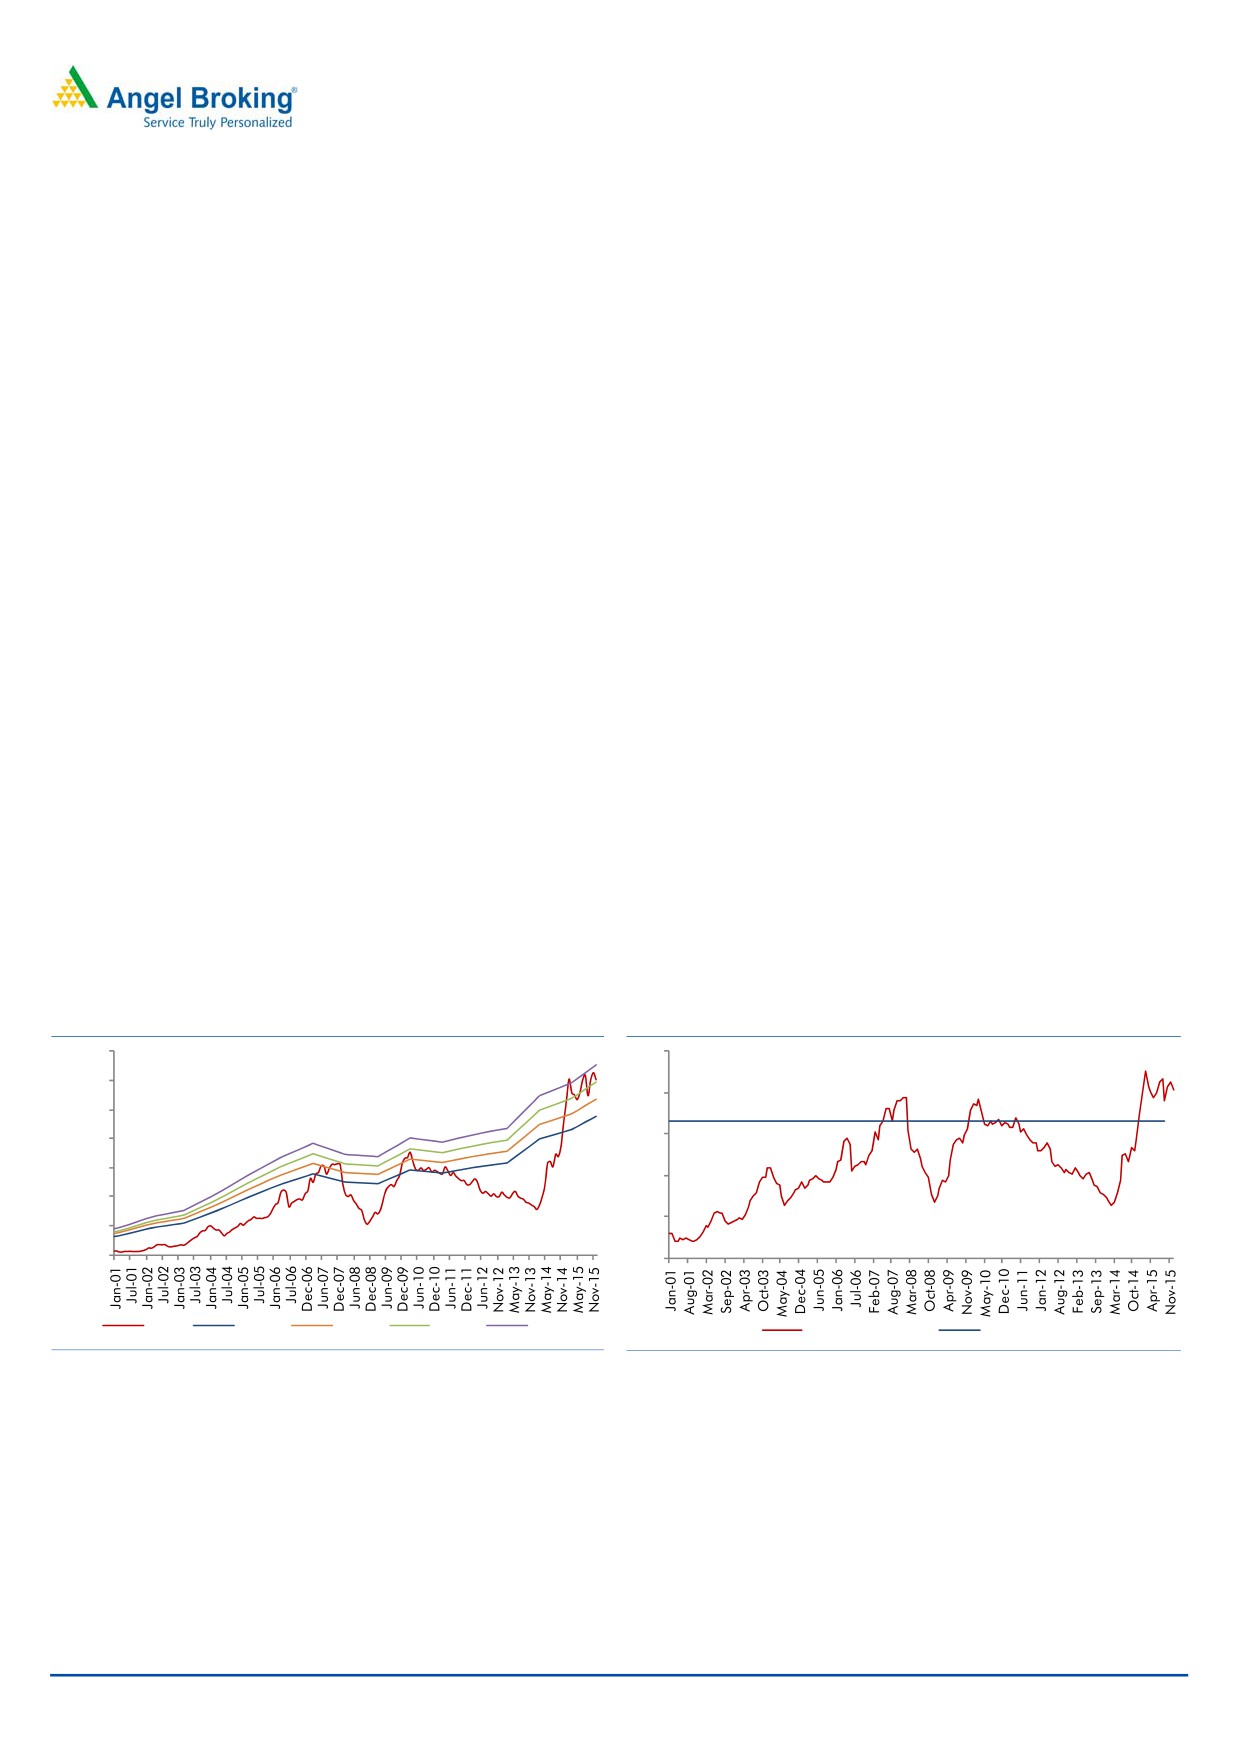
At the current market price of `1,206/share, BEL stock is trading at FY2016E and
FY2017E P/E multiple of 22.3x and 19.6x, respectively. Historically, in the last 5
years, BEL’s stock has traded at a 1-year forward P/E multiple of 14.0x.
We expect BEL to report 12.4% top-line and 13.7% bottom-line CAGR during
FY2015-18E, with such strong growth expected to sustain beyond FY2017 as well.
We expect BEL to trade at premium to its historical valuations on account of the
uptick in the investment cycle, which indicates strong long-term growth outlook
with lesser competitive business threat and scarcity premium it enjoys being the
largest listed defense player. Considering the long-term growth prospects, which
should stretch beyond FY2017E, we have assigned 1-year forward P/E multiple of
23.0x.
Exhibit 17: 1-year forward P/E multiple band (x)
Exhibit 18: 1-year forward Avg. P/E band (x)
1,400
25
1,200
20
Avg. 1-year fwd. P/E- 14x
1,000
15
800
600
10
400
5
200
0
0
Price
16.0x
18.0x
20.0x
22.0x
1-yr Fwd PE (x)
Avg. P/E
Source: Angel Research
Source: Angel Research
Our target multiple of 23.0x captures, (1) strong business uptick in FY2016/17E,
which is expected to last for few years, (2) strong market positioning amidst
increasing competitive intensity, (3) debt free company with adj. RoE expansion
potential (to expand to 51.8% by FY2018E). On assigning 23.0x P/E multiple to
our FY2017E EPS estimate of `61/share, we arrive at price target of `1,414/share.
Given the 17% upside from current levels, we initiate coverage on BEL stock with
Buy rating.
December 17, 2015
12
Initiating coverage | BEL
ANNEXURE
Exhibit 19: Major Orders executed in FY2015
Sl. No.
Particulars of Orders executed
1
Akash Weapon System
2
Passive Night Vision Devices
3
3D Tactical Control Radar
4
Missile Warning System
5
Schilka Gun Tank Upgrade
6
Laser Range Finder
7
Hull Mounted Sonar
8
Shipborne EW System (Sanket)
9
Fire Control Systems
10
Electronic Voting Systems
Source: Company
Exhibit 20: Major Projects planned during FY2016
Sl. No.
Particulars of Orders executed
1
Akash Missile System
2
3D Tactical Control Radar
3
Low level Light Weight Radar
4
Handheld Thermal Imagers
5
Schilka Gun Tank Upgrade
6
L70 Gun Upgrade
7
New Generation Hull Mounted Sonar
8
Gigabyte Ethernet based Ship Data Network
9
Combat Management System
10
Shipborne Electronic Warfare System
12
Fire Control Systems
13
Electronic Voting Systems
Source: Company
December 17, 2015
13
Initiating coverage | BEL
Risks to our Estimates
To increase indigenization in the defense sector, Government of India (GoI)
increased the FDI limit in Defense sector to 49% in Jul-2014. Till now, recent
developments/ announcements have failed to attract any major international
defense players in to India. With more positive announcements expected and
fast growing bid pipeline, international defense giants could be compelled to
forge partnership with domestic players at the time of bidding. This could
possibly lead to loss of market share for BEL, which we have not incorporated
in to our assumptions.
Last few years have seen sluggish ordering activity from the Defense sector.
Even though Defense sector in the last few months has seen positive
announcements, any further delays in the awarding activity, could act as risk
to our estimates.
Management highlighted that it is working on improvising some areas of the
technology part, which are a gap currently. BEL’s management’s inability to
form tie-ups with international MNC’s or absorb the technology from foreign
vendors could impact its financials, going forward.
Defense is a highly technology focused sector. BEL would have to continuously
spend on R&D to regularly upgrade its product profile. Any shift away from the
R&D could make their products unattractive (vs the peers), resulting in loss of
market share and further delaying the execution.
Any government announcement to de-list the products manufactured by BEL
could open up the competition and further impact their market positioning
within the domestic markets, which again acts as a risk to our market share
assumptions and threatens our earnings growth estimates.
Defense Ministry has been asked by government to set-up 300MW of power
plants. In line with this broader goal, BEL has decided to set-up 50MW of solar
power plant. This is an area of unrelated business entry for BEL (even though
BEL claims that it makes voltaic modules amongst other parts).
December 17, 2015
14
Initiating coverage | BEL
Profit and Loss Statement
Y/E March (` cr)
FY13
FY14
FY15
FY16E
FY17E
FY18E
Net Sales
6,273
6,518
7,093
7,737
8,634
10,064
% Chg
6.1
3.9
8.8
9.1
11.6
16.6
Total Expenditure
5,610
5,596
5,918
6,440
7,153
8,289
Raw Materials Consumed
3,156
3,344
3,495
3,870
4,384
5,141
Purchase of stock-in-trade
760
444
440
467
515
580
Employee benefits Expense
1,125
1,046
1,281
1,343
1,406
1,564
Other Expenses
569
762
702
760
847
1,004
EBITDA
663
922
1,175
1,297
1,481
1,775
% Chg
4.3
39.1
27.4
10.4
14.2
19.8
EBIDTA %
10.6
14.1
16.6
16.8
17.2
17.6
Depreciation
136
150
166
193
216
239
EBIT
526
772
1,008
1,104
1,265
1,537
% Chg
3.2
46.6
30.6
9.4
14.6
21.4
Interest and Financial Charges
1
4
3
3
3
3
Other Income
625
437
507
544
611
709
EBT before Excep. & prior-period items
1,151
1,205
1,513
1,645
1,874
2,242
Exceptional Items & Prior period Items
(9)
1
1
0
0
0
EBT
1,142
1,206
1,513
1,645
1,874
2,242
Tax Expenses
236
254
316
349
398
482
% of PBT
20.7
21.1
20.9
21.2
21.2
21.5
PAT before Minority Interest
906
952
1,197
1,296
1,476
1,760
Minority Interest
0
0
(0)
0
0
1
PAT
906
951
1,197
1,296
1,475
1,760
% Chg
7.0
5.0
25.8
8.2
13.9
19.3
PAT %
14.4
14.6
16.9
16.7
17.1
17.5
Diluted EPS
114
119
150
54
61
73
% Chg
7.6
4.4
25.8
8.2
13.9
19.3
December 17, 2015
15
Initiating coverage | BEL
Balance Sheet
Y/E March (` cr)
FY13 FY14 FY15 FY16E FY17E FY18E
Sources of Funds
Equity Capital
80
80
80
240
240
240
Reserves & Surplus
6,407
7,140
8,037
8,852
9,975
11,348
Networth
6,487
7,220
8,117
9,092
10,215
11,588
Total Debt
0
0
25
0
0
0
Minority Int. & Govt. Grants
163
224
207
203
202
202
Other Long-term Liab. & Prov.
386
365
435
441
476
483
Total Liabilities
7,037
7,809
8,784
9,736
10,893
12,273
Application of Funds
Gross Block
2,106
2,366
2,894
3,276
3,681
4,104
Accumulated Depreciation
1,506
1,671
1,821
2,014
2,230
2,469
Net Block
600
695
1,073
1,262
1,451
1,635
Capital WIP & Intan. Assets Dev.
328
458
140
110
105
100
Investments
0
0
0
0
0
0
Current Assets
Inventories
3,255
3,340
3,424
3,664
3,864
4,244
Sundry Debtors
3,364
4,156
3,805
4,146
4,707
5,476
Cash and Bank Balance
5,331
4,605
6,038
6,901
7,938
9,042
Loans & Advances
1,378
1,190
684
750
800
780
Other Current Asset
81
69
54
55
57
59
Current Liabilities
7,814
7,166
6,941
7,663
8,547
9,589
Net Current Assets
5,594
6,192
7,064
7,852
8,818
10,012
Other Assets
515
464
506
512
520
525
Total Assets
7,037
7,809
8,784
9,736
10,893
12,273
December 17, 2015
16
Initiating coverage | BEL
Cash Flow Statement
Y/E March (` cr)
FY13
FY14
FY15
FY16E FY17E FY18E
Profit before tax
1,147
1,206
1,513
1,645
1,874
2,242
Dep. & Other Non-cash Chrg.
(338)
(336)
(163)
(266)
(218)
(225)
Change in Working Capital
(2,104)
(1,237)
436
75
71
(90)
Interest & Financial Charges
1
4
3
3
3
3
Direct taxes paid
(245)
(206)
(356)
(349)
(398)
(482)
Cash Flow from Operations
(1,540)
(569)
1,434
1,108
1,332
1,448
(Inc)/ Dec in Fixed Assets
(353)
(369)
(225)
(351)
(400)
(418)
(Inc)/ Dec in Inv. & Oth. Adj.
2,106
1,128
(614)
302
238
142
Cash Flow from Investing
1,753
759
(839)
(49)
(162)
(277)
Issue/ (Buy Back) of Equity
0
0
0
0
0
0
Inc./ (Dec.) in Borrowings
0
(0)
25
(25)
0
0
Dividend Paid (Incl. Tax)
(157)
(209)
(220)
(301)
(331)
(364)
Interest Expenses & Oth. Adj.
(1)
(4)
(14)
(3)
(3)
(3)
Cash Flow from Financing
(157)
(213)
(209)
(329)
(334)
(367)
Inc./(Dec.) in Cash
56
(23)
386
730
837
804
Opening Cash balances
1,752
1,809
1,786
2,171
2,901
3,738
Closing Cash balances
1,809
1,786
2,171
2,901
3,738
4,542
December 17, 2015
17
Initiating coverage | BEL
Key Ratios
Y/E March
FY13
FY14
FY15
FY16E FY17E FY18E
Valuation Ratio (x)
P/E (on FDEPS)
31.8
30.4
24.2
22.3
19.6
16.4
P/CEPS
27.6
26.3
21.2
19.4
17.1
14.5
Dividend yield (%)
1.6
1.6
1.2
1.1
1.0
0.9
EV/Sales
3.8
3.8
3.3
2.9
2.5
2.0
EV/EBITDA
35.6
26.4
19.5
17.0
14.2
11.2
EV / Total Assets
3.4
3.1
2.6
2.3
1.9
1.6
Per Share Data (`)
EPS (fully diluted)
38
40
50
54
61
73
Cash EPS
44
46
57
62
70
83
DPS
7.4
7.8
9.7
10.7
11.8
13.0
Book Value
270
301
338
379
426
483
Returns (%)
RoCE (Pre-tax)
26.6
23.9
30.7
28.5
29.0
30.5
Angel RoIC (Pre-tax)
35.8
35.0
36.4
41.4
45.4
51.4
RoE
30.3
20.1
36.8
39.3
45.6
51.8
Turnover ratios (x)
Asset Turnover (Gr. Block) (x)
2.9
2.8
2.6
2.4
2.4
2.5
Inventory / Sales (days)
178
190
179
172
163
150
Receivables (days)
180
217
211
193
192
189
Payables (days)
541
489
435
414
414
399
WC (days)
(183)
(82)
(45)
(50)
(59)
(61)
Leverage Ratios (x)
D/E ratio (x)
0.0
0.0
0.0
0.0
0.0
0.0
December 17, 2015
18
Initiating coverage | BEL
Research Team Tel: 022 - 39357800
DISCLAIMER
Angel Broking Private Limited (hereinafter referred to as “Angel”) is a registered Member of National Stock Exchange of India Limited,
Bombay Stock Exchange Limited and Metropolitan Stock Exchange of India Limited. It is also registered as a Depository Participant with
CDSL and Portfolio Manager with SEBI. It also has registration with AMFI as a Mutual Fund Distributor. Angel Broking Private Limited is
a registered entity with SEBI for Research Analyst in terms of SEBI (Research Analyst) Regulations, 2014 vide registration number
INH000000164. Angel or its associates has not been debarred/ suspended by SEBI or any other regulatory authority for accessing
/dealing in securities Market. Angel or its associates including its relatives/analyst do not hold any financial interest/beneficial
ownership of more than 1% in the company covered by Analyst. Angel or its associates/analyst has not received any compensation /
managed or co-managed public offering of securities of the company covered by Analyst during the past twelve months. Angel/analyst
has not served as an officer, director or employee of company covered by Analyst and has not been engaged in market making activity
of the company covered by Analyst.
This document is solely for the personal information of the recipient, and must not be singularly used as the basis of any investment
decision. Nothing in this document should be construed as investment or financial advice. Each recipient of this document should
make such investigations as they deem necessary to arrive at an independent evaluation of an investment in the securities of the
companies referred to in this document (including the merits and risks involved), and should consult their own advisors to determine
the merits and risks of such an investment.
Reports based on technical and derivative analysis center on studying charts of a stock's price movement, outstanding positions and
trading volume, as opposed to focusing on a company's fundamentals and, as such, may not match with a report on a company's
fundamentals.
The information in this document has been printed on the basis of publicly available information, internal data and other reliable
sources believed to be true, but we do not represent that it is accurate or complete and it should not be relied on as such, as this
document is for general guidance only. Angel Broking Pvt. Limited or any of its affiliates/ group companies shall not be in any way
responsible for any loss or damage that may arise to any person from any inadvertent error in the information contained in this report.
Angel Broking Pvt. Limited has not independently verified all the information contained within this document. Accordingly, we cannot
testify, nor make any representation or warranty, express or implied, to the accuracy, contents or data contained within this document.
While Angel Broking Pvt. Limited endeavors to update on a reasonable basis the information discussed in this material, there may be
regulatory, compliance, or other reasons that prevent us from doing so.
This document is being supplied to you solely for your information, and its contents, information or data may not be reproduced,
redistributed or passed on, directly or indirectly.
Neither Angel Broking Pvt. Limited, nor its directors, employees or affiliates shall be liable for any loss or damage that may arise from
or in connection with the use of this information.
Note: Please refer to the important ‘Stock Holding Disclosure' report on the Angel website (Research Section). Also, please refer to the
latest update on respective stocks for the disclosure status in respect of those stocks. Angel Broking Pvt. Limited and its affiliates may
have investment positions in the stocks recommended in this report.
Disclosure of Interest Statement
BEL
1. Analyst ownership of the stock
No
2. Angel and its Group companies ownership of the stock
No
3. Angel and its Group companies' Directors ownership of the stock
No
4. Broking relationship with company covered
No
Note: We have not considered any Exposure below ` 1 lakh for Angel, its Group companies and Directors
Ratings (Based on expected returns
Buy (> 15%)
Accumulate (5% to 15%)
Neutral (-5 to 5%)
over 12 months investment period):
Reduce (-5% to -15%)
Sell (< -15)
December 17, 2015
19