3QFY2016 Result Update | Banking
March 3, 2016
Bank of Baroda
NEUTRAL
CMP
`145
Performance Highlights
Target Price
-
Particulars (` cr)
3QFY16 2QFY16
% chg (qoq) 3QFY15
% chg (yoy)
Investment Period
-
NII
2,705
3,244
(16.6)
3,286
(17.7)
Pre-prov. profit
1,704
2,337
(27.1)
2,339
(27.1)
Stock Info
PAT
(3,342)
124
(2,784.6)
334
(1,100.7)
Sector
Banking
Source: Company, Angel Research
Market Cap (` cr)
33,445
Beta
1.5
Bank of Baroda (BoB) took aggressive steps to clean up its balance sheet and
52 Week High / Low
216/109
recognized all the RBI identified weak accounts as NPA during the quarter
A vg. Daily Volume
1,00,08,585
(3QFY2016). Consequently the provisions went up substantially and the bank
Face Value (`)
2
reported a loss of `3,342cr.
BSE Sensex
24,243
Nifty
7,369
Substantial rise in provisions and decline in loan book resulted in loss at the net
Reuters Code
BOB.BO
level: During the quarter, the loan book declined by 2.4% yoy, while deposits grew
Bloomberg Code
BOB@IN
by 4.4% yoy. CASA deposits declined by 5.1% yoy and as a result the CASA ratio
declined to 24% vs 26.4% in 3QFY2015. Provisions went up 2.5x qoq and hence
Shareholding Pattern (%)
the bank reported a huge loss of `3,342cr compared to a PAT of `334cr in
Promoters
59.2
3QFY2015 and of `124.5cr in the sequential previous quarter. However, as the
bank has now recognized a large part of the troubled accounts and taken provisions
MF / Banks / Indian Fls
21.8
accordingly, we expect the profitability to improve from 1QFY2017 onwards.
FII / NRIs / OCBs
12.3
Indian Public / Others
6.7
Early recognition of stressed assets gives better clarity: BoB is the only bank in the
PSU space which has recognized all the AQR related accounts as NPAs. Further it
also has recognized certain stressed accounts as NPA during the quarter; as a
result the gross slippages went up substantially to `15,785cr. However, this gives
Abs. (%)
3m
1yr
3yr
better clarity on the asset quality of the bank. The Management doesn’t expect
Sensex
(7.2)
(17.7)
28.4
much pain in terms of asset quality, going ahead. The Gross NPA ratio went up
Bank of Baroda
(16.5)
(20.5)
2.6
substantially to 9.68% from 5.56% in 2QFY2016 (up 412bp qoq), while the Net
NPA ratio stood at 5.67% vs 3.08% in 2QFY2016. BoB has recognized a majority
3-years price chart
of its 5:25 and SDR accounts as NPAs; hence, most of the pain in terms of asset
250
quality now seems to be through for the bank.
200
Outlook and valuation: BoB is the only large PSU bank to have recognized all the
150
AQR accounts as NPA during the quarter. The Management’s intention to clean
up its balance sheet faster than others gives more clarity about the bank’s growth
100
prospects, going ahead. The bank is well capitalized with a CAR of 12.2% and
50
believes it will not need any fresh capital for the next 18-24 months. At the current
0
market price, the stock trades at a valuation of 0.9x FY2017E ABV. Although there
is more clarity on the bank’s asset quality now, in our view, the bank is trading at
a higher valuation multiple compared to its peers. Hence, we maintain our
Neutral view on the stock.
Source: Company, Angel Research
Key financials (Standalone)
Y/E March (` cr)
FY2014
FY2015
FY2016E
FY2017E
Vaibhav Agrawal
NII
11,965
13,187
14,260
16,102
022 - 3935 7800 Ext: 6808
% chg
5.7
10.2
8.1
12.9
Net profit
4,541
3,398
(1,631)
2,886
% chg
1.3
(25.2)
(148.0)
(277.0)
Siddharth Purohit
NIM (%)
2.0
2.0
2.0
2.2
022 - 3935 7800 Ext: 6872
EPS (`)
21.1
15.3
(7.4)
13.0
P/E (x)
6.9
9.5
(19.7)
11.2
P/ABV (x)
0.9
0.9
1.2
0.9
Chintan Shah
RoA (%)
0.8
0.5
(0.2)
0.4
022 - 4000 3600 Ext: 6828
RoE (%)
13.4
9.0
7.3
10.7
Source: Company, Angel Research; Note: CMP as of March 2, 2016
Please refer to important disclosures at the end of this report
1
Bank of Baroda | 3QFY2016 Result Update
Exhibit 1: 3QFY2016 performance (Standalone)
Particulars (` cr)
3QFY16
2QFY16
% chg (qoq)
3QFY15
% chg (yoy)
FY2015
FY2014
% chg
Interest earned
10,614
11,156
(4.9)
10,718
(1.0)
42,964
38,940
10.3
- on Advances / Bills
7,169
7,712
(7.0)
7,715
(7.1)
30,803
27,878
10.5
- on investments
2,686
2,739
(2.0)
2,464
9.0
9,701
8,696
11.6
- on balance with RBI & others
353
291
21.3
367
(3.6)
1,550
1,534
1.0
- on others
406
414
(2.0)
172
135.1
910
832
9.4
Interest Expended
7,909
7,912
(0.0)
7,432
6.4
29,776
26,974
10.4
Net Interest Income
2,705
3,244
(16.6)
3,286
(17.7)
13,187
11,965
10.2
Other income
1,113
1,144
(2.7)
1,090
2.1
4,402
4,463
(1.4)
Other income excl. treasury
824
920
(10.4)
847
(2.7)
3,395
3,719
(8.7)
- CEB
339
361
(6.2)
373
(9.2)
1,482
1,437
3.1
- Treasury Income
289
224
28.9
244
18.6
1,007
744
35.4
- Recoveries from written off a/cs
24
79
(69.7)
36
(33.5)
189
563
(66.5)
- Others
461
479
(3.9)
437
5.4
1,724
1,718
0.4
Operating income
3,818
4,389
(13.0)
4,376
(12.8)
17,589
16,428
7.1
Operating expenses
2,114
2,051
3.1
2,037
3.8
7,674
7,075
8.5
- Employee expenses
1,155
1,044
10.6
1,120
3.1
4,261
4,140
2.9
- Other Opex
959
1,008
(4.8)
918
4.5
3,413
2,935
16.3
Pre-provision Profit
1,704
2,337
(27.1)
2,339
(27.1)
9,915
9,353
6.0
Provisions & Contingencies
6,165
1,892
225.9
1,262
388.4
4,495
3,856
16.6
- Provisions for NPAs
6,474
1,844
251.1
1,150
463.0
3,997
2,968
34.7
- Provisions for Standard adv.
(373)
(79)
369.7
141
(364.5)
548
535
2.4
- Provisions for Investments
30
112
(73.2)
(50)
(159.8)
(149)
199
(175.2)
- Other Provisions
34
15
119.3
22
55.5
(51)
353
(114.4)
PBT
(4,460)
445
(1,101.6)
1,077
(514.2)
5,421
5,497
(1.4)
Provision for Tax
(1,118)
321
(448.6)
743
(250.6)
2,022
956
111.5
PAT
(3,342)
124
(2,784.6)
334
(1,100.7)
3,398
4,541
(25.2)
Effective Tax Rate (%)
25.1
72.0
(4697)bp
69.0
(4391)bp
37.3
17.4
1991bp
Source: Company, Angel Research
March 3, 2016
2
Bank of Baroda | 3QFY2016 Result Update
Exhibit 2: 3QFY2016 performance analysis (Standalone)
Particulars
3QFY16 2QFY16 % chg (qoq) 3QFY15 % chg (yoy)
Balance sheet
Advances (` cr)
3,84,272
4,14,900
(7.4)
3,93,631
(2.4)
Deposits (` cr)
5,89,687
6,12,458
(3.7)
5,64,600
4.4
Credit-to-Deposit Ratio (%)
65.2
67.7
(258)bp
69.7
(455)bp
Current deposits (` cr)
31,463
42,532
(26.0)
46,297
(32.0)
Saving deposits (` cr)
1,10,060
1,11,582
(1.4)
1,02,844
7.0
CASA deposits (` cr)
1,41,523
1,54,114
(8.2)
1,49,141
(5.1)
Global CASA ratio (%)
24.0
25.2
(116)bp
26.4
(242)bp
Domestic CASA ratio (%)
30.0
32.0
(198)bp
32.4
(245)bp
CAR (%)*
13.0
12.5
44bp
12.4
53bp
Tier 1 CAR (%)*
9.9
9.4
48bp
9.1
80bp
Profitability Ratios (%)
Dom. Cost of deposits
6.8
6.9
(14)bp
7.1
(35)bp
Dom. Yield on advances
9.6
10.4
(87)bp
11.0
(144)bp
Dom. Yield on investments
7.5
7.8
(25)bp
8.1
(62)bp
Dom. Reported NIM
2.1
2.7
(58)bp
2.9
(81)bp
Cost-to-income ratio
55.4
46.7
862bp
46.6
881bp
Asset quality
Gross NPAs (` cr)
38,934
23,710
64.2
15,453
152.0
Gross NPAs (%)
9.7
5.6
412bp
3.9
583bp
Net NPAs (` cr)
21,806
12,798
70.4
8,291
163.0
Net NPAs (%)
5.7
3.1
259bp
2.1
356bp
PCR incl. tech. w/offs (%)
52.7
58.2
(553)bp
62.4
(967)bp
Annualized slippage ratio (%)
14.8
6.5
824bp
3.1
1164bp
NPA prov. to avg. assets (%)
3.7
1.1
266bp
0.7
302bp
Source: Company, Angel Research * Basel III not comparable
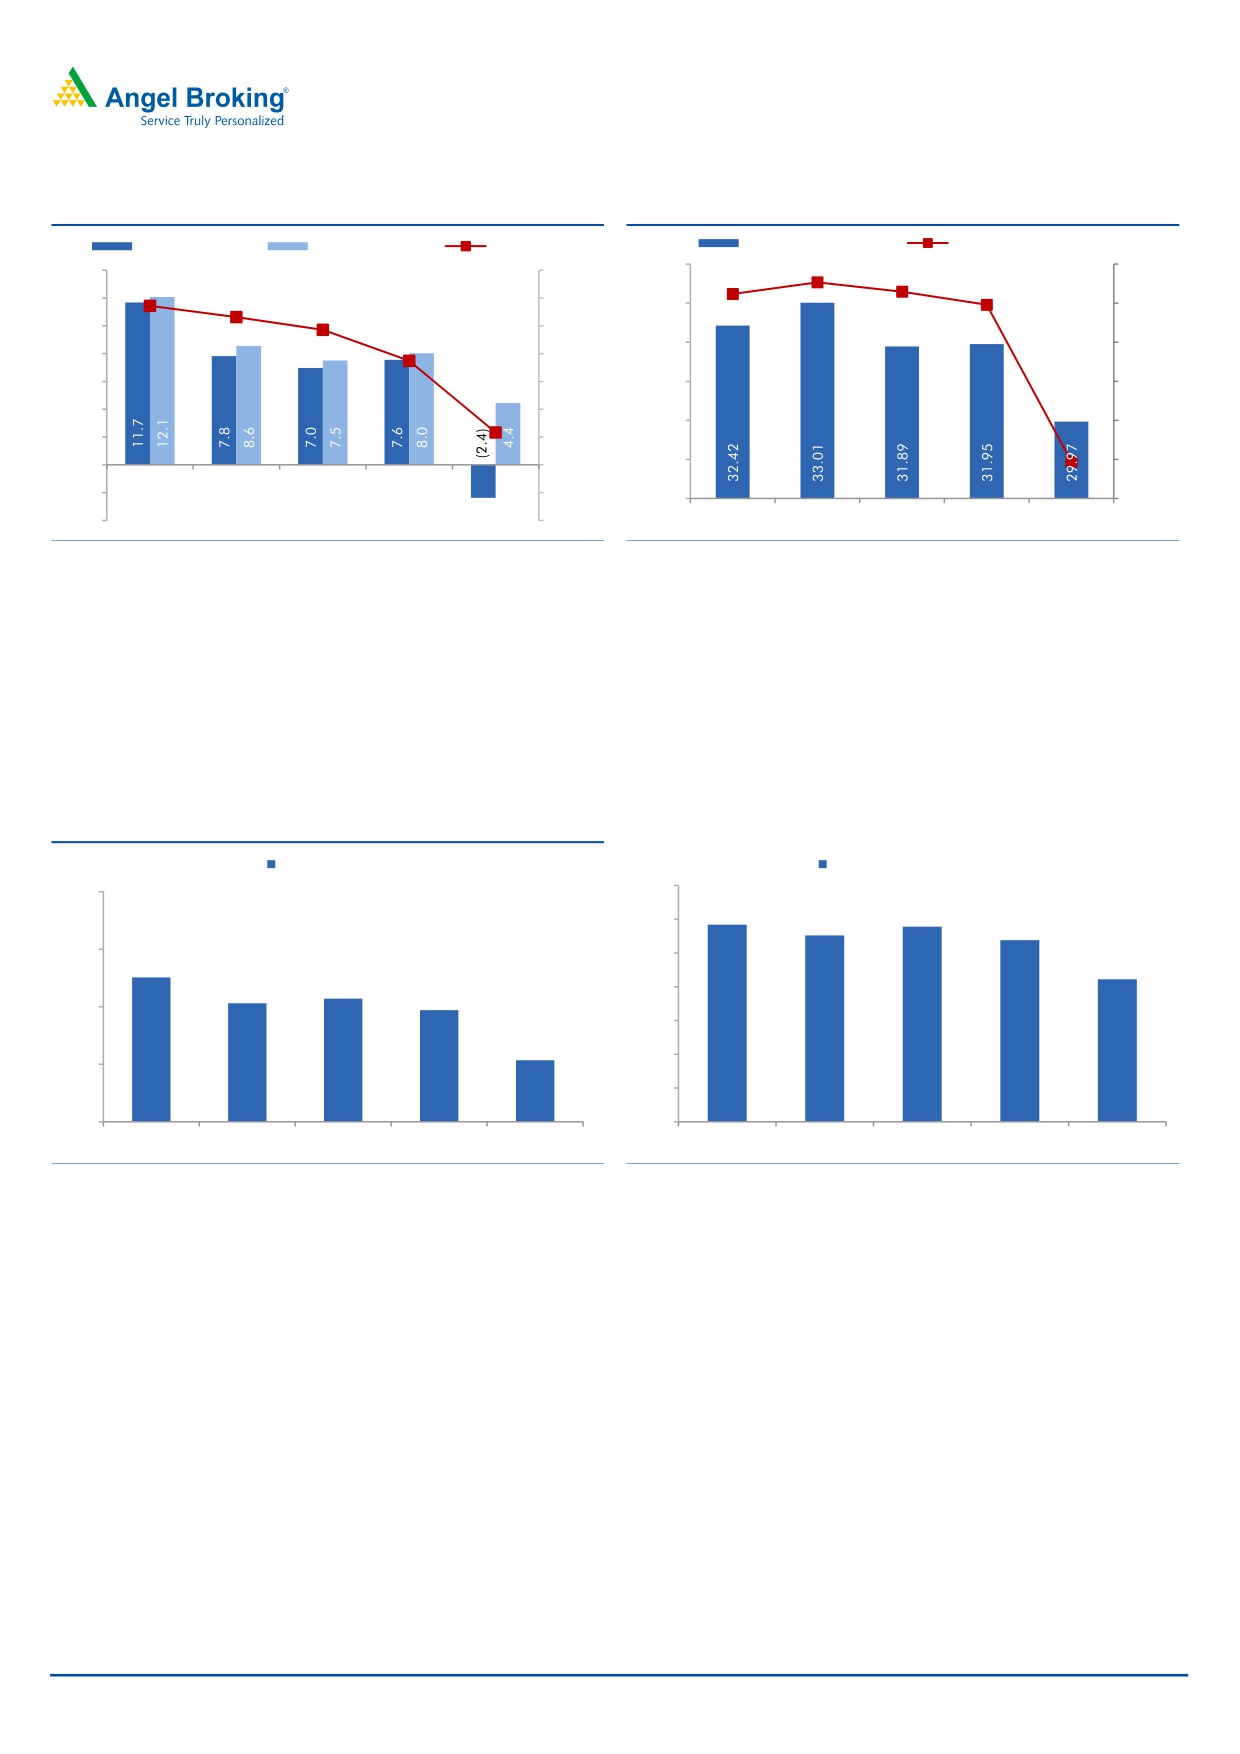
Substantial rise in provisions and decline in loan book resulted in
loss at the net level
During the quarter, the loan book declined by 2.4% yoy, while deposits grew by
4.4% yoy. CASA deposits declined by 5.1% yoy and as a result the CASA ratio
declined to 24% vs 26.4% in 3QFY2015. Global NIM dipped by 66bp qoq, largely
due to high reversal of interest owing to NPA recognition. The NII declined by
17.7% yoy due to decline in loan book and large reversal of interest. Provisions
went up 2.5x qoq and hence the bank reported a huge loss of `3,342cr compared
to a PAT of `334cr in 3QFY2015 and of `124.5cr in the sequential previous
quarter. However, as the bank has now recognized a large part of the troubled
accounts and taken provisions accordingly, we expect the profitability to improve
from 4QFY2016 onwards.
March 3, 2016
3
Bank of Baroda | 3QFY2016 Result Update
Exhibit 3: Advances decline
Exhibit 4: Domestic CASA ratio tumbles qoq
Adv. yoy chg (%)
Dep. yoy chg (%)
CDR (%, RHS)
Domestic CASA ratio
CASA yoy growth (%, RHS)
34.00
13.6
15.0
14.0
71.0
12.7
12.9
69.7
11.9
12.0
69.3
70.0
68.9
33.00
12.0
10.0
69.0
67.7
32.00
9.0
8.0
68.0
6.0
67.0
31.00
6.0
4.0
65.2
66.0
30.00
3.0
2.0
65.0
29.00
(0.2)
-
-
64.0
3QFY15
4QFY15
1QFY16
2QFY16
3QFY16
(2.0)
63.0
28.00
(3.0)
(4.0)
62.0
3QFY15
4QFY15
1QFY16
2QFY16
3QFY16
Source: Company, Angel Research
Source: Company, Angel Research
NIM dips qoq as well as yoy
During the quarter, global NIM dipped by 36bp qoq, domestic NIM declined by
58bp qoq, while the international NIM rose by 2bp qoq. The NIM dip was led by
an 87bp yoy fall in yield on earning assets as well as elevated slippages. In
addition, a reduction in the bank’s base rate during the beginning of the quarter
also levied pressure on the global and domestic NIM of the bank.
Exhibit 5: Yield on advances decline qoq...
Exhibit 6: ...causing Domestic NIM to drop by 58bp qoq
(%)
Yield on advances
(%)
Reported NIM - Domestic
3.50
12.5
2.92
2.89
3.00
2.76
2.69
11.5
2.50
11.01
2.11
10.56
10.64
2.00
10.44
10.5
1.50
9.57
1.00
9.5
0.50
8.5
0.00
3QFY15
4QFY15
1QFY16
2QFY16
3QFY16
3QFY15
4QFY15
1QFY16
2QFY16
3QFY16
Source: Company, Angel Research
Source: Company, Angel Research
Subdued non-interest income
During 3QFY2016, the bank’s non-interest income (excluding treasury) de-grew by
2.8% yoy led by decline in fee income and recoveries. However, treasury income
partially supported the overall fee income.
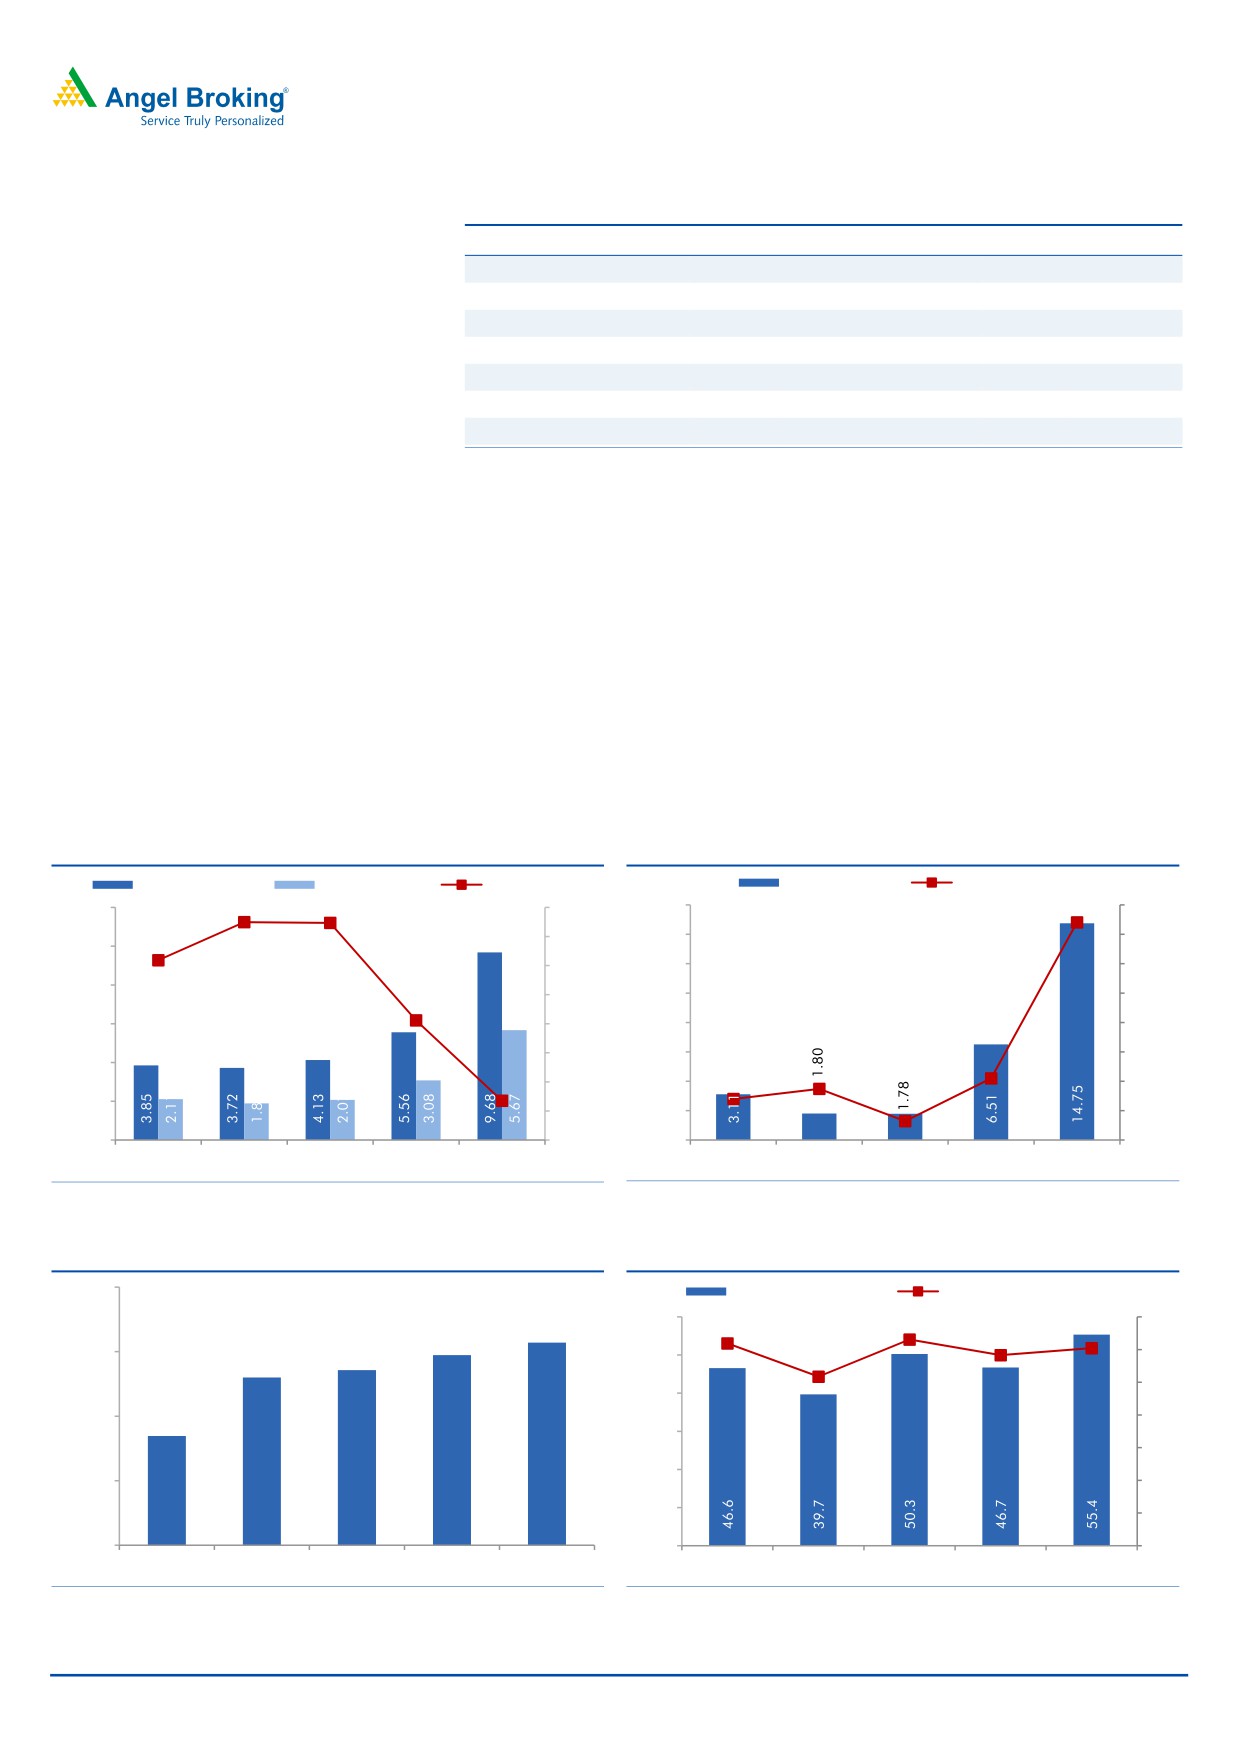
Moderate growth in operating expenses
Operating expenses grew by 3.8% yoy led by a rise of 3.1% yoy in employee
expenses as well as a 4.5% yoy rise in other expenses. The bank opened 65 new
branches during the quarter, taking the total number of branches to 5,271. The
Cost to income ratio stood at 55.4% for the quarter as against 46.6% in
3QFY2015.
March 3, 2016
4
Bank of Baroda | 3QFY2016 Result Update
Exhibit 7: Other income growth led by higher treasury gains
Particulars (` cr)
3QFY16
2QFY16
% chg (qoq) 3QFY15
% chg (yoy)
CEB
339
361
(6.2)
373
(9.2)
Treasury
289
224
28.9
244
18.6
Forex
241
253
(4.6)
253
(4.7)
Recoveries
24
79
(69.7)
36
(33.5)
Others
219
227
(3.4)
185
18.7
Other income
1,112
1,144
(2.8)
1,090
2.0
Other income excl. treasury
823
920
(10.5)
847
(2.8)
Source: Company, Angel Research
Early recognition of stressed assets gives better clarity
BoB is the only bank in the PSU space which has recognized all the AQR related
accounts as NPAs. Further it also has recognized certain stressed accounts as NPA
during the quarter; as a result the gross slippages went up substantially to
`15,785cr. However, this gives better clarity on the asset quality of the bank. The
Management doesn’t expect much pain in terms of asset quality, going ahead. The
Gross NPA ratio went up substantially to 9.68% from 5.56% in 2QFY2016 (up
412bp qoq), while the Net NPA ratio stood at 5.67% vs 3.08% in 2QFY2016. BoB
has recognized a majority of its 5:25 and SDR accounts as NPAs; hence, most of
the pain in terms of asset quality now seems to be through for the bank.
Exhibit 8: NPA ratios rises sharply
Exhibit 9: Slippages elevated at 14.8%
Gross NPAs (%)
Net NPAs (%)
PCR (%, RHS)
Slippages (%)
Credit cost (%, RHS)
12.00
65.0
66.0
16.00
3.70
4.00
64.9
62.4
64.0
14.00
3.50
10.00
62.0
12.00
3.00
8.00
60.0
10.00
2.50
58.2
6.00
58.0
8.00
2.00
56.0
6.00
1.50
4.00
52.7
0.70
1.05
54.0
4.00
1.00
2.00
52.0
2.00
0.87
0.50
0.32
-
50.0
-
-
3QFY15
4QFY15
1QFY16
2QFY16
3QFY16
3QFY15
4QFY15
1QFY16
2QFY16
3QFY16
Source: Company, Angel Research
Source: Company, Angel Research
Exhibit 10: Moderate pace of Branch expansion
Exhibit 11: Cost to income ratio rises sequentially
5,400
Cost-to-income ratio (%)
Opex to average assets (%, RHS)
60.0
1.2
1.3
1.4
5,271
1.2
1.2
5,242
5,250
5,207
50.0
1.0
1.2
5,190
1.0
40.0
5,100
5,054
0.8
30.0
0.6
20.0
4,950
0.4
10.0
0.2
4,800
-
0.0
3QFY15
4QFY15
1QFY16
2QFY16
3QFY16
3QFY15
4QFY15
1QFY16
2QFY16
3QFY16
Source: Company, Angel Research
Source: Company, Angel Research
March 3, 2016
5
Bank of Baroda | 3QFY2016 Result Update
Outlook and valuation: BoB is the only large PSU bank to have recognized all the
AQR accounts as NPA during the quarter. The Management’s intention to clean up
its balance sheet faster than others gives more clarity about the bank’s growth
prospects, going ahead. The bank is well capitalized with a CAR of 12.2% and
believes it will not need any fresh capital for the next 18-24 months. At the current
market price, the stock trades at a valuation of 0.9x FY2017E ABV. Although there
is more clarity on the bank’s asset quality now, in our view, the bank is trading at a
higher valuation multiple compared to its peers. Hence, we maintain our Neutral
view on the stock.
Exhibit 12: Recommendation summary
CMP
Tgt. Price
Upside
FY2017E
FY2017E Tgt.
FY2017E
FY15-17E EPS
FY2017E
FY2017E
Company
Reco.
(`)
(`)
(%)
P/ABV (x)
P/ABV (x)
P/E (x)
CAGR (%)
RoA (%)
RoE (%)
HDFCBk
Buy
1,008
1,262
25.2
3.0
3.8
16.5
22.4
1.9
19.7
ICICIBk*
Buy
220
254
15.2
1.5
1.3
9.0
13.5
1.6
14.7
YesBk
Neutral
754
-
-
2.0
2.0
10.8
20.5
1.6
19.6
AxisBk
Buy
407
494
21.3
1.6
2.0
9.4
18.4
1.8
18.9
SBI*
Neutral
181
-
-
1.0
0.7
8.7
8.3
0.6
11.2
FedBk
Neutral
50
-
-
0.9
0.9
9.0
(2.9)
0.9
10.8
SIB
Neutral
17
-
-
0.6
0.6
5.3
21.6
0.7
11.6
BOB
Neutral
145
-
-
0.9
0.9
11.2
(7.9)
0.4
7.3
PNB
Neutral
79
-
-
0.5
0.5
3.6
14.4
0.6
10.0
BOI
Neutral
93
-
-
0.2
0.8
2.8
14.0
0.3
7.6
IndBk
Neutral
84
-
-
0.2
0.2
2.8
19.4
0.6
8.6
Vijaya Bank
Neutral
33
-
-
0.4
0.4
4.9
14.1
0.4
8.8
OBC
Neutral
85
-
-
0.2
0.3
1.9
65.5
0.5
9.4
Allahabad BankNeutral
49
-
-
0.2
0.2
1.8
56.2
0.6
11.9
UnionBk
Neutral
121
-
-
0.4
0.3
3.1
18.1
0.6
11.4
CanBk
Neutral
177
-
-
0.3
0.2
2.5
12.0
0.6
11.2
IDBI#
Neutral
64
-
-
0.4
0.5
4.5
61.6
0.6
9.3
DenaBk
Neutral
27
-
-
0.2
0.3
2.7
45.6
0.4
7.9
Source: Company, Angel Research; Note:*Target multiples=SOTP Target Price/ABV (including subsidiaries), #Without adjusting for SASF
Company Background
Bank of Baroda (BoB) is the second-largest public sector bank in India with a
balance sheet size of ~`7.0lakh cr. The bank has a network of 5,271 domestic
branches and more than 8,600 ATMs, mainly in western India (accounts for ~40%
of total branch network). The bank has a strong presence overseas, with more than
32% of its advances coming from overseas branches.
March 3, 2016
6
Bank of Baroda | 3QFY2016 Result Update
Income statement (Standalone)
Y/E March (` cr)
FY12
FY13
FY14
FY15
FY16E
FY17E
NII
10,317
11,315
11,965
13,187
14,260
16,102
- YoY Growth (%)
17.2
9.7
5.7
10.2
8.1
12.9
Other Income
3,422
3,631
4,463
4,402
4,542
4,986
- YoY Growth (%)
21.8
6.1
22.9
(1.4)
3.2
9.8
Operating Income
13,739
14,946
16,428
17,589
18,802
21,088
- YoY Growth (%)
18.3
8.8
9.9
7.1
6.9
12.2
Operating Expenses
5,159
5,947
7,137
7,674
8,399
9,029
- YoY Growth (%)
11.4
15.3
20.0
7.5
9.4
7.5
Pre - Provision Profit
8,581
8,999
9,291
9,915
10,403
12,059
- YoY Growth (%)
22.9
4.9
3.2
6.7
4.9
15.9
Prov. & Cont.
2,555
4,168
3,794
4,495
12,897
7,646
- YoY Growth (%)
91.9
63.1
(9.0)
18.5
186.9
(40.7)
Profit Before Tax
6,026
4,831
5,497
5,421
(2,494)
4,413
- YoY Growth (%)
6.6
(19.8)
13.8
(1.4)
(146.0)
(277.0)
Prov. for Taxation
1,019
351
956
2,022
(863)
1,527
- as a % of PBT
16.9
7.3
17.4
37.3
34.6
34.6
PAT
5,007
4,481
4,541
3,398
(1,631)
2,886
- YoY Growth (%)
18.0
(10.5)
1.3
(25.2)
(148.0)
(277.0)
Balance sheet (Standalone)
Y/E March (` cr)
FY12
FY13
FY14
FY15
FY16E
FY17E
Share Capital
412
423
431
444
444
444
Reserves & Surplus
27,064
31,547
35,555
39,391
37,760
40,114
Deposits
3,84,871
4,73,883
5,68,894
6,17,560
6,17,560
6,91,667
- Growth (%)
26.0
23.1
20.0
8.6
-
12.0
Borrowings
14,171
17,178
25,411
23,709
23,702
26,454
Tier 2 Capital
9,402
9,402
11,402
11,555
11,266
10,984
Other Liab & Prov.
11,400
14,703
17,812
22,330
24,037
28,107
Total Liabilities
4,47,322
5,47,135
6,59,505
7,14,989
7,14,768
7,97,770
Cash balances
21,651
13,452
18,629
22,489
30,878
34,583
Bank balances
42,517
71,947
1,12,249
1,25,865
1,03,641
1,03,710
Investments
83,209
1,21,394
1,16,113
1,22,320
1,44,585
1,71,690
Advances
2,87,377
3,28,186
3,97,006
4,28,065
4,19,504
4,69,844
- Growth (%)
25.7
14.2
21.0
7.8
(2.0)
12.0
Fixed Assets
2,342
2,453
2,734
2,875
2,788
3,018
Other Assets
10,225
9,704
12,774
13,376
13,372
14,924
Total Assets
4,47,322
5,47,135
6,59,505
7,14,989
7,14,768
7,97,770
- Growth (%)
24.8
22.3
20.5
8.4
(0.0)
11.6
March 3, 2016
7
Bank of Baroda | 3QFY2016 Result Update
Ratio analysis (Standalone)
Y/E March
FY12
FY13
FY14
FY15
FY16E
FY17E
Profitability ratios (%)
NIMs
2.6
2.3
2.0
2.0
2.0
2.2
Cost to Income Ratio
37.5
39.8
43.4
43.6
44.7
42.8
RoA
1.2
0.9
0.8
0.5
(0.2)
0.4
RoE
20.6
15.1
13.4
9.0
(4.2)
7.3
B/S ratios (%)
CASA Ratio
26.9
25.3
25.7
26.4
29.6
30.1
Credit/Deposit Ratio
74.7
69.3
69.8
69.3
67.9
67.9
CAR
14.7
12.1
12.3
12.4
11.9
11.2
- Tier I
10.8
9.2
9.3
9.5
9.1
8.6
Asset Quality (%)
Gross NPAs
1.5
2.4
2.9
3.7
9.9
9.2
Net NPAs
0.5
1.3
1.5
1.9
5.4
3.7
Slippages
1.5
2.4
2.1
2.1
7.0
3.0
Loan Loss Prov. /Avg. Assets
0.4
0.6
0.5
0.6
1.8
1.0
Provision Coverage
80.1
68.2
65.5
62.5
53.0
65.0
Per Share Data (`)
EPS
24.3
21.2
21.1
15.3
(7.4)
13.0
ABVPS (75% cover.)
133.3
147.1
159.4
167.5
124.9
160.4
DPS
17.0
21.5
25.2
18.3
0.0
12.0
Valuation Ratios
PER (x)
6.0
6.8
6.9
9.5
(19.7)
11.2
P/ABVPS (x)
1.1
1.0
0.9
0.9
1.2
0.9
Dividend Yield
11.7
14.8
17.3
12.6
0.0
8.3
DuPont Analysis
NII
2.6
2.3
2.0
1.9
2.0
2.1
(-) Prov. Exp.
0.6
0.8
0.6
0.7
1.8
1.0
Adj. NII
1.9
1.4
1.4
1.3
0.2
1.1
Treasury
0.2
0.1
0.1
0.1
0.2
0.2
Int. Sens. Inc.
2.1
1.6
1.5
1.4
0.4
1.3
Other Inc.
0.7
0.6
0.6
0.5
0.5
0.5
Op. Inc.
2.8
2.2
2.1
1.9
0.8
1.8
Opex
1.3
1.2
1.2
1.1
1.2
1.2
PBT
1.5
1.0
0.9
0.8
(0.3)
0.6
Taxes
0.3
0.1
0.2
0.3
(0.1)
0.2
RoA
1.2
0.9
0.8
0.5
(0.2)
0.4
Leverage
16.6
16.7
17.8
18.1
18.3
19.2
RoE
20.6
15.1
13.4
9.0
(4.2)
7.3
March 3, 2016
8
Bank of Baroda | 3QFY2016 Result Update
Research Team Tel: 022 - 39357800
DISCLAIMER
Angel Broking Private Limited (hereinafter referred to as “Angel”) is a registered Member of National Stock Exchange of India Limited,
Bombay Stock Exchange Limited and Metropolitan Stock Exchange of India Limited. It is also registered as a Depository Participant with
CDSL and Portfolio Manager with SEBI. It also has registration with AMFI as a Mutual Fund Distributor. Angel Broking Private Limited is
a registered entity with SEBI for Research Analyst in terms of SEBI (Research Analyst) Regulations, 2014 vide registration number
INH000000164. Angel or its associates has not been debarred/ suspended by SEBI or any other regulatory authority for accessing
/dealing in securities Market. Angel or its associates including its relatives/analyst do not hold any financial interest/beneficial
ownership of more than 1% in the company covered by Analyst. Angel or its associates/analyst has not received any compensation /
managed or co-managed public offering of securities of the company covered by Analyst during the past twelve months. Angel/analyst
has not served as an officer, director or employee of company covered by Analyst and has not been engaged in market making activity
of the company covered by Analyst.
This document is solely for the personal information of the recipient, and must not be singularly used as the basis of any investment
decision. Nothing in this document should be construed as investment or financial advice. Each recipient of this document should
make such investigations as they deem necessary to arrive at an independent evaluation of an investment in the securities of the
companies referred to in this document (including the merits and risks involved), and should consult their own advisors to determine
the merits and risks of such an investment.
Reports based on technical and derivative analysis center on studying charts of a stock's price movement, outstanding positions and
trading volume, as opposed to focusing on a company's fundamentals and, as such, may not match with a report on a company's
fundamentals.
The information in this document has been printed on the basis of publicly available information, internal data and other reliable
sources believed to be true, but we do not represent that it is accurate or complete and it should not be relied on as such, as this
document is for general guidance only. Angel Broking Pvt. Limited or any of its affiliates/ group companies shall not be in any way
responsible for any loss or damage that may arise to any person from any inadvertent error in the information contained in this report.
Angel Broking Pvt. Limited has not independently verified all the information contained within this document. Accordingly, we cannot
testify, nor make any representation or warranty, express or implied, to the accuracy, contents or data contained within this document.
While Angel Broking Pvt. Limited endeavors to update on a reasonable basis the information discussed in this material, there may be
regulatory, compliance, or other reasons that prevent us from doing so.
This document is being supplied to you solely for your information, and its contents, information or data may not be reproduced,
redistributed or passed on, directly or indirectly.
Neither Angel Broking Pvt. Limited, nor its directors, employees or affiliates shall be liable for any loss or damage that may arise from
or in connection with the use of this information.
Note: Please refer to the important ‘Stock Holding Disclosure' report on the Angel website (Research Section). Also, please refer to the
latest update on respective stocks for the disclosure status in respect of those stocks. Angel Broking Pvt. Limited and its affiliates may
have investment positions in the stocks recommended in this report.
Disclosure of Interest Statement
Bank of Baroda
1. Analyst ownership of the stock
No
2. Angel and its Group companies ownership of the stock
No
3. Angel and its Group companies' Directors ownership of the stock
No
4. Broking relationship with company covered
No
Note: We have not considered any Exposure below ` 1 lakh for Angel, its Group companies and Directors
Ratings (Based on expected returns
Buy (> 15%)
Accumulate (5% to 15%)
Neutral (-5 to 5%)
over 12 months investment period):
Reduce (-5% to -15%)
Sell (< -15)
March 3, 2016
9