1QFY2017 Result Update | Cons. Durables
August 16, 2016
Bajaj Electricals
ACCUMULATE
CMP
`245
Performance highlights
Target Price
`277
Y/E March (` cr)
1QFY17
1QFY16
% yoy
4QFY16
% qoq
Investment Period
12 months
Net sales
952
996
(4.5)
1,357
(29.9)
EBITDA
56
55
2.0
74
(24.2)
Stock Info
EBITDA Margin (%)
5.9
5.6
37
5.5
44
Sector
Consumer durables
Adjusted PAT
22
20
12.2
35
(36.3)
Market Cap (` cr)
2,566
Source: Company, Angel Research
Net Debt
93.4
For 1QFY2017, Bajaj Electricals (BEL)’ top-line and bottom-line have come in
Beta
1.0
below our estimates. The top-line growth was dampened by the poor
52 Week High / Low
280 / 155
performance of the Consumer durables and E&P segments. However, on the
Avg. Daily Volume
251,779
bottom-line front, the company reported a modest growth due to slight
Face Value (`)
2
improvement in the operating performance and lower interest cost, depreciation
BSE Sensex
28,152
cost and taxes.
Nifty
8,672
Top-line de-grew 5% yoy: The top-line de-grew by ~5% YoY to `952cr (below our
Reuters Code
BJEL.BO
estimate of `1,188cr), mainly due to de-growth of 8% YoY in the Consumer
Bloomberg Code
BJE.IN
Durables segment to `548cr and lower growth of ~1% YoY in the E&P segment to
`414cr.
Shareholding Pattern (%)
Despite revenue de-growth, PAT grew ~12%: On the operating front, the company
Promoters
63.6
reported a mild margin improvement (OPM up by 37bp YoY to 5.9%), primarily
on account of lower raw material costs during the quarter. The reported net profit
MF / Banks / Indian Fls
5.9
grew by ~12% YoY to `22cr, again underperforming our estimate of `27cr, on
FII / NRIs / OCBs
9.5
account of lower sales growth.
Indian Public / Others
21.0
Outlook and valuation: On expectation of timely execution of new projects in the
E&P segment and with the Lighting and Consumer Durables segments expected to
Abs.(%)
3m 1yr 3yr
benefit from an improvement in consumer sentiments going forward, we expect
Sensex
9.2
2.3
48.6
the company’s top-line to grow at a CAGR of ~12% to `5,805cr and bottom-line
BEL
9.3
(4.8)
58.8
to grow at a CAGR of 24% to `147cr over FY2016-FY2018E. We retain our
Accumulate rating on the stock with a revised target price of `277.
Key financials
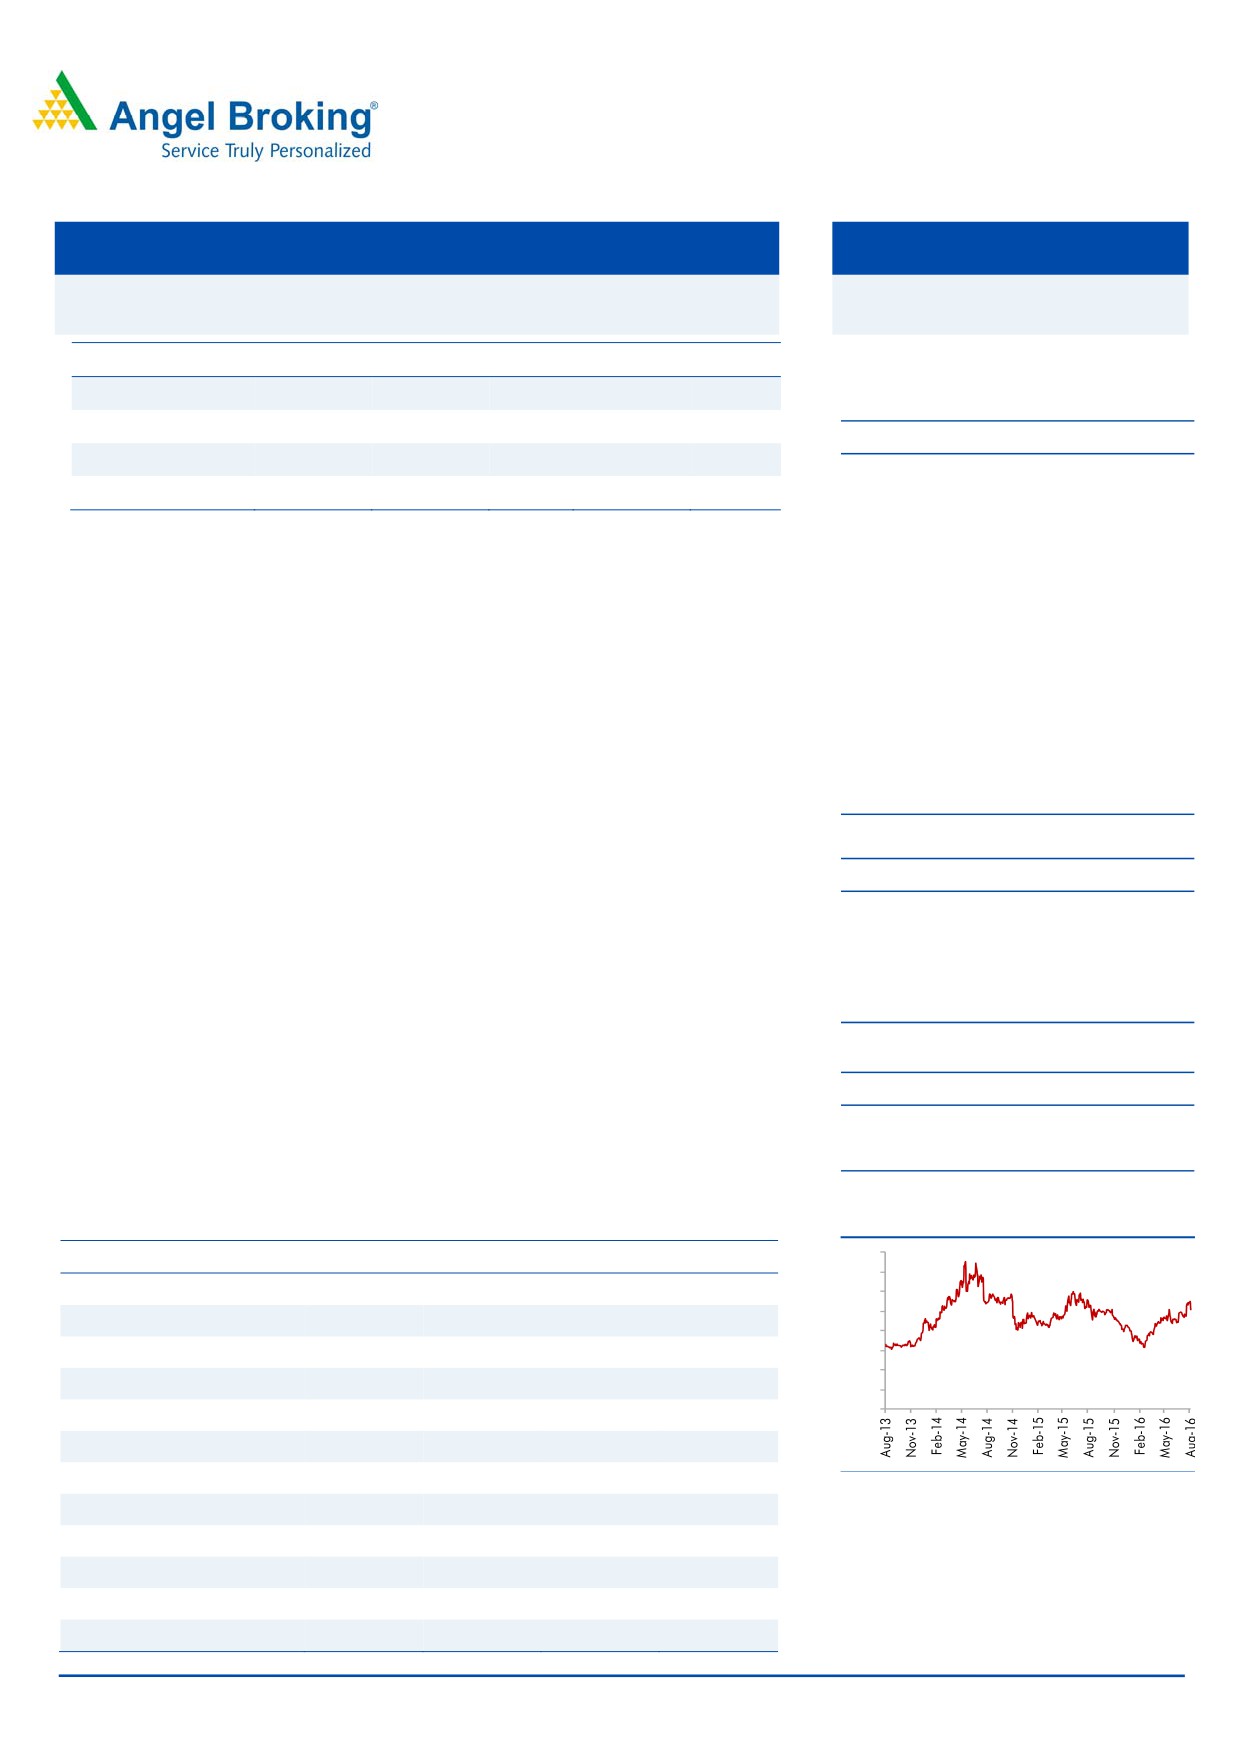
3-Year Daily Price Chart
400
Y/E March (` cr)
FY2015
FY2016
FY2017E
FY2018E
350
Net Sales
4,258
4,612
5,099
5,805
300
250
% chg
5.7
8.3
10.6
13.8
200
Net Profit
(14)
96
115
147
150
100
% chg
(14.0)
95.6
114.8
147.2
50
0
EBITDA Margin (%)
2.1
5.6
5.6
5.9
EPS (`)
(1.4)
9.5
11.4
14.6
P/E (x)
(177.3)
25.9
21.5
16.8
Source: Company, Angel Research
P/BV (x)
3.6
3.2
2.9
2.6
RoE (%)
6.2
12.5
13.4
15.1
RoCE (%)
10.6
23.7
23.9
26.2
Amarjeet S maurya
EV/Sales (x)
0.7
0.6
0.5
0.4
+91 22 3935 7800 Ext: 6831
EV/EBITDA (x)
19.1
9.9
8.9
7.4
Source: Company, Angel Research; Note: CMP as of August 16, 2016
Please refer to important disclosures at the end of this report
1
Bajaj Electricals | 1QFY2017 Result Update
Exhibit 1: 1QFY2017 performance highlights
Y/E March (` cr)
1QFY17
1QFY16
% yoy
4QFY16
% qoq
FY2016
FY2015
% chg
Net Sales
952
996
(4.5)
1,357
(29.9)
4,612
4,263
8.2
Consumption of RM
628
716
(12.3)
829
(24.2)
3,082
3,060
0.7
(% of Sales)
66.0
71.9
61.1
66.8
71.8
Staff Costs
79
58
36.2
81
(2.5)
284
226
25.4
(% of Sales)
8.3
5.8
5.9
6.2
5.3
Other Expenses
189
167
13.1
374
(49.4)
987.16
888.34
11.1
(% of Sales)
19.8
16.8
27.5
21.4
20.8
Total Expenditure
895
941
(4.9)
1,283
(30.2)
4,353
4,174
4.3
Operating Profit
56
55
2.0
74
(24.2)
259
88
193.6
OPM
5.9
5.6
5.5
5.6
2.1
Interest
23
25
(10.3)
22
3.3
101
104
(2.9)
Depreciation
7
7
(4.7)
7
(3.2)
27
29
(6.2)
Other Income
10
12
(17.5)
8
25.7
23
24
(5.9)
PBT (excl. Ext Items)
37
35
5.6
53
(31.0)
154
(21)
(837.7)
Ext (Income)/Expense
PBT (incl. Ext Items)
37
35
5.6
53
(31.0)
154
(21)
(837.7)
(% of Sales)
3.9
3.5
3.9
3.3
(0.5)
Provision for Taxation
14
14
19
58
(7)
(944.0)
(% of PBT)
37.7
41.2
34.8
38
33
Reported PAT
23
20
11.9
35
(34.1)
96
(14)
(785.4)
PATM
2.4
2.1
2.6
2.1
(0.3)
Minority Interest After NP
Extra-ordinary Items
1
1
Reported PAT
22
20.0
12.2
35
(36.3)
96
(14)
(785.4)
Equity shares (cr)
10
10
10
10
10
FDEPS (`)
2.2
2.0
12.2
3.4
(36.3)
9.5
(1.4)
(785.4)
Source: Company, Angel Research
Exhibit 2: Segment-wise performance
Y/E Mar (` cr)
1QFY17
1QFY16
% yoy
4QFY16
% qoq
Total Revenue
A) Lighting
548
593
(7.6)
327
67.7
B) E&P
414
412
0.5
486
(14.8)
EBIT
A) Lighting
23
12
100.3
21
12.9
B) E&P
19
38
(50.1)
27
(30.2)
EBIT Margin (%)
A) Lighting
7.2
4.2
7.5
B) E&P
3.4
6.9
5.0
Source: Company, Angel Research
August 16, 2016
2
Bajaj Electricals | 1QFY2017 Result Update
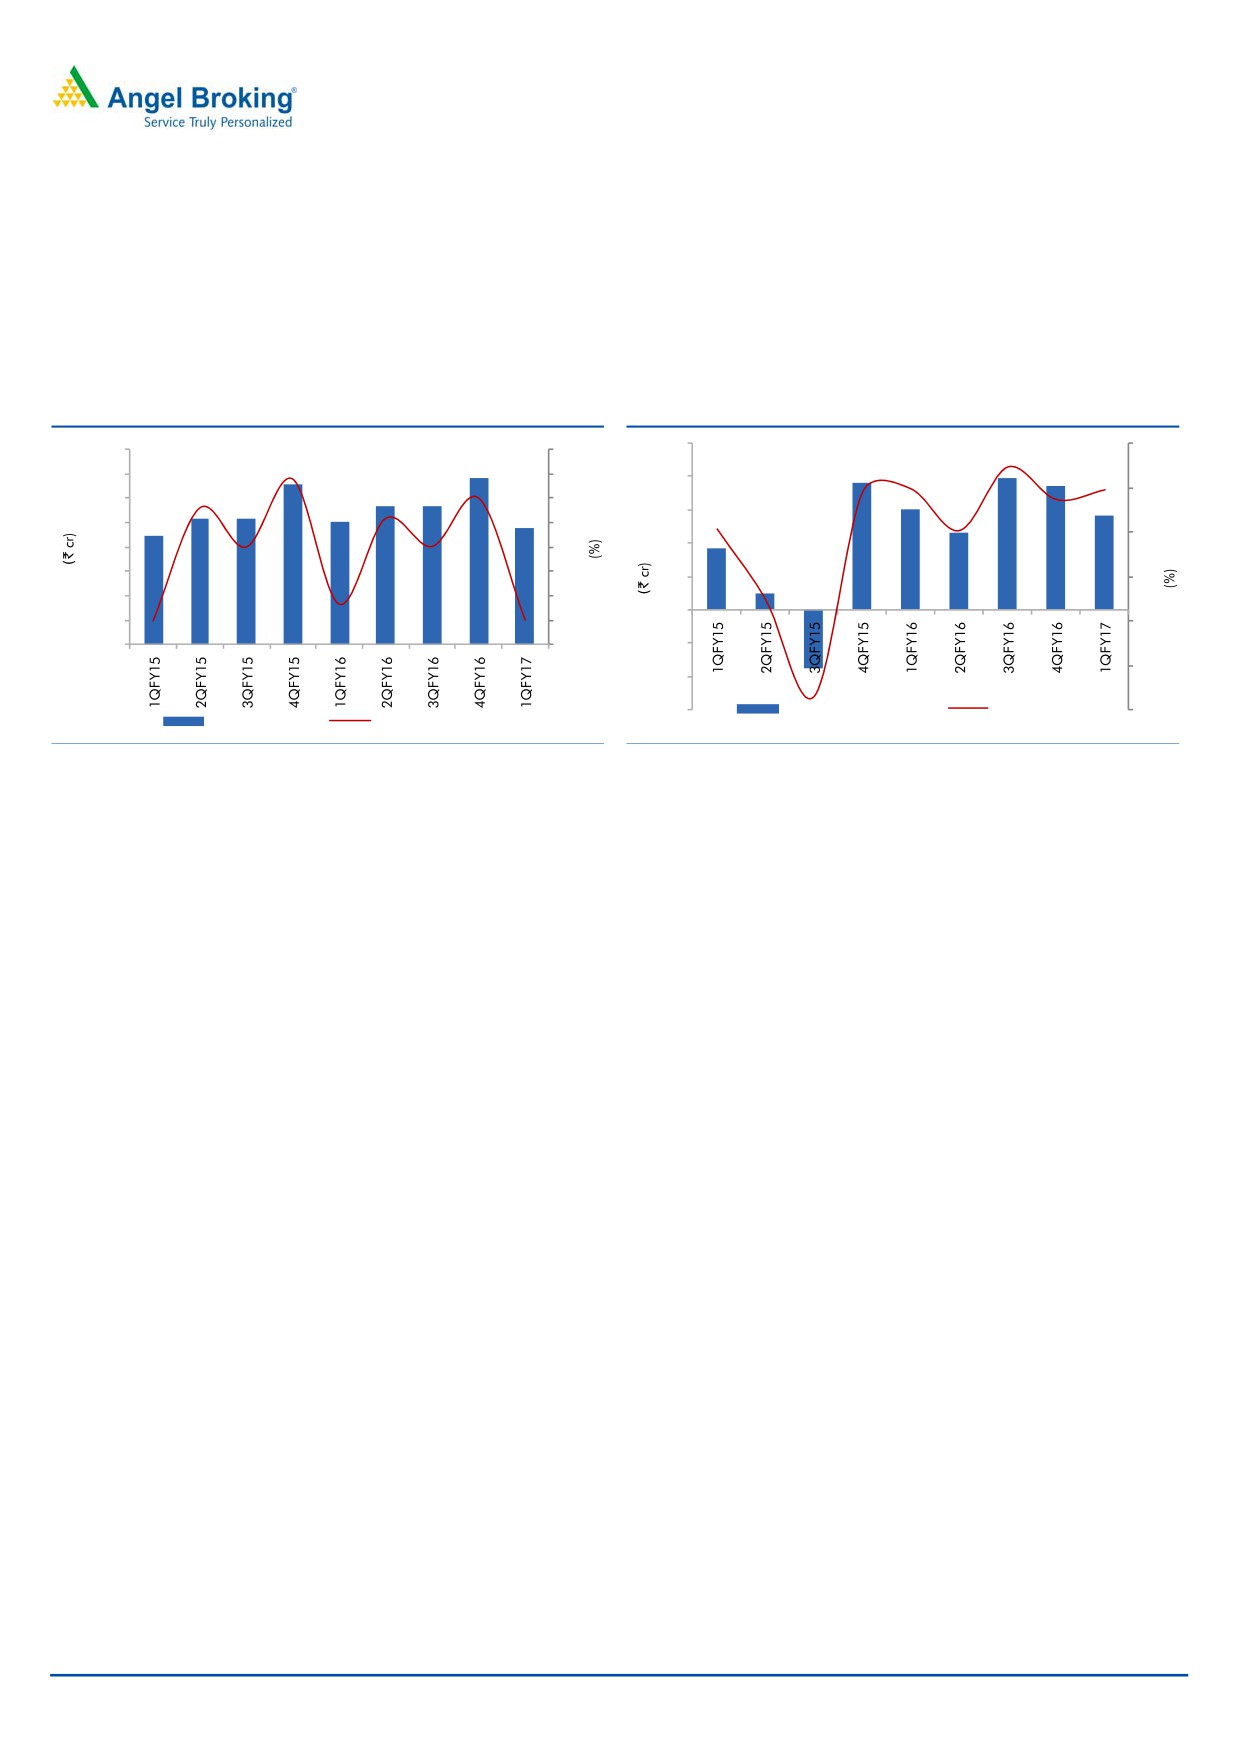
Poor performance of Consumer durables segment dragged
the overall top-line growth
The top-line de-grew by ~5% YoY to `952cr (below our estimate of `1,188cr),
mainly due to de-growth of 8% YoY in the Consumer durables segment to `548cr
and lower growth of ~1% YoY in the E&P segment to `414cr.
Exhibit 3: Historical top-line trend
Exhibit 4: Historical operating performance trend
100
8
1,600
40
1,400
30
80
6
1,200
20
60
1,000
10
4
800
0
40
600
(10)
20
2
400
(20)
0
200
(30)
0
0
(40)
(20)
(2)
(40)
(60)
Operating Profit (LHS)
Margin (RHS)
(4)
Net Sales (LHS)
qoq growth (RHS)
Source: Company, Angel Research
Source: Company, Angel Research
Despite revenue de-growth, PAT grew ~12% yoy
On the operating front, the company reported a mild margin improvement (OPM
up by 37bp YoY to 5.9%), primarily on account of lower raw material costs during
the quarter. The reported net profit grew by ~12% YoY to `22cr, underperforming
our estimate of `27cr, on account of lower sales growth
August 16, 2016
3
Bajaj Electricals | 1QFY2017 Result Update
Investment Rationale
Strong brands, leading market position and successful
implementation of replenishment strategy - the key drivers
BEL has a strong brand positioning and a well-spread distribution network in
comparison to its peers. It has collaborated with known global brands in each of
its segments which has enabled it to grow at a robust pace over the years. The
company has a leading position in consumer durables, ie in mixers, water heaters,
fans, toasters, OTG and mixers.
Exhibit 5: Strong brand associations
Products
Brand
Luminaries
Trilux Lenze (Germany)
Street Lights
CREE Lighting (USA), Disano (Italy)
Building management systems
Delta Controls (Canada)
LED
Rudd (US)
Appliances
Morphy Richards (UK), Nardi (Italy)
Fans
Disney (USA), Media (China)
Fire alarm system
Securiton (Switzerland)
Source: Company
BEL has revamped its product portfolio by discarding the non-performing products
and introducing new products with better quality in addition to introduction of
premium range products across categories. Though in the near term, there might
be some pressure in terms of demand due to slackness in the market, but the
outlook is positive post FY2017 as is being expected by most industry players. With
per capita income on the rise for the urban population, discretionary spends are
expected to increase, which will drive growth for the Consumer durables segment.
Its high-end products also have a growing acceptance with consistent performance
from brands like Morphy Richards.
Further, the government’s ambitious plan to build smart cities will require smart
lighting solutions and this will resultantly drive growth for the company’s Lighting
segment considering its well established position. Also, increasing focus on the LED
division would ensure that decline in CFL due to switch of consumer preference
would be addressed appropriately.
August 16, 2016
4
Bajaj Electricals | 1QFY2017 Result Update
Outlook and Valuation
On expectation of timely execution of new projects in the E&P segment and with
the Lighting and Consumer Durables segments expected to benefit from an
improvement in consumer sentiments going forward, we expect the company’s
top-line to grow at a CAGR of ~12% to `5,805cr and bottom-line to grow at a
CAGR of 24% to `147cr over FY2016-FY2018E. We retain our Accumulate rating
on the stock with a revised target price of `277.
Company Background
BEL is a diversified company with interests in Lighting, Luminaries, Appliances,
Fans, and Engineering & Projects. It has a strong network of more than 1,000
distributors and 5,000 dealers.
Key Concerns
Currency fluctuation: BEL has a substantial part of its products imported from
various associate foreign brands which pose a risk of currency fluctuation,
thereby impacting profitability.
Inflation: Inflationary pressure would resist volume pick up.
August 16, 2016
5
Bajaj Electricals | 1QFY2017 Result Update
Profit and loss statement
Y/E March (` cr)
FY13
FY14
FY15
FY16
FY17E
FY18E
Total operating income
3,377
4,030
4,258
4,612
5,099
5,805
% chg
9.0
19.3
5.7
8.3
10.6
13.8
Total Expenditure
3,223
3,884
4,113
4,353
4,811
5,462
Cost of Materials
2,655
2,959
3,082
3,082
3,466
3,958
Personnel
167
186
226
284
331
406
Others Expenses
401
739
804
987
1,014
1,098
EBITDA
154
145
146
259
288
343
% chg
(44.7)
(5.5)
0.0
78.2
11.0
19.3
(% of Net Sales)
4.6
3.6
3.4
5.6
5.6
5.9
Depreciation& Amortisation
14
25
29
27
34
37
EBIT
140
121
117
232
253
306
% chg
(47.5)
(13.5)
(3.5)
99.3
9.1
20.8
(% of Net Sales)
4.1
3.0
2.7
5.0
5.0
5.3
Interest & other Charges
69
78
105
101
105
110
Other Income
42
15
24
23
23
23
(% of PBT)
37.0
26.3
68.0
14.9
13.4
10.5
Share in profit of Associates
-
-
-
-
-
-
Recurring PBT
112
58
36
154
171
219
% chg
(48.4)
(48.6)
(38.0)
330.1
11.6
27.9
Prior Period & Extraord. Exp./(Inc.)
-
-
-
-
-
-
PBT (reported)
112
58
36
154
171
219
Tax
18
(1)
(7)
58
57
72
(% of PBT)
15.8
(1.1)
(19.2)
37.7
33.0
33.1
PAT (reported)
94
58
43
96
115
147
Add: Share of earnings of asso.
-
-
-
-
-
-
ADJ. PAT
94
58
43
96
115
147
% chg
32.9
(5.3)
(14.0)
95.6
114.8
147.2
(% of Net Sales)
2.8
1.4
1.0
2.1
2.3
2.5
Basic EPS (`)
3.3
(0.5)
(1.4)
9.5
11.4
14.6
Fully Diluted EPS (`)
3.3
(0.5)
(1.4)
9.5
11.4
14.6
% chg
(72.1)
(116.2)
162.7
(785.4)
20.1
28.2
August 16, 2016
6
Bajaj Electricals | 1QFY2017 Result Update
Balance sheet
Y/E March (` cr)
FY13
FY14
FY15
FY16
FY17E
FY18E
SOURCES OF FUNDS
Equity Share Capital
20
20
20
20
20
20
Reserves& Surplus
709
689
667
747
839
950
Shareholders Funds
729
709
687
767
859
970
Minority Interest
-
-
-
-
-
-
Total Loans
166
348
409
212
200
200
Deferred Tax Liability
17
16
13
13
13
13
Total Liabilities
914
1,077
1,111
992
1,072
1,183
APPLICATION OF FUNDS
Gross Block
326
372
432
472
512
552
Less: Acc. Depreciation
97
120
152
179
213
251
Net Block
229
252
280
293
299
301
Capital Work-in-Progress
6
3
3
3
3
3
Investments
30
67
59
59
59
59
Current Assets
1,887
2,341
2,441
2,333
2,447
2,661
Inventories
421
447
475
505
559
620
Sundry Debtors
938
1,235
1,290
1,365
1,509
1,654
Cash
50
54
38
59
63
68
Loans & Advances
142
137
167
55
112
87
Other Assets
336
467
471
349
204
232
Current liabilities
1,263
1,627
1,734
1,758
1,798
1,904
Net Current Assets
625
714
707
575
649
757
Deferred Tax Asset
25
42
62
62
62
62
Mis. Exp. not written off
-
-
-
-
-
-
Total Assets
914
1,077
1,111
992
1,072
1,183
August 16, 2016
7
Bajaj Electricals | 1QFY2017 Result Update
Cash Flow Statement
Y/E March (` cr)
FY13
FY14
FY15
FY16E
FY17E
FY18E
Profit before tax
69
(6)
(21)
154
171
220
Depreciation
14
25
29
27
34
37
Change in Working Capital
12
(130)
(42)
153
(70)
(103)
Interest / Dividend (Net)
66
73
100
101
105
110
Direct taxes paid
(40)
1
7
(58)
(57)
(72)
Others
19
31
15
-
-
-
Cash Flow from Operations
141
(7)
88
378
184
191
(Inc.)/ Dec. in Fixed Assets
14
(114)
(41)
(40)
(40)
(40)
(Inc.)/ Dec. in Investments
14
(38)
8
-
-
-
Cash Flow from Investing
(0)
(76)
(49)
(40)
(40)
(40)
Issue of Equity
1
4
13
-
-
-
Inc./(Dec.) in loans
-
-
-
(197)
(12)
-
Dividend Paid (Incl. Tax)
(28)
(20)
(15)
(15)
(23)
(37)
Interest / Dividend (Net)
(116)
106
(51)
(104)
(105)
(110)
Cash Flow from Financing
(142)
89
(53)
(316)
(140)
(147)
Inc./(Dec.) in Cash
(2)
6
(14)
21
4
5
Opening Cash balances
52
48
52
38
59
63
Closing Cash balances
50
54
38
59
63
68
August 16, 2016
8
Bajaj Electricals | 1QFY2017 Result Update
Key Ratios
Y/E March
FY13
FY14
FY15
FY16
FY17E FY18E
Valuation Ratio (x)
P/E (on FDEPS)
75.3
(465.8)
(177.3)
25.9
21.5
16.8
P/CEPS
37.7
127.2
164.0
20.1
16.6
13.4
P/BV
3.4
3.5
3.6
3.2
2.9
2.6
Dividend yield (%)
0.8
0.6
0.6
0.6
0.9
1.5
EV/Sales
0.8
0.7
0.7
0.6
0.5
0.4
EV/EBITDA
16.6
18.6
19.1
9.9
8.9
7.4
EV / Total Assets
1.2
1.0
1.0
0.9
0.9
0.8
Per Share Data (`)
EPS (Basic)
3.3
(0.5)
(1.4)
9.5
11.4
14.6
EPS (fully diluted)
3.3
(0.5)
(1.4)
9.5
11.4
14.6
Cash EPS
6.5
1.9
1.5
12.2
14.8
18.3
DPS
2.0
1.5
1.5
1.5
2.3
3.6
Book Value
72.2
70.2
68.1
76.0
85.1
96.1
Returns (%)
ROCE
15.6
11.4
10.6
23.7
23.9
26.2
Angel ROIC (Pre-tax)
17.1
12.9
11.7
27.0
27.0
29.4
ROE
12.9
8.2
6.2
12.5
13.4
15.1
Turnover ratios (x)
Asset Turnover (Gross Block)
10.4
10.8
9.9
9.8
10.0
10.5
Inventory / Sales (days)
46
40
41
40
40
39
Receivables (days)
101
112
111
108
108
104
Payables (days)
49
50
49
50
51
52
WC cycle (ex-cash) (days)
98
103
102
98
97
91
August 16, 2016
9
Bajaj Electricals | 1QFY2017 Result Update
Research Team Tel: 022 - 39357800
DISCLAIMER
Angel Broking Private Limited (hereinafter referred to as “Angel”) is a registered Member of National Stock Exchange of India Limited,
Bombay Stock Exchange Limited and Metropolitan Stock Exchange Limited. It is also registered as a Depository Participant with CDSL
and Portfolio Manager with SEBI. It also has registration with AMFI as a Mutual Fund Distributor. Angel Broking Private Limited is a
registered entity with SEBI for Research Analyst in terms of SEBI (Research Analyst) Regulations, 2014 vide registration number
INH000000164. Angel or its associates has not been debarred/ suspended by SEBI or any other regulatory authority for accessing
/dealing in securities Market. Angel or its associates/analyst has not received any compensation / managed or co-managed public
offering of securities of the company covered by Analyst during the past twelve months.
This document is solely for the personal information of the recipient, and must not be singularly used as the basis of any investment
decision. Nothing in this document should be construed as investment or financial advice. Each recipient of this document should
make such investigations as they deem necessary to arrive at an independent evaluation of an investment in the securities of the
companies referred to in this document (including the merits and risks involved), and should consult their own advisors to determine
the merits and risks of such an investment.
Reports based on technical and derivative analysis center on studying charts of a stock's price movement, outstanding positions and
trading volume, as opposed to focusing on a company's fundamentals and, as such, may not match with a report on a company's
fundamentals. Investors are advised to refer the Fundamental and Technical Research Reports available on our website to evaluate the
contrary view, if any.
The information in this document has been printed on the basis of publicly available information, internal data and other reliable
sources believed to be true, but we do not represent that it is accurate or complete and it should not be relied on as such, as this
document is for general guidance only. Angel Broking Pvt. Limited or any of its affiliates/ group companies shall not be in any way
responsible for any loss or damage that may arise to any person from any inadvertent error in the information contained in this report.
Angel Broking Pvt. Limited has not independently verified all the information contained within this document. Accordingly, we cannot
testify, nor make any representation or warranty, express or implied, to the accuracy, contents or data contained within this document.
While Angel Broking Pvt. Limited endeavors to update on a reasonable basis the information discussed in this material, there may be
regulatory, compliance, or other reasons that prevent us from doing so.
This document is being supplied to you solely for your information, and its contents, information or data may not be reproduced,
redistributed or passed on, directly or indirectly.
Neither Angel Broking Pvt. Limited, nor its directors, employees or affiliates shall be liable for any loss or damage that may arise from
or in connection with the use of this information.
Disclosure of Interest Statement
Bajaj Electricals
1. Financial interest of research analyst or Angel or his Associate or his relative
No
2. Ownership of 1% or more of the stock by research analyst or Angel or associates or relatives
No
3. Served as an officer, director or employee of the company covered under Research
No
4. Broking relationship with company covered under Research
No
Ratings (Based on expected returns
Buy (> 15%)
Accumulate (5% to 15%)
Neutral (-5 to 5%)
over 12 months investment period):
Reduce (-5% to -15%)
Sell (< -15)
August 16, 2016
10