2QFY2016 Result Update | Capital Goods
November 13, 2015
Bharat Earth Movers (BEML)
NEUTRAL
CMP
`1,093
Performance Highlights
Target Price
-
Quarterly highlights - Standalone
Investment Period
-
Y/E March (` cr)
2QFY16 1QFY16 2QFY15
% chg (yoy)
% chg (qoq)
Stock Info
Net sales
621
590
451
37.7
5.2
Sector
Capital Goods
EBITDA
(13)
(57)
(31)
nmf
nmf
Market Cap (` cr)
4,553
Reported PAT
(30)
(75)
(55)
nmf
nmf
Net debt (` cr)
448
Source: Company, Angel Research; Note: nmf- Not meaningful
Beta
1.1
BEML reported standalone sales of `621cr for 2QFY2016, up 37.7% yoy (ahead
52 Week High / Low
1,609/640
of our expectation of `599cr). At the EBITDA level, the company reported losses
Avg. Daily Volume
27,674
of `13cr, in-line with our expectation. The impact of losses at EBITDA level was
Face Value (`)
10
seen at the PAT level too, as the company reported a net loss of `30cr, against
BSE Sensex
25,611
our loss expectation of `12cr. Notably, the quantum of loss has narrowed down
Nifty
7,762
on a yoy basis.
Reuters Code
BEML.BO
BEML’s order book as of 2QFY2016 stands at ~`6,376cr, which gives revenue
Bloomberg Code
BEML@IN
visibility for over the next few quarters.
Valuation: During the quarter, BEML impressed us by reporting strong execution,
Shareholding Pattern (%)
mainly seen across the Construction & Mining Equipments segment. Also, BEML
Promoters
54.0
has reported a `1,771cr of order inflows, across all the 3 business segments.
MF / Banks / Indian Fls
17.8
Reported order inflows, emerging bid pipeline, indicate us that BEML should end
FII / NRIs / OCBs
7.4
FY2016E with strong order inflows of `2,900cr. A strong awarding environment
Indian Public / Others
20.8
should lead to improvement in the execution. Accordingly, we expect BEML to
report a
19.4% top-line CAGR during FY2015-17E. At the back-drop of
Abs. (%)
3m 1yr 3yr
improved execution and better absorption of fixed costs, we expect BEML to
Sensex
(1.0)
(8.7)
38.6
report a strong 529.2% PAT CAGR during FY2015-17E.
BEML
(7.3)
50.2
292.7
On the whole, we are optimistic that the company would report strong earnings
going forward, given the improving award activity environment across all
3
business segments, BEML has a strong market positioning. We continue to
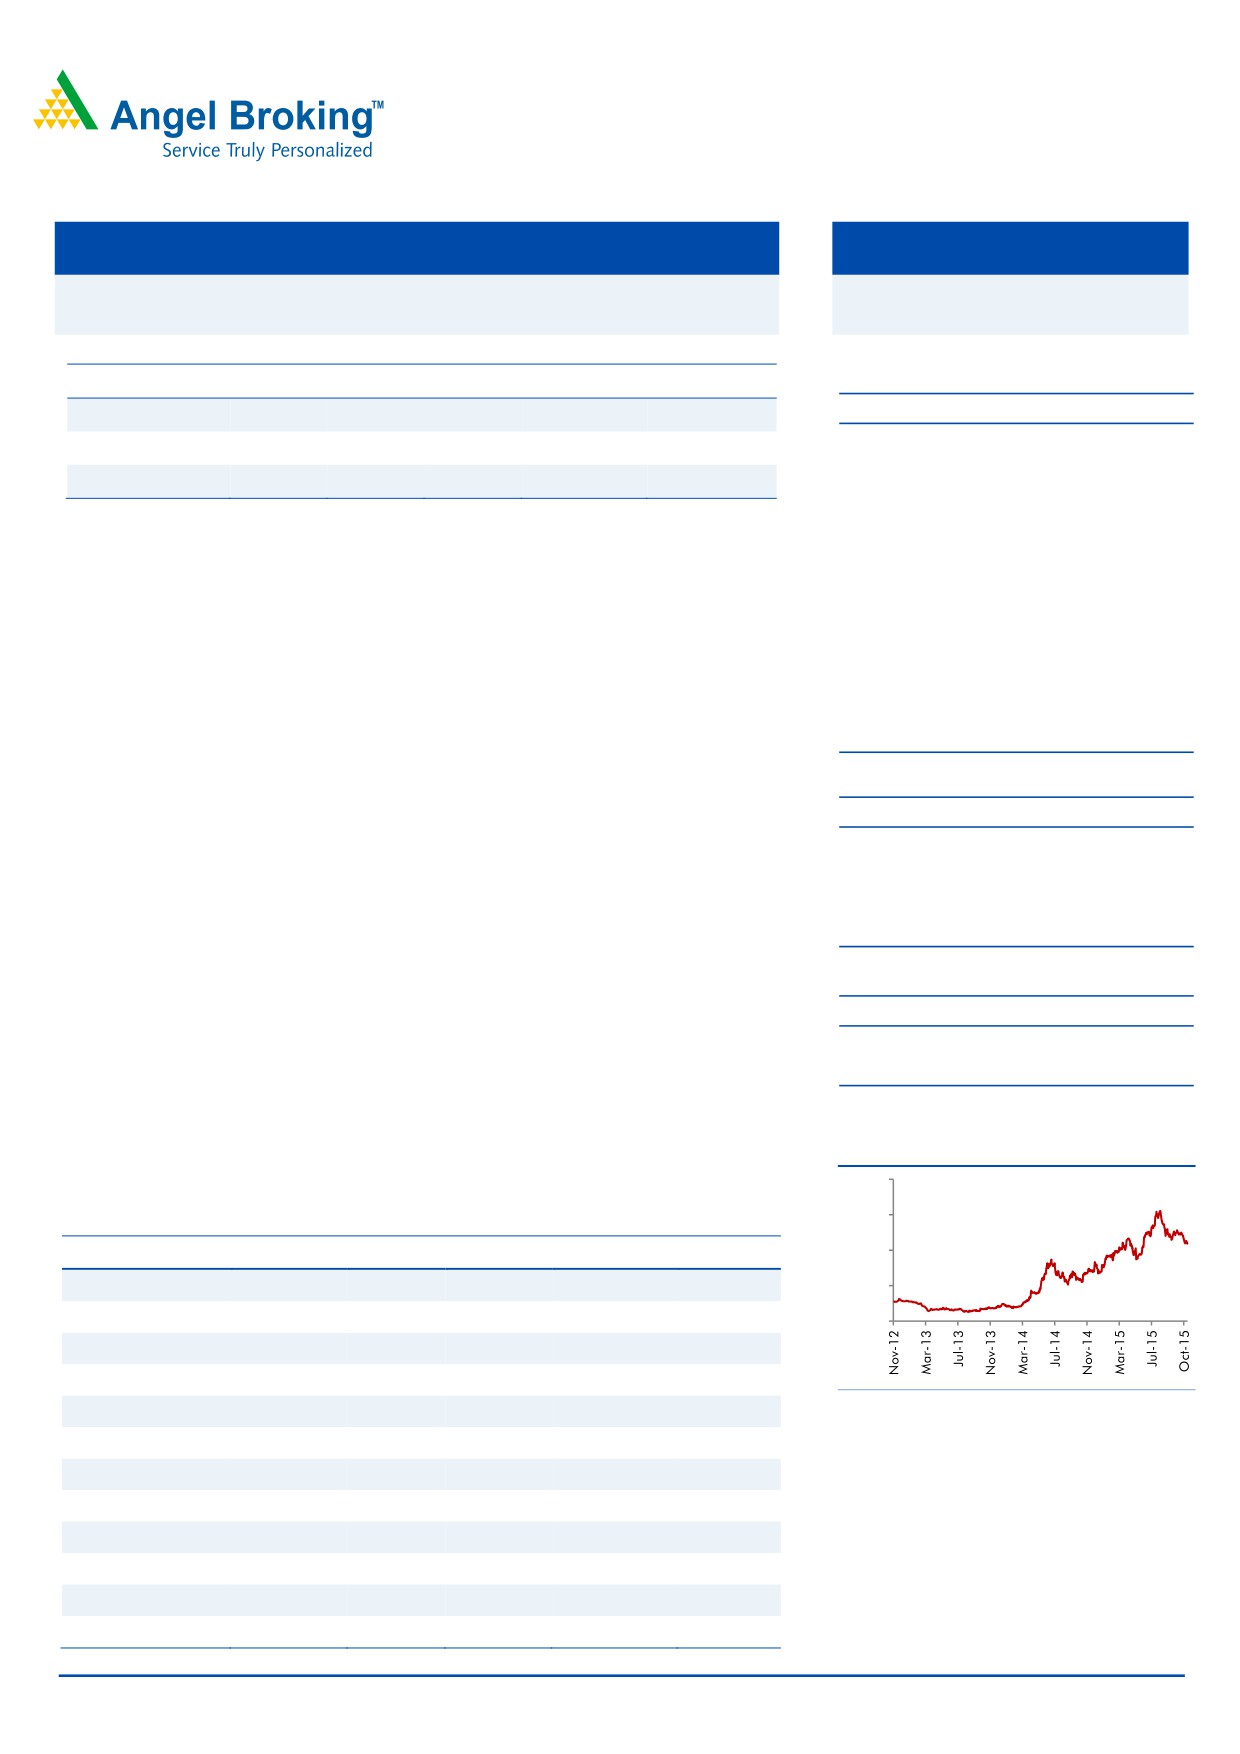
3-Year Daily Price Chart
maintain our NEUTRAL rating on the stock.
2,000
1,500
Key financials (Standalone)
Y/E March (` cr)
FY13
FY14
FY15
FY16E
FY17E
1,000
Net Sales
2,809
2,912
2,809
3,404
4,006
500
% chg
3.0
3.7
(3.5)
21.2
17.7
0
Net Profit
(80)
5
7
151
268
% chg
NA
NA
44.8
2128.7
77.7
EBITDA (%)
(1.6)
3.9
2.5
6.8
8.9
Source: Company, Angel Research
EPS (`)
(19.2)
1.1
1.6
36.2
64.3
P/E (x)
nmf
nmf
nmf
30.2
17.0
P/BV (x)
2.2
2.2
2.2
2.1
1.9
RoE (%)
(4.3)
0.4
0.3
7.0
11.6
RoCE (%)
(2.8)
1.8
0.6
6.2
10.1
Yellapu Santosh
EV/Sales (x)
2.1
1.9
1.8
1.4
1.2
022 - 3935 7800 Ext: 6811
EV/EBITDA (x)
nmf
48.1
71.5
21.0
12.9
Source: Company, Angel Research; Note: nmf- Not Meaningful; CMP as of November 13, 2015
Please refer to important disclosures at the end of this report
1
BEML | 2QFY2016 Result Update
Exhibit 1: Quarterly Performance (Standalone)
Particulars (` cr)
2QFY16
1QFY16
% chg (qoq)
2QFY15
% chg (yoy)
1HFY16
1HFY15
% chg
Net Sales
621
590
5.2
451
37.7
1,211
953
27.1
Total Expenditure
635
648
(2.0)
482
31.6
1,282
1,051
22.0
Cost of materials consumed
337
373
(9.6)
215
56.7
710
530
33.9
Purchases of stock-in-trade
0
0
nmf
0
nmf
0
0
nmf
Employee benefits Expense
193
196
(1.7)
187
3.0
389
378
2.9
Other Expenses
105
79
33.1
80
30.9
184
144
28.1
EBITDA
(13)
(57)
nmf
(31)
nmf
(71)
(98)
nmf
EBIDTA %
(2.2)
(9.7)
(6.9)
(5.8)
(10.3)
Depreciation
13
13
(2.3)
13
(5.2)
25
26
(1.2)
EBIT
(26)
(70)
nmf
(44)
nmf
(96)
(124)
nmf
Interest and Financial Charges
12
12
(1.5)
18
(37.0)
23
40
(41.5)
Other Income
7
7
2.5
8
(2.9)
14
13
9.5
PBT before Exceptional Items
(30)
(75)
nmf
(55)
nmf
(105)
(151)
nmf
Exceptional Items
0
0
0
0
0
PBT after Exceptional Items
(30)
(75)
nmf
(55)
nmf
(105)
(151)
nmf
Tax
0
0
nmf
0
nmf
0
0
nmf
% of PBT
0.0
0.0
0.0
0.0
0.0
PAT
(30)
(75)
nmf
(55)
nmf
(105.1)
(150.7)
nmf
PAT %
(4.9)
(12.7)
(12.2)
(8.7)
(15.8)
Dil. EPS (after extra-ord. Items)
(7.24)
(17.98)
nmf
(13.24)
nmf
(25.22)
(36.18)
nmf
Source: Company, Angel Research; Note: nmf- Not meaningful
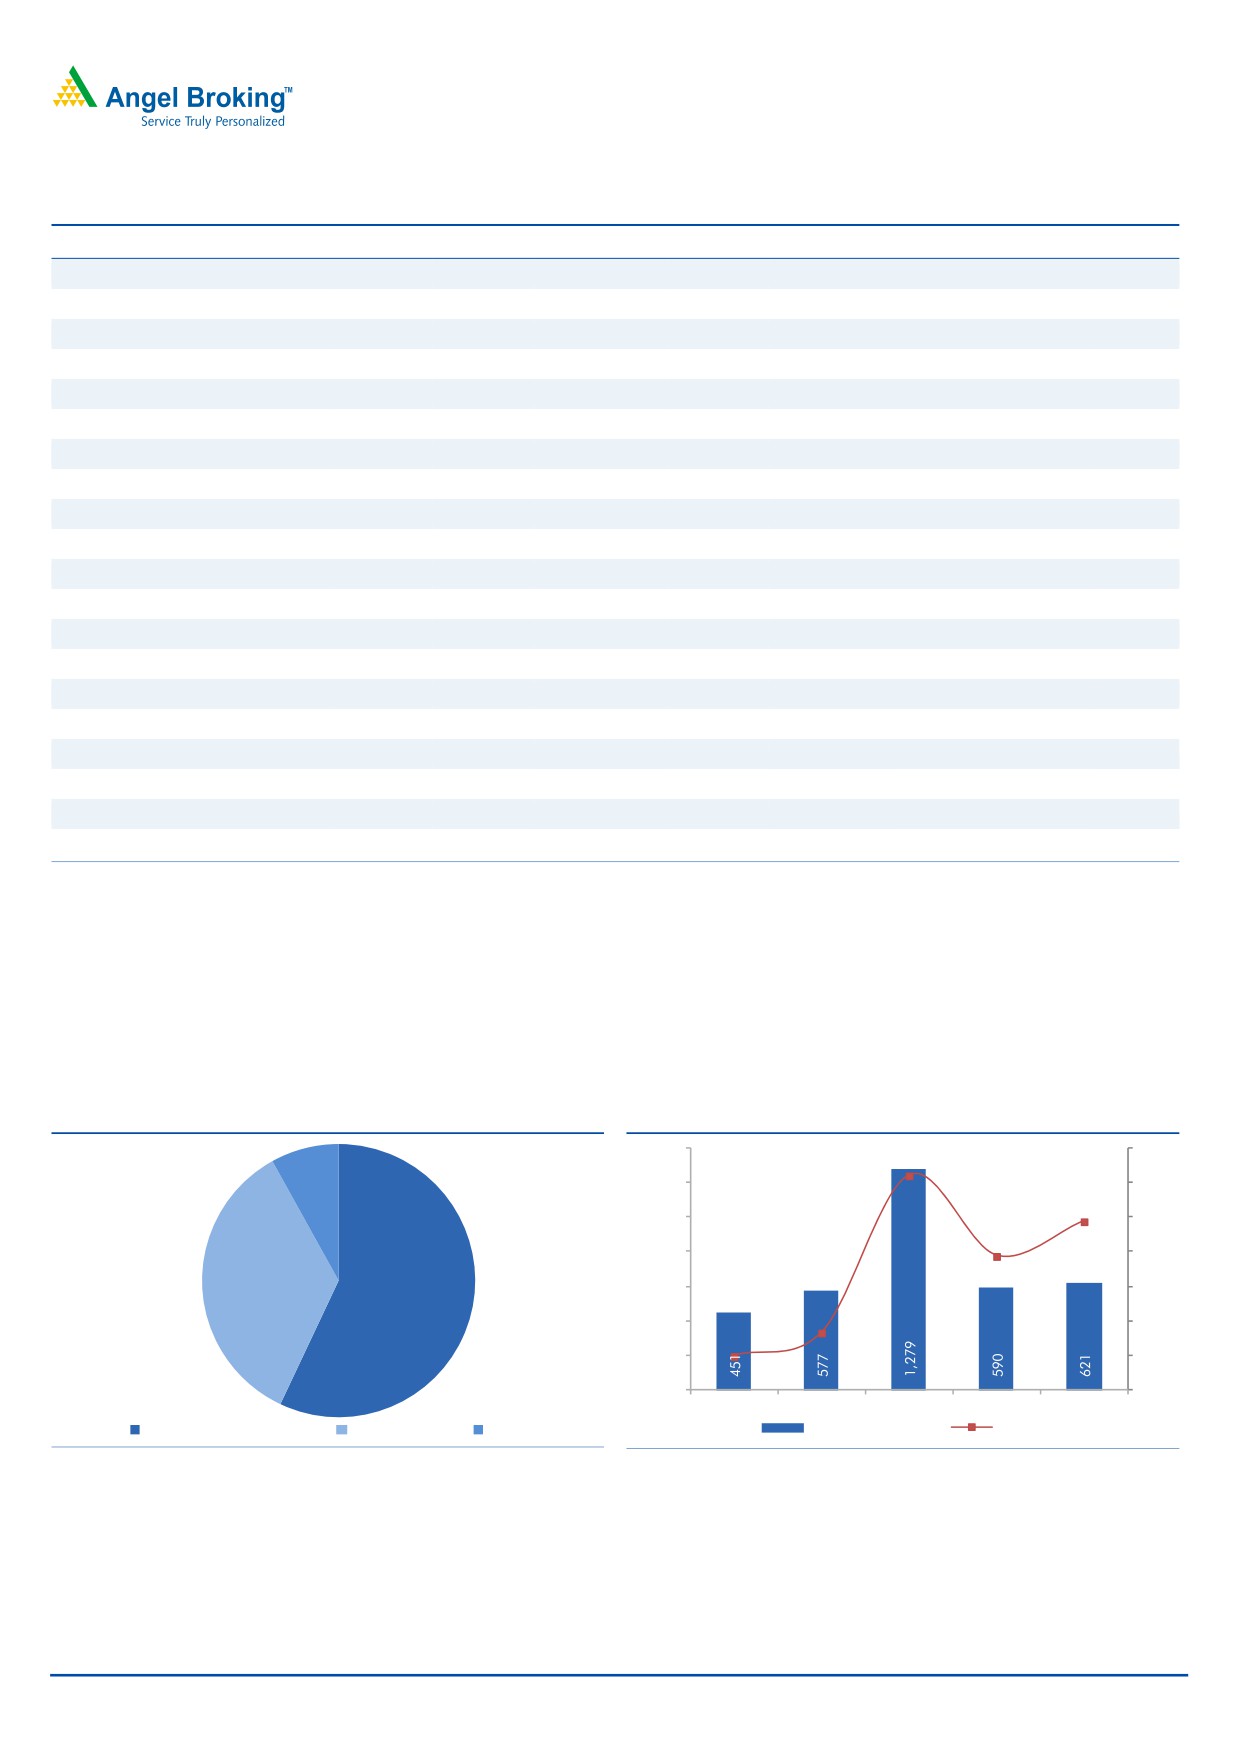
Revenues increase 37.7% yoy
BEML reported sales of `621cr in 2QFY2016, ahead of our expectation of `599cr.
The Reported top-line numbers reflect 37.7% yoy growth. Construction & Mining
Equipments segment accounted for a major 57% of the quarter’s revenues at
`316cr.
Exhibit 2: Segment-wise 2QFY2016 Revenue split
Exhibit 3: Quarterly revenue trend
1,400
80.0
64.1
8%
1,200
60.0
37.7
1,000
40.0
17.7
800
20.0
(26.4)
35%
600
0.0
(39.9)
57%
400
(20.0)
200
(40.0)
(0)
(60.0)
2QFY15
3QFY15
4QFY15
1QFY16
2QFY16
Const. & Mining Equip.
Rail & Metro
Defense
Revenues (` in cr)
yoy growth (%)
Source: Company, Angel Research
Source: Company, Angel Research
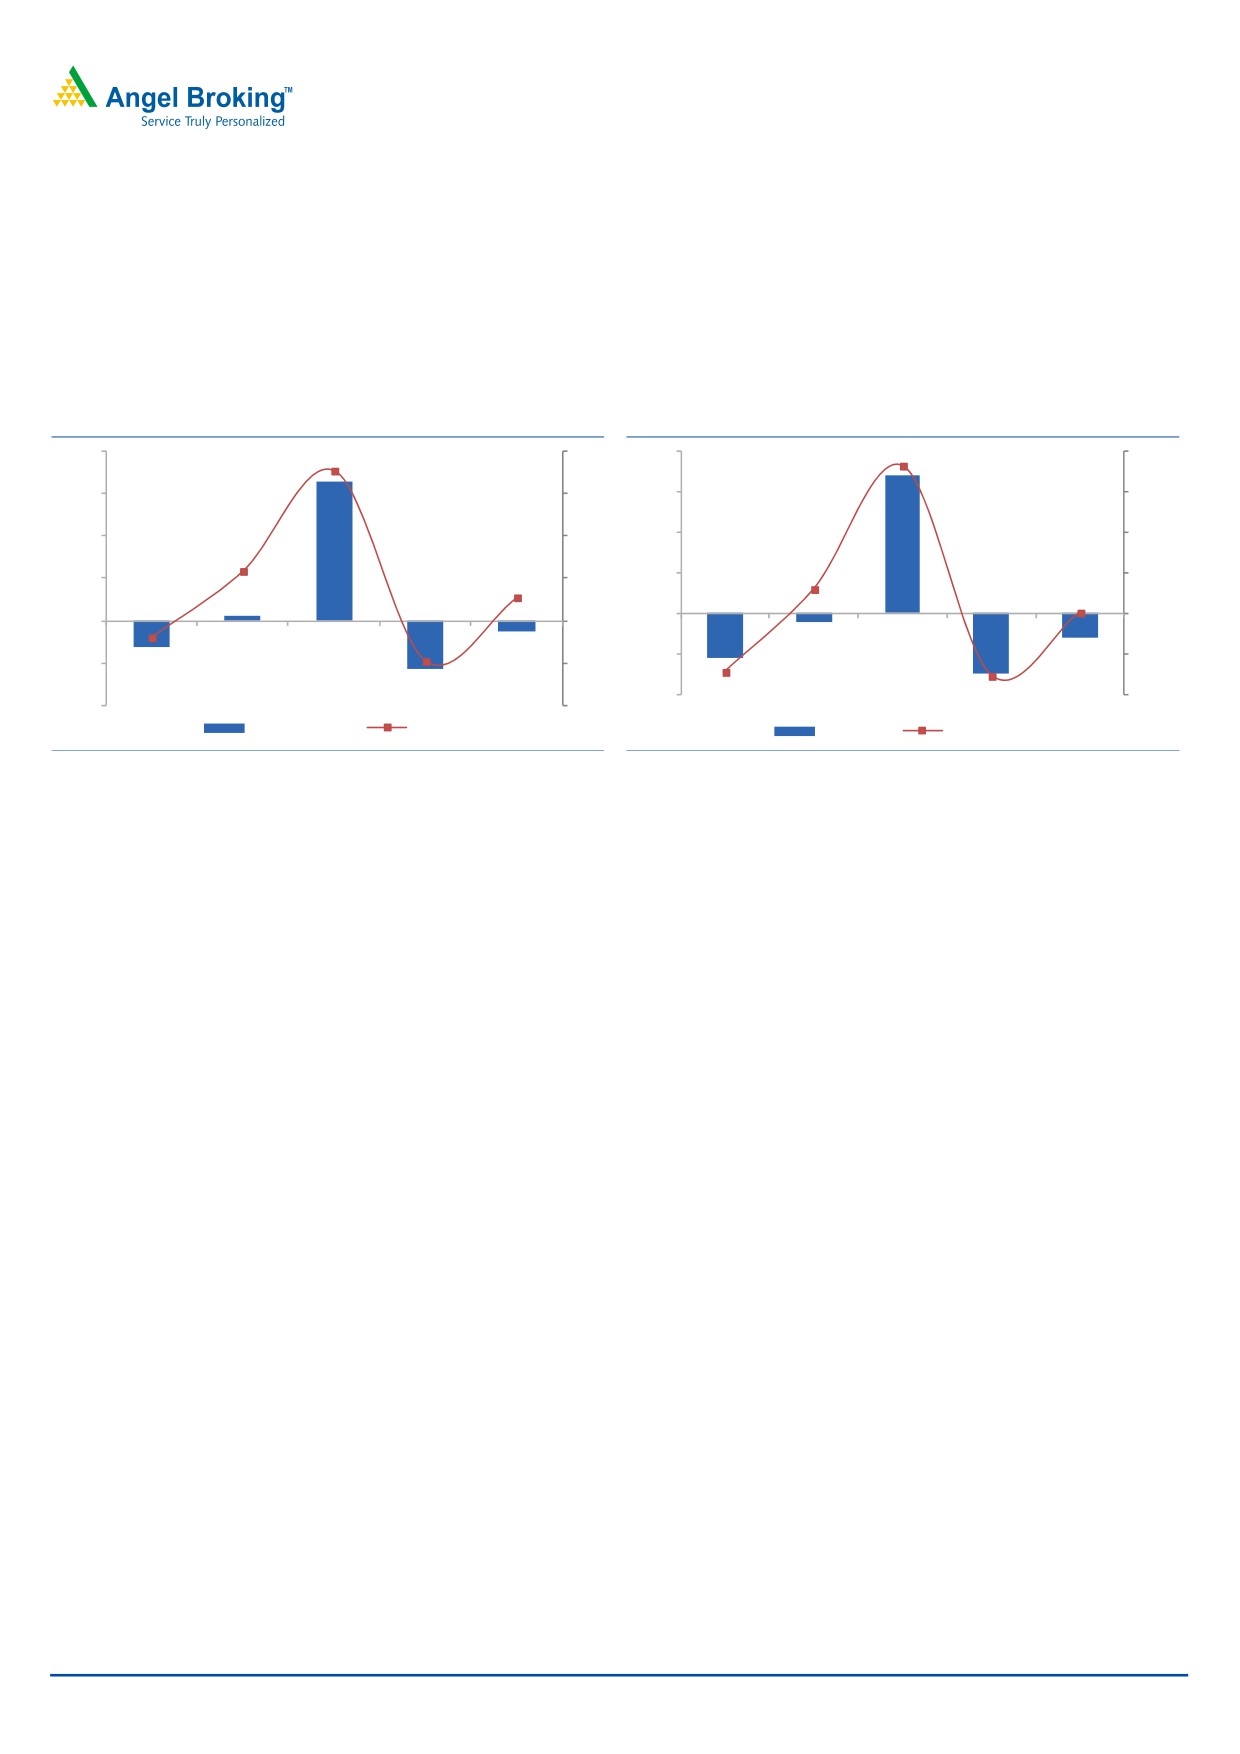
Reports EBITDA level losses on a yoy basis
BEML reported an EBITDA level loss of `13cr in 2QFY2016, which is almost in-line
with our EBITDA level loss expectations. The positive emerging has been due to
narrowing down of EBITDA level loss on a yoy basis. EBITDA losses narrowed
November 13, 2015
2
BEML | 2QFY2016 Result Update
down from a year ago level of `31cr. A lower increase in employee and other
expenses which grew 3.0% and 30.9% yoy respectively (compared to revenue
growth on yoy basis), led to narrowing down of the EBITDA level loss for BEML.
In our view, higher revenue booking seen across the high margin Construction &
Mining Equipment segment led to narrow down of the EBITDA level loss on a yoy
basis.
Exhibit 4: EBITDA loss narrows down on yoy basis
Exhibit 5: PAT loss too narrows down on yoy basis
200
163
15
200
169
15.0
13.2
12.7
150
10
150
10.0
100
5
100
5.0
0.9
50
0.0
50
0
(2.0)
5
(2.2)
(4.9)
(6.9)
0
(5.0)
0
(5)
2QFY15
3QFY15
4QFY15
1QFY16
2QFY16
2QFY15
3QFY15
4QFY15
1QFY16
2QFY16
(50)
(10.0)
(50)
(10)
(11)
(30)
(9.7)
(13)
(12.2)
(31)
(12.7)
(57)
(100)
(55)
(15.0)
(75)
(100)
(15)
EBITDA (` in cr)
EBITDA Margin (%)
PAT (` in cr)
PAT Margin (%)
Source: Company, Angel Research
Source: Company, Angel Research
PAT level losses also narrow down on yoy basis
In-line with EBITDA level losses, BEML reported a PAT level loss of `30cr for the
quarter, again below our loss expectation of `12cr. Notably, the quantum of loss
has narrowed down on a yoy basis from `55cr in 2QFY2015. Narrow down of
EBITDA losses coupled with 37% decline in yoy interest expenses to `12cr
(indicating benefits of lower interest rate cycle) led to a narrow down of the PAT
level loss.
Reports `410cr of Order Inflows for 2QFY2016
BEML in 2QFY2016 reported `410cr of order inflows, mainly led by Construction
& Mining Equipments segment (again within the segment, order wins were mainly
from the domestic market). This segment accounted for 72% of the 2QFY2016
order inflows.
To-date, the Construction & Mining Equipments segment has reported `720cr of
order inflows during 1HFY2016E, mainly from Coal India (CIL). At the backdrop of
CIL’s capex outlook, we expect BEML to benefit from an uptick in the awarding
activity.
In 1HFY2016, on a whole, the company has reported `1,771cr of order inflows,
across all the 3 business segments (vs our FY2016E expectation of `2,900cr).
November 13, 2015
3
BEML | 2QFY2016 Result Update
Exhibit 6: Order Inflows driven by Const. & Mining seg.
Exhibit 7: Order Book gives better revenue visibility
6%
24%
22%
45%
72%
31%
Const. & Mining Equip.
Rail & Metro
Defense
Const. & Mining Equip.
Rail & Metro
Defense
Source: Company, Angel Research
Source: Company, Angel Research
Post the recent order wins, the order book as of 2QFY2016-end stood at `6,376cr.
Order book / last twelve month (LTM) sales ratio at 2QFY2016-end stood at 2.1x.
The current order book gives revenue visibility for the next few quarters.
Revision of Estimates
Considering better than expected revenues reported for 1HFY2016, we are
revising our FY2016E Revenue, EBITDA and PAT estimates.
Exhibit 8: Revised Earnings Estimates
FY2016E
FY2017E
Old
New
Chg. (%)
Old
New
Chg. (%)
Net Sales
3,277
3,404
3.9%
4,006
4,006
0.0%
EBITDA
196
233
18.9%
357
357
0.0%
EBITDA %
6.0
6.8
8.9
8.9
PAT
122
151
23.8%
268
268
0.0%
PAT %
3.7
4.4
6.7
6.7
Source: Company, Angel Research
Valuation
During the quarter, BEML impressed us by reporting strong execution across the
Construction & Mining Equipment segment.
Positive emerging from the 1HFY2016 performance is that BEML has won orders
to the tune of `720cr from the Construction & Mining Equipment segment alone.
BEML has emerged as L1 for over `600cr of order from the Kolkata Metro, which
in our view should be slow-moving in nature. On a whole, we expect BEML to see
increased traction from the awarding activity across all the 3 business segments.
We are optimistic that the company would report strong earnings going forward.
Our view stems on the back of BEML's strong market positioning across business
segments and improving award activity environment across segments. At the back-
drop of increased order book, we expect BEML to report better execution trends,
which should further lead to turn-around in profits, going forward. We continue to
maintain our NEUTRAL rating on the stock.
November 13, 2015
4
BEML | 2QFY2016 Result Update
Investment arguments
Order book set to expand…
As of 2QFY2016-end, BEML is sitting on an order book of `6,376cr, which gives
revenue visibility for over the next few quarters. Further, if we look into order book
details, a major chunk of it is from the Defense segment (45% of total order book),
followed by Rail & Metro segment (31% of total order book), and Mining segment
(24% of total order book).
The government’s increased thrust towards Mining, Defense and Metro amongst
other verticals, when coupled with BEML’s strong market positioning across the
segments, strengthens our view that BEML should report 25% CAGR in its order
inflow during FY2015-17E (expect BEML to report `6,100cr of order wins during
FY2016-17E).
Expect strong 19% top-line CAGR during FY2015-17E…
At the backdrop of strong revival in the order inflow environment (across all the
three business segments), we expect BEML to ramp-up its execution, going
forward. We expect BEML to report strong growth across two of its business
segments, ie Rail & Metro and Defense, which have been under pressure in the last
2-3 years. The government’s thrust towards Metro development and expansion
across 15+cities will create huge demand for Rolling stock, which in turn should
benefit BEML the most, with it being one of the low cost Metro coach
manufacturers. We expect the Rail & Metro segment of the company to report 18%
top-line CAGR during FY2015-17E to `1,371cr. Further, with the removal of ban
on Tatra trucks, growth prospects for BEML’s Defense segment look strong. We
expect the Defense segment to report 105% top-line CAGR during FY2015-17E to
`678cr. Our view of strong growth in the Defense segment is owing to (1) higher
budgetary
allocation
made towards the Defense sector and
(2) considering that BEML is the single supplier of Tatra trucks to Indian defense.
Also, their MCE segment is expected to report a 9% top-line CAGR during
FY2015-17E to `1,919cr. Growth across the MCE division would be driven by
strong new equipment demand and replacement demand emanating from CIL,
SAIL and NMDC’s capex cycle (as all of them are pursuing strong capex).
Strong execution to fuel the much required turnaround…
Higher fixed cost base across business segments and almost stagnated revenue
base has put BEML in a tough spot. BEML reported negative EBITDA margin in
FY2013
(-1.6%), 1HFY2015
(-10.3%) and 1HFY2016
(-5.9%); margins for
1HFY2015 are the worst in the company’s recent history. But on the back of
stronger execution, 2HFY2015 witnessed a turn-around. With losses on a yoy basis
narrowing down in 1HFY2016, we expect strong EBITDA numbers for 2HFY2016E.
Further, if we look into segment-wise details, the Defense segment reported
margins in red during FY2015 (reflecting weak execution). Also, Mining Equipment
and Rail & Metro segments witnessed margin contraction on account of a higher
fixed cost base.
November 13, 2015
5
BEML | 2QFY2016 Result Update
Led by revival across business segments (as highlighted above), we expect BEML to
report a strong 19.4% top-line CAGR during FY2015-17E to `4,006cr. BEML at
FY2015-end had 10,328 employees. Considering revenue growth potential during
FY2016-17E, when coupled with (1) ~800 employees retiring during the same
period, (2) control over admin. and marketing expenses, (3) cost control initiatives
at the shop floor level, and (4) next pay commission hike coming in to effect from
Jan-2018 only, we are of the view that BEML would be well positioned to absorb
fixed costs, which in turn should translate into margin expansion. We expect BEML
to extend its FY2015 EBITDA level turnaround to FY2016 (at 6.8%) and further
expand margins during FY2017E (to 8.9%).
With EBITDA level turnaround already seen, we expect the entire benefits to flow
down to PAT level. This, when coupled with ease in working capital cycle and lower
interest rate cycle, should help BEML report PAT level margin expansion. On the
whole, we expect PAT margins to improve from 0.2% in FY2015 to 6.7% in
FY2017 (reflecting sharp PAT growth from `7cr in FY2015 to `268cr in FY2017E.
Working Capital cycle to ease going forward…
BEML is well geared to capitalize on the emerging opportunities across its business
segments. Slowdown in the capex cycle across business segments had taken a toll
on the company’s growth prospects. Anticipation of sharp demand from MCE
segment led BEML build higher inventories, which contributed majorly to the stretch
in the Net Working Capital (NWC) cycle.
However, with early indications of capex cycle revival across Mining sector, mainly
led by Coal India, we are optimistic that BEML should be able to further lower its
NWC days (from 282 days in FY2012 to 126 days in FY2017E).
Ease in the NWC cycle of BEML, in our view would lead to decline in the overall
debt levels of the company. As a result, the debt of BEML would decline from
`592cr (as of FY2015-end) to `317cr by FY2017E. Simultaneously, the Net D/E
ratio would decline from 0.2x as of FY2015-end to 0.0x by FY2017-end.
November 13, 2015
6
BEML | 2QFY2016 Result Update
Risks & Concerns
Delays in MCE and Metro capex cycle recovery from here-on could be a big
risk to our estimates.
Significant loss of market share vs. our assumption of slight loss of market
share across the MCE segment could be a risk to our assumptions.
Any sharp appreciation in the Rupee (INR) could make MCE segment imports
competitive, which again could be a risk to our market share assumptions and
be a threat to our earnings growth estimates.
Company background
BEML is a Mini-Ratna Category-1 public sector undertaking (PSU) under the control
of Ministry of Defence (MoD), operating in three distinct business segments
namely, Mining & Construction Equipment, Defence, and Rail & Metro.
Having commenced operations in 1964, with the transfer of Railway Coach
Manufacturing facilities from Hindustan Aeronautics Ltd, BEML has over the years
diversified into manufacturing various types of mining and construction
equipments, Metro coaches and specialised defence vehicles/ products.
November 13, 2015
7
BEML | 2QFY2016 Result Update
Profit and Loss Statement (Standalone)
Y/E March (` cr)
FY13
FY14
FY15
FY16E
FY17E
Net Sales
2,809
2,912
2,809
3,404
4,006
% Chg
3.0
3.7
(3.5)
21.2
17.7
Total Expenditure
2,854
2,798
2,739
3,172
3,649
Cost of Raw Materials Con.
1,645
1,711
1,583
1,918
2,311
Purchase of Stock-in-trade
9
3
0
1
0
Employee benefits Expense
739
717
769
787
805
Other Expenses
460
367
387
465
532
EBITDA
(45)
113
70
233
357
% Chg
(136.4)
(352.6)
(38.2)
233.0
53.5
EBIDTA %
(1.6)
3.9
2.5
6.8
8.9
Depreciation
50
54
52
55
59
EBIT
(95)
60
18
178
298
% Chg
(220.0)
(162.7)
(70.2)
902.2
67.6
Interest & Financial Charges
141
110
71
51
34
Other Income
104
63
60
66
79
PBT
(132)
13
7
193
343
Exceptional Items
10
16
0
0
0
Prior Period Adjustments
0
(19)
0
0
0
Tax
(42)
4
0
42
75
% of PBT
nmf
35.2
2.2
22.0
22.0
PAT
(80)
5
7
151
268
% Chg
NA
NA
44.8
2128.7
77.7
PAT %
(2.8)
0.2
0.2
4.4
6.7
Basic EPS
(19.2)
1.1
1.6
36.2
64.3
Diluted EPS
(19.2)
1.1
1.6
36.2
64.3
% Chg
NA
NA
44.8
2128.7
77.7
November 13, 2015
8
BEML | 2QFY2016 Result Update
Balance Sheet (Standalone)
Y/E March (` cr)
FY13
FY14
FY15
FY16E
FY17E
Sources of Funds
Equity Capital
42
42
42
42
42
Reserves Total
2,038
2,038
2,035
2,159
2,380
Networth
2,080
2,080
2,077
2,201
2,422
Total Debt
1,214
905
592
528
317
Other Long-term Liabilities
406
379
317
337
355
Long-term Provisions
149
136
164
184
199
Total Liabilities
3,850
3,500
3,150
3,250
3,293
Application of Funds
Gross Block
1,184
1,201
1,253
1,316
1,385
Accumulated Depreciation
653
702
754
809
868
Net Block
531
499
499
507
518
Capital WIP & Intan. under Dev.
142
173
162
145
144
Investments
4
4
3
3
3
Deferred Tax Assets (net)
105
100
101
101
101
Inventories
2,456
2,152
1,921
1,995
1,959
Sundry Debtors
862
977
992
1,025
1,088
Cash and Bank Balance
77
16
144
201
270
Loans & Advances
603
532
400
413
448
Current Liabilities
1,366
1,261
1,441
1,570
1,678
Net Current Assets
2,632
2,417
2,017
2,065
2,087
Other Assets
436
308
368
429
440
Total Assets
3,850
3,500
3,150
3,250
3,293
November 13, 2015
9
BEML | 2QFY2016 Result Update
Cash Flow Statement
Y/E March (` cr)
FY13
FY14
FY15P
FY16E
FY17E
Profit before tax
(122)
9
7
193
343
Depreciation
53
55
52
55
59
Other Adjustments
96
(35)
(28)
(18)
(18)
Change in Working Capital
(275)
282
434
(12)
69
Interest & Financial Charges
141
110
71
51
34
Direct taxes paid
(31)
(26)
(0)
(42)
(75)
Cash Flow from Operations
(138)
394
535
226
411
(Inc)/ Dec in Fixed Assets
(170)
(53)
(42)
(45)
(69)
(Inc)/ Dec in Invest. & Int. received
38
25
22
18
18
Cash Flow from Investing
(132)
(28)
(20)
(27)
(51)
Inc./ (Dec.) in Borrowings
303
(306)
(312)
(64)
(211)
Issue/ (Buy Back) of Equity
0
0
0
0
0
Dividend Paid (Incl. Tax)
(24)
(12)
(5)
(26)
(47)
Finance Cost
(124)
(109)
(71)
(51)
(34)
Cash Flow from Financing
155
(427)
(388)
(142)
(292)
Inc./(Dec.) in Cash
(116)
(61)
128
57
68
Opening Cash balances
192
77
16
144
201
Closing Cash balances
77
16
144
201
270
November 13, 2015
10
BEML | 2QFY2016 Result Update
Ratio Analysis (x)
Y/E March
FY13
FY14
FY15
FY16E
FY17E
Valuation Ratio (x)
P/E (on FDEPS)
nmf
nmf
nmf
30.2
17.0
P/CEPS
nmf
78.2
77.3
22.2
13.9
Dividend yield (%)
0.2
0.1
0.1
0.5
0.9
EV/Sales
2.1
1.9
1.8
1.4
1.2
EV/EBITDA
nmf
48.1
71.5
21.0
12.9
EV / Total Assets
1.5
1.6
1.6
1.5
1.4
Per Share Data (`)
EPS (Basic)
(19.2)
1.1
1.6
36.2
64.3
EPS (fully diluted)
(19.2)
1.1
1.6
36.2
64.3
Cash EPS
(7.1)
14.0
14.1
49.3
78.4
DPS
2.5
1.0
1.0
5.4
9.6
Book Value
499.5
499.4
498.7
528.5
581.5
Returns (%)
RoCE (Pre-tax)
(2.8)
1.8
0.6
6.2
10.1
Angel RoIC (Pre-tax)
(2.9)
2.0
0.7
6.5
10.9
RoE
(4.3)
0.4
0.3
7.0
11.6
Turnover ratios (x)
Asset Turnover (Gross
2.4
2.4
2.3
2.7
3.0
Block) (x)
Inventory / Sales (days)
321
292
268
216
180
Receivables (days)
123
117
129
111
100
Payables (days)
175
166
178
170
154
NWC days
269
242
220
157
126
Leverage Ratios (x)
D/E ratio (x)
0.5
0.4
0.2
0.1
0.0
Int. Coverage Ratio (x)
nmf
0.5
0.3
3.5
8.8
Note: nmf- Not Meaningful
November 13, 2015
11
BEML | 2QFY2016 Result Update
Research Team Tel: 022 - 39357800
DISCLAIMER
Angel Broking Private Limited (hereinafter referred to as “Angel”) is a registered Member of National Stock Exchange of India Limited,
Bombay Stock Exchange Limited and Metropolitan Stock Exchange of India Limited. It is also registered as a Depository Participant with
CDSL and Portfolio Manager with SEBI. It also has registration with AMFI as a Mutual Fund Distributor. Angel Broking Private Limited is
a registered entity with SEBI for Research Analyst in terms of SEBI (Research Analyst) Regulations, 2014 vide registration number
INH000000164. Angel or its associates has not been debarred/ suspended by SEBI or any other regulatory authority for accessing
/dealing in securities Market. Angel or its associates including its relatives/analyst do not hold any financial interest/beneficial
ownership of more than 1% in the company covered by Analyst. Angel or its associates/analyst has not received any compensation /
managed or co-managed public offering of securities of the company covered by Analyst during the past twelve months. Angel/analyst
has not served as an officer, director or employee of company covered by Analyst and has not been engaged in market making activity
of the company covered by Analyst.
This document is solely for the personal information of the recipient, and must not be singularly used as the basis of any investment
decision. Nothing in this document should be construed as investment or financial advice. Each recipient of this document should
make such investigations as they deem necessary to arrive at an independent evaluation of an investment in the securities of the
companies referred to in this document (including the merits and risks involved), and should consult their own advisors to determine
the merits and risks of such an investment.
Reports based on technical and derivative analysis center on studying charts of a stock's price movement, outstanding positions and
trading volume, as opposed to focusing on a company's fundamentals and, as such, may not match with a report on a company's
fundamentals.
The information in this document has been printed on the basis of publicly available information, internal data and other reliable
sources believed to be true, but we do not represent that it is accurate or complete and it should not be relied on as such, as this
document is for general guidance only. Angel Broking Pvt. Limited or any of its affiliates/ group companies shall not be in any way
responsible for any loss or damage that may arise to any person from any inadvertent error in the information contained in this report.
Angel Broking Pvt. Limited has not independently verified all the information contained within this document. Accordingly, we cannot
testify, nor make any representation or warranty, express or implied, to the accuracy, contents or data contained within this document.
While Angel Broking Pvt. Limited endeavors to update on a reasonable basis the information discussed in this material, there may be
regulatory, compliance, or other reasons that prevent us from doing so.
This document is being supplied to you solely for your information, and its contents, information or data may not be reproduced,
redistributed or passed on, directly or indirectly.
Neither Angel Broking Pvt. Limited, nor its directors, employees or affiliates shall be liable for any loss or damage that may arise from
or in connection with the use of this information.
Note: Please refer to the important ‘Stock Holding Disclosure' report on the Angel website (Research Section). Also, please refer to the
latest update on respective stocks for the disclosure status in respect of those stocks. Angel Broking Pvt. Limited and its affiliates may
have investment positions in the stocks recommended in this report.
Disclosure of Interest Statement
BEML
1. Analyst ownership of the stock
No
2. Angel and its Group companies ownership of the stock
No
3. Angel and its Group companies' Directors ownership of the stock
No
4. Broking relationship with company covered
No
Note: We have not considered any Exposure below ` 1 lakh for Angel, its Group companies and Directors
Ratings (Based on expected returns
Buy (> 15%)
Accumulate (5% to 15%)
Neutral (-5 to 5%)
over 12 months investment period):
Reduce (-5% to -15%)
Sell (< -15%)
November 13, 2015
12