Quick take | Footwear
June 18, 2018
Bata India
BUY
Better brands for better growth
CMP
`779
Target Price
`896
Bata India Ltd (BIL) is the largest footwear retailer in India, offering footwear,
Investment Period
12 Months
accessories and bags across brands like Bata, Hush Puppies, Naturalizer, Power, etc.
BIL’s ~70% revenue is derived from Men & Kids segment and balance from women’s
segment. BIL has over 1,400 Bata retail stores across India.
Stock Info
Sector
Footwear
Shift in trend towards the organized sector to propel growth: The Indian footwear
Market Cap (` cr)
10,276
industry is valued at `50,000-55,000, which is expected to grow at a CAGR of ~15%
Net Debt (` cr)
(2,575)
going ahead. One third of the industry is mainly dominated by the unorganized
Beta
0.9
52 Week High / Lo
833/511
sector. However, organized segment is expected to grow at a faster pace compared to
Avg. Daily Volume
40,298
the unorganized segment on the back of increase in household income and rising
Face Value (`)
5
BSE Sensex
35,626
brand consciousness amongst Indian consumers. This would be beneficial for branded
Nifty
10,816
players like Bata India.
Reuters Code
BATA.BO
Bloomberg Code
BATA.IN
Strong retail stores expansion plan to boost growth: Currently, the company has 1,400
retail stores, which includes owned and franchise model (mainly presence in metro
Shareholding Pattern (%)
cities). Further, over the last 3 years, the company has added 135 stores (net
Promoters
53.0
MF / Banks / Indian Fls
17.5
addition). Going forward, the company has plans to open 500 stores (already
FII / NRIs / OCBs
6.2
identified 435 cities) mainly in tier-II and tier-III cities over the next 4-5 years. We
Indian Public / Others
23.4
believe Bata is brand for masses, and this is a growth driving factor going ahead.
Abs.(%)
3m 1yr
3yr
New launches and higher ad spends to boost women’s segment: Currently, women’s
Sensex
2.3
17.7
51.7
M&M
9.6
44.3
34.0
footwear segment accounts for ~30% of Bata sales, which the company is targeting to
increase to ~40% over the 3 years. We believe that the company would achieve
strong growth going ahead mainly because of (a) Indian women footwear industry is
growing faster (20%+ growth p.a.), (b) new launches of products (recently launched
950+), and (c) increasing ad spends from 1% to 2.5-3%.
Higher sales of premium products to aid margins: Currently, BIL’s 40% sales come
from premium products like Hush Puppies, Power, Marie Clarie, etc. BIL has plans to
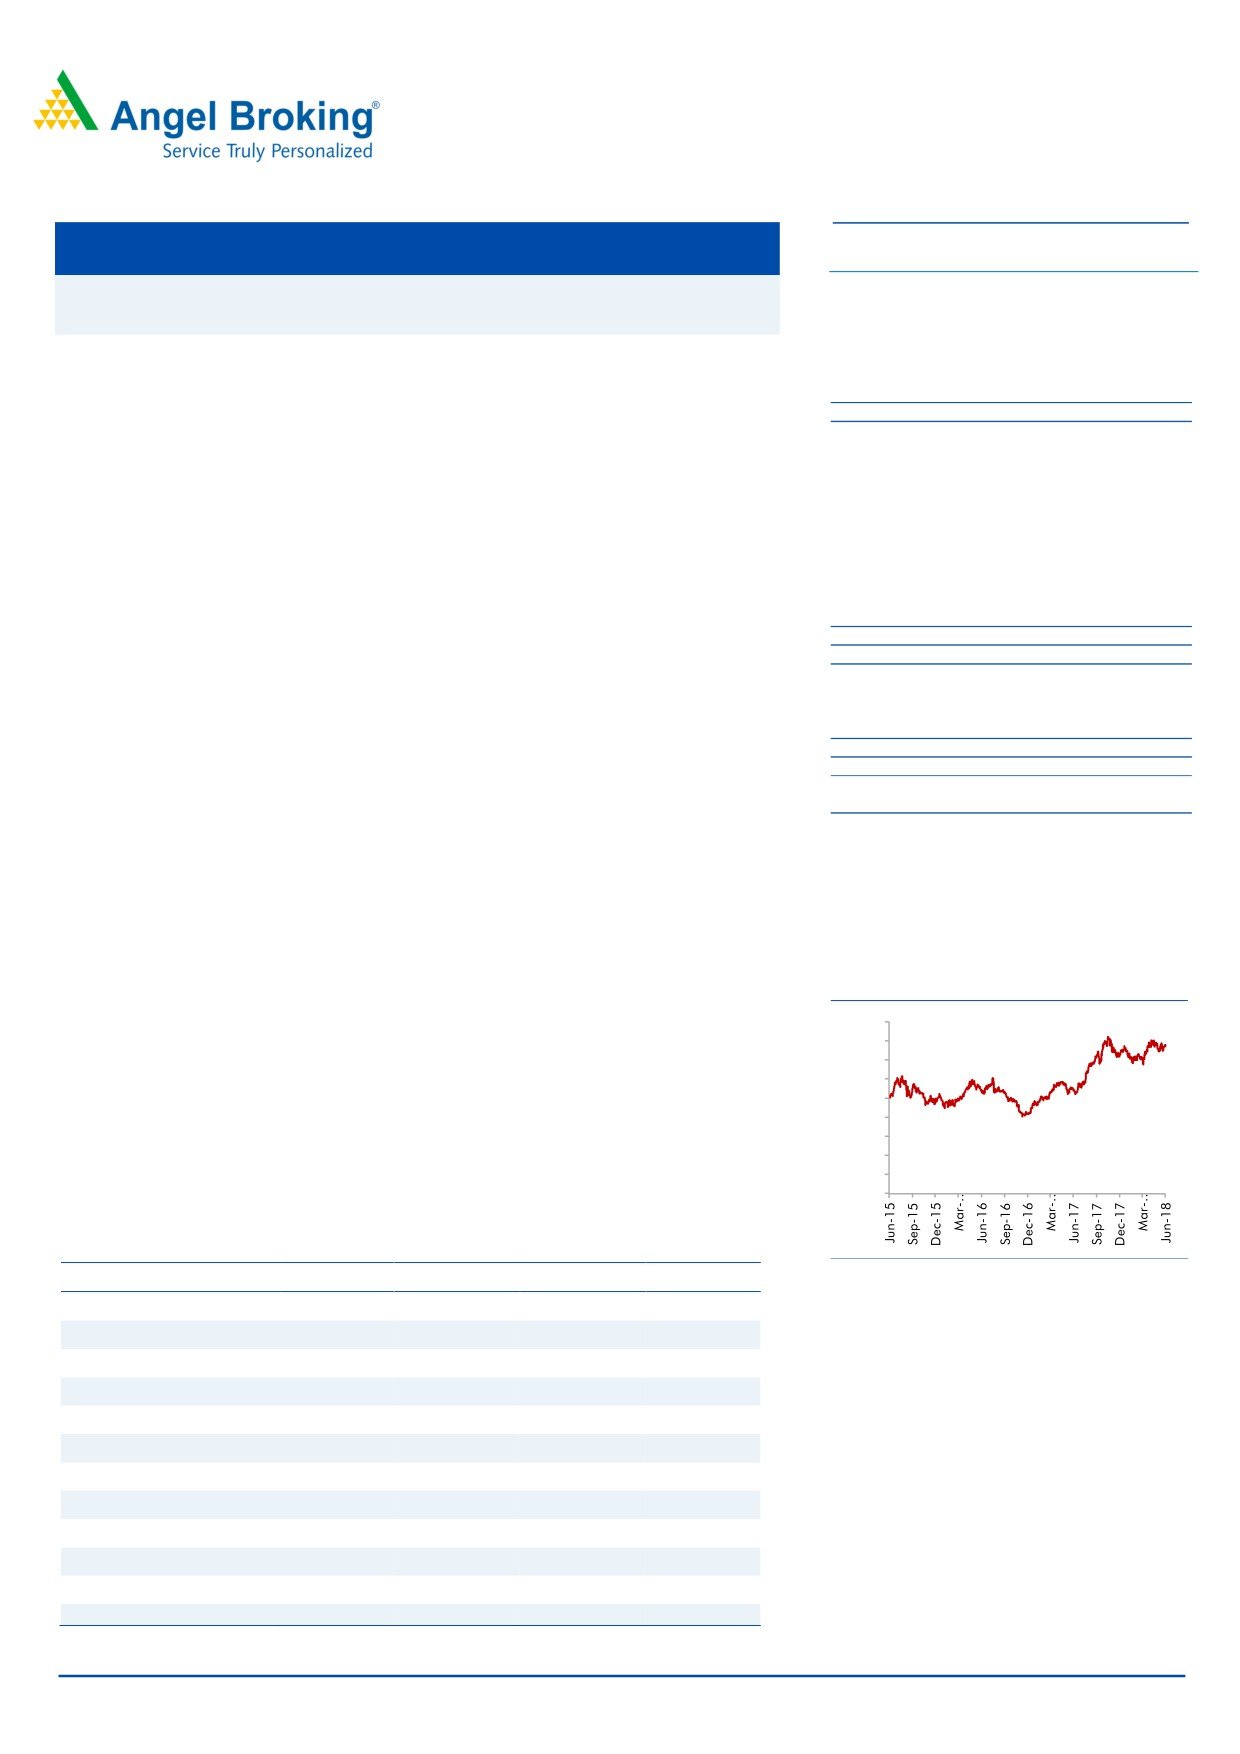
3-year price chart
increase premium product sales from current level of total revenue over next two
years.
900
800
Outlook and Valuation: We expect BIL to report net revenue CAGR of ~16% to
700
600
~`3,555cr over FY2018-20E mainly due increasing brand consciousness amongst
500
Indian consumers, new product launches, higher number of stores addition in tier - II
400
and III cities and focus on women’s segment (high growth segment). Further, on the
300
200
bottom-line front, we expect CAGR of ~19% to `311cr over the same period on the
100
back of margin improvement (increasing premium product sales). Thus, we initiate
0
coverage on Bata India with BUY recommendation and Target Price of `896.
Key Financials
Source: Company, Angel Research
Y/E March (` cr)
FY2017
FY2018
FY2019E
FY2020E
Net sales
2,474
2,634
3,063
3,555
% chg
2.1
6.5
16.3
16.0
Adj. Net profit
173
221
265
311
% chg
3.9
27.7
20.2
17.3
EBITDA margin (%)
10.4
13.3
13.5
13.7
EPS (`)
13.4
17.2
20.6
24.2
Amarjeet S Maurya
P/E (x)
58.0
45.4
37.8
32.2
022-39357800 Ext: 6831
P/BV (x)
7.6
6.7
5.9
5.1
RoE (%)
13.0
14.8
15.6
16.0
RoCE (%)
14.5
19.5
20.3
21.0
EV/Sales (x)
3.8
3.6
3.0
2.6
EV/EBITDA (x)
36.9
26.8
22.4
18.8
Source: Company, Angel Research Note: CMP as of June 15, 2018
Please refer to important disclosures at the end of this report
1
Bata India Ltd
Key investment arguments
Shift in trend towards the organized sector to propel growth: The Indian
footwear industry is valued at `50,000-55,000 and is mainly dominated by
the unorganized sector (accounting for
65-67% share). Industry reports
indicate that the footwear sector is expected to grow at a CAGR of ~15%
going ahead, within which, the organized segment is expected to grow at a
faster pace compared to the unorganized segment. Bata is in a sweet spot
owing to the increase in household income, shifting consumer behavior from
saving to spending, rising brand consciousness amongst Indian consumers
and penetration in tier - II and III cities by footwear companies. The share of
organized players is expected to improve from current levels, which would be
beneficial for branded players like Bata India.
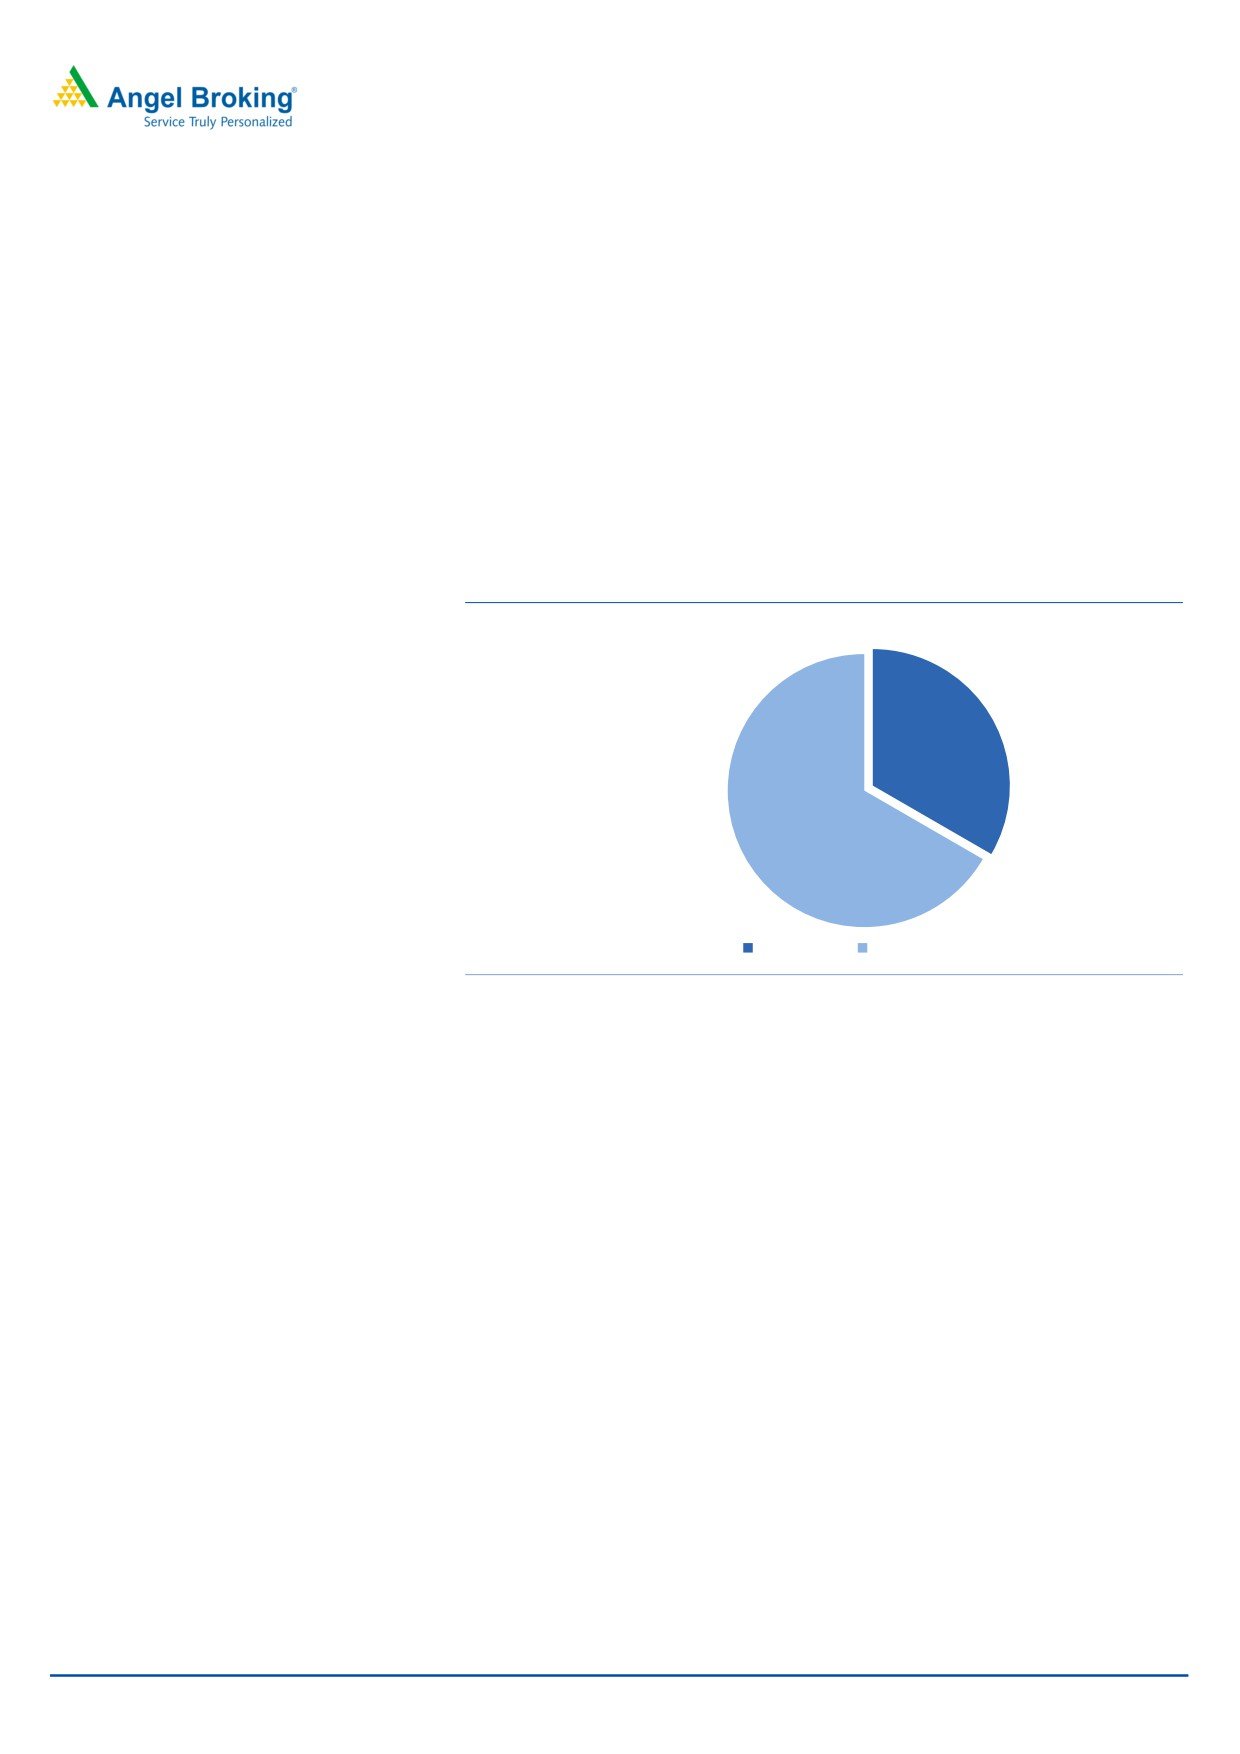
Exhibit 1: Huge untapped opportunity for organised players
33%
67%
Organised
Unorganised
Source: Company, Angel Research
Strong retail store expansion plan to boost further growth: Currently, the company
has 1,400 retail stores, which includes owned and franchise model (mainly present
in metro cities). Further, over the last 3 years, the company has added 135 stores
(net addition). Going forward, the company has plans to open 500 stores (already
identified 435 cities) mainly in tier-II and tier-III cities over the next 4-5 years.
Opening of stores in the small cities, where the company does not have significant
presence, provides growth opportunity for BIL. Moreover, besides the new stores,
the company is also redesigning most of the existing stores with specific focus on
particular categories like sports, women, youth and even school shoes. We believe,
Bata is a brand for masses and this is a growth driving factor for the company.
Moreover, BIL has adopted the right strategy for expansion, which would aid the
overall growth for the company.
June 18, 2018
2
Bata India Ltd
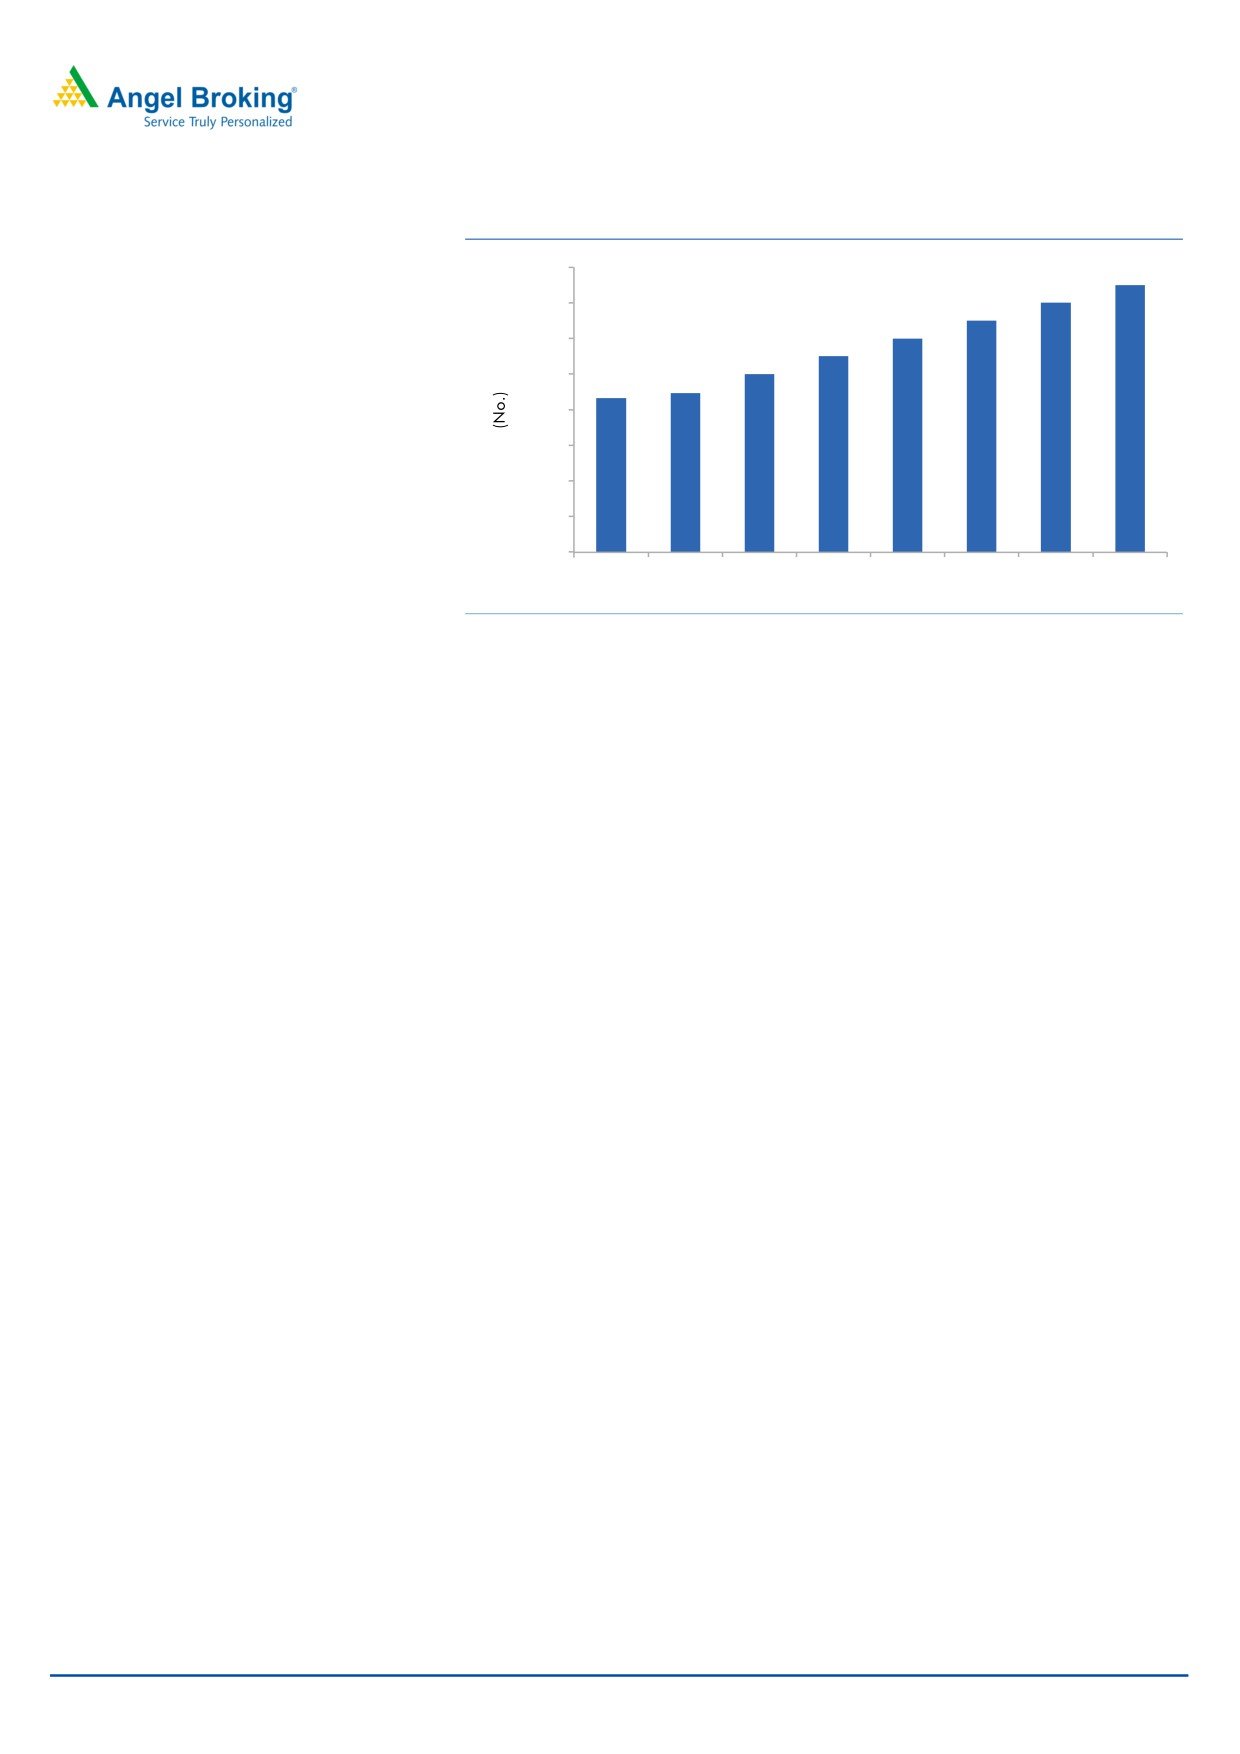
Exhibit 2: Number of store additions
2,000
1,900
1,800
1,800
1,700
1,600
1,600
1,500
1,400
1,400
1,265
1,293
1,200
1,000
800
600
400
FY2016
FY2017
FY2018
FY2019E FY2020E FY2021E FY2022E FY2023E
Source: Company, Angel Research
New launches and higher ad spend to boost women’s segment: Currently,
women’s footwear segment accounts for ~30% of Bata’s sales, which the company
is targeting to increase to ~40% over the next 3 years. We believe that the
company would achieve strong growth going ahead mainly because of (a) Indian
women’s footwear industry is growing faster than overall footwear industry, which
registers 20%+ growth every year, (b) new product launches (recently launched
950+ products largely in women’s collection), and (c) increasing ad spends from
1% to 2.5-3% and also associating with brand ambassadors from Bollywood - Kriti
Sanon and Cricket
- Smriti Mandhana to support the launch of its new
internationally designed Red Label & Power collections.
Higher sales of premium products to aid margin: Currently, BIL’s 40% sales is
derived from premium products like Hush Puppies, Power, Marie Clarie, etc. The
company has plans to increase premium product sales from current level of total
revenue over the next two years. We believe that BIL would be able to achieve
strong growth in premium products on the back new collection launched, higher
number of stores additions and strong marketing spends, which would improve the
overall margin of the company going ahead.
June 18, 2018
3
Bata India Ltd
Outlook & Valuation: We expect BIL to report net revenue CAGR of ~16% to
~`3,555cr over FY2018-20E mainly due increasing brand consciousness amongst
Indian consumers, new product launches, higher number of stores addition in tier
- II and III cities and focus on women’s segment (high growth segment). Further,
on the bottom-line front, we expect CAGR of ~19% to `311cr over the same
period on the back of margin improvement (increasing premium product sales).
Thus, we Initiate Coverage on Bata India with BUY recommendation and Target
Price of `896.
Downside risks to our estimates
Strong store expansion from competitors like Khadim, Relaxo could impact the
company’s sales growth
Slowdown in economy could hurt the overall profitability of the company
Company Background
BATA India Ltd (BIL) is the largest footwear retailer in India, offering footwear,
accessories and bags across brands like Bata, Hush Puppies, Naturalizer, Power,
Marie Claire, Weinbrenner, North Star, Scholl, Bata Comfit and Bubblegummers
to name a few. Currently, the company’s ~70% revenue is derived from Men &
Kids footwear segment and balance from women’s segment. Its retails in over
1,290 Bata stores on bata.in and has thousands of multi-brand footwear dealer
stores pan-India.
June 18, 2018
4
Bata India Ltd
Consolidated Profit & Loss Statement
Y/E March (` cr)
FY2016
FY2017
FY2018
FY2019E
FY2020E
Net Sales
2,423
2,474
2,634
3,063
3,555
% chg
(10.1)
2.1
6.5
16.3
16.0
Total Expenditure
2,147
2,217
2,283
2,650
3,068
Raw Material
1,152
1,158
1,202
1,403
1,635
Personnel
261
273
296
349
412
Selling & Adm
345
356
362
460
533
Others Expenses
389
430
423
438
487
EBITDA
276
257
351
414
487
% chg
(17.3)
(6.8)
36.8
17.7
17.8
(% of Net Sales)
11.4
10.4
13.3
13.5
13.7
Depreciation& Amortisation
79
65
60
69
79
EBIT
197
192
291
345
408
% chg
(22.5)
(2.6)
51.6
18.6
18.4
(% of Net Sales)
8.1
7.8
11.0
11.3
11.5
Interest & other Charges
2
4
4
4
4
Other Income
101
46
50
55
60
(% of PBT)
34.2
19.7
14.9
13.9
12.9
Recurring PBT
297
234
337
396
464
% chg
(9.8)
(21.1)
44.1
17.4
17.3
Tax
79
75
117
131
153
(% of PBT)
26.7
32.0
34.6
33.0
33.0
PAT (reported)
217
159
221
265
311
Extraordinary Items
51
(14)
-
-
-
ADJ. PAT
166
173
221
265
311
% chg
(20.5)
3.9
27.7
20.2
17.3
(% of Net Sales)
6.9
7.0
8.4
8.7
8.8
Basic EPS (`)
12.9
13.4
17.2
20.6
24.2
Fully Diluted EPS (`)
12.9
13.4
17.2
20.6
24.2
% chg
(20.5)
3.9
27.7
20.2
17.3
June 18, 2018
5
Bata India Ltd
Consolidated Balance Sheet
Y/E March (` cr)
FY2016
FY2017
FY2018E FY2019E FY2020E
SOURCES OF FUNDS
Equity Share Capital
64
64
64
64
64
Reserves& Surplus
1,157
1,260
1,429
1,636
1,883
Shareholders Funds
1,221
1,324
1,493
1,701
1,948
Total Loans
-
-
-
-
-
Deferred Tax Liability
-
-
-
-
-
Total Liabilities
1,221
1,324
1,493
1,784
2,036
APPLICATION OF FUNDS
Gross Block
382
406
508
578
678
Less: Acc. Depreciation
78
138
199
267
346
Net Block
304
268
309
311
332
Capital Work-in-Progress
19
30
-
-
-
Investments
-
-
-
84
88
Current Assets
1,321
1,525
1,680
1,970
2,300
Inventories
685
714
765
898
1,052
Sundry Debtors
71
69
89
109
136
Cash
342
522
591
675
763
Loans & Advances
59
57
61
80
100
Other Assets
163
163
174
208
249
Current liabilities
512
599
597
681
785
Net Current Assets
809
926
1,084
1,289
1,515
Deferred Tax Asset
89
100
100
100
100
Mis. Exp. not written off
-
-
-
-
-
Total Assets
1,221
1,324
1,493
1,784
2,036
June 18, 2018
6
Bata India Ltd
Consolidated Cashflow Statement
Y/E March (` cr)
FY2016
FY2017
FY2018E FY2019E FY2020E
Profit before tax
297
234
337
396
464
Depreciation
79
65
60
69
79
Change in Working Capital
(41)
53
(88)
(122)
(137)
Interest / Dividend (Net)
(24)
(40)
4
4
4
Direct taxes paid
(108)
(65)
(117)
(131)
(153)
Others
1
10
0
0
0
Cash Flow from Operations
204
257
197
216
257
(Inc.)/ Dec. in Fixed Assets
(39)
(48)
(72)
(70)
(100)
(Inc.)/ Dec. in Investments
(75)
(181)
0
0
0
Cash Flow from Investing
(114)
(229)
(72)
(70)
(100)
Issue of Equity
0
0
0
0
0
Inc./(Dec.) in loans
0
0
0
0
0
Dividend Paid (Incl. Tax)
(42)
(45)
(51)
(58)
(64)
Interest / Dividend (Net)
85
197
(4)
(4)
(4)
Cash Flow from Financing
43
152
(56)
(62)
(68)
Inc./(Dec.) in Cash
132
180
69
84
88
Opening Cash balances
210
342
522
591
675
Closing Cash balances
342
522
591
675
763
June 18, 2018
7
Bata India Ltd
Key Ratios
Y/E March
FY2016
FY2017
FY2018E FY2019E FY2020E
Valuation Ratio (x)
P/E (on FDEPS)
31.9
31.8
28.3
24.7
21.4
P/CEPS
23.9
19.8
19.3
17.2
15.3
P/BV
4.6
4.0
3.6
3.2
2.9
Dividend yield (%)
0.7
0.7
0.8
0.9
1.0
EV/Sales
2.2
1.9
1.8
1.5
1.3
EV/EBITDA
19.3
18.9
15.8
12.9
10.8
EV / Total Assets
3.3
2.8
2.6
2.3
2.0
Per Share Data (`)
EPS (Basic)
27.0
27.1
30.4
34.8
40.1
EPS (fully diluted)
27.0
27.1
30.4
34.8
40.1
Cash EPS
35.9
43.5
44.7
50.0
56.2
DPS
5.9
6.0
6.7
7.7
8.8
Book Value
188.5
215.8
239.5
266.7
298.0
Returns (%)
ROCE
14.0
10.5
11.6
13.3
14.3
Angel ROIC (Pre-tax)
37.4
33.6
33.7
37.5
41.0
ROE
14.3
12.5
12.7
13.1
13.5
Turnover ratios (x)
Asset Turnover (Gross Block)
3.0
2.9
3.0
3.2
3.5
Inventory / Sales (days)
24
22
24
25
26
Receivables (days)
22
24
26
28
30
Payables (days)
54
53
49
45
44
Working capital cycle (ex-cash) (days)
(7)
(7)
1
8
12
Source: Company, Angel Research
June 18, 2018
8
Bata India Ltd
Research Team Tel: 022 - 39357800
DISCLAIMER
This document is solely for the personal information of the recipient, and must not be singularly used as the basis of any investment
decision. Nothing in this document should be construed as investment or financial advice. Each recipient of this document should
make such investigations as they deem necessary to arrive at an independent evaluation of an investment in the securities of the
companies referred to in this document (including the merits and risks involved), and should consult their own advisors to determine
the merits and risks of such an investment.
Angel Broking Pvt. Limited, its affiliates, directors, its proprietary trading and investment businesses may, from time to time, make
investment decisions that are inconsistent with or contradictory to the recommendations expressed herein. The views contained in this
document are those of the analyst, and the company may or may not subscribe to all the views expressed within.
Reports based on technical and derivative analysis center on studying charts of a stock's price movement, outstanding positions and
trading volume, as opposed to focusing on a company's fundamentals and, as such, may not match with a report on a company's
fundamentals.
The information in this document has been printed on the basis of publicly available information, internal data and other reliable
sources believed to be true, but we do not represent that it is accurate or complete and it should not be relied on as such, as this
document is for general guidance only. Angel Broking Pvt. Limited or any of its affiliates/ group companies shall not be in any way
responsible for any loss or damage that may arise to any person from any inadvertent error in the information contained in this report.
Angel Broking Pvt. Limited has not independently verified all the information contained within this document. Accordingly, we cannot
testify, nor make any representation or warranty, express or implied, to the accuracy, contents or data contained within this document.
While Angel Broking Pvt. Limited endeavours to update on a reasonable basis the information discussed in this material, there may be
regulatory, compliance, or other reasons that prevent us from doing so.
This document is being supplied to you solely for your information, and its contents, information or data may not be reproduced,
redistributed or passed on, directly or indirectly.
Angel Broking Pvt. Limited and its affiliates may seek to provide or have engaged in providing corporate finance, investment banking
or other advisory services in a merger or specific transaction to the companies referred to in this report, as on the date of this report or
in the past.
Neither Angel Broking Pvt. Limited, nor its directors, employees or affiliates shall be liable for any loss or damage that may arise from
or in connection with the use of this information.
Note: Please refer to the important `Stock Holding Disclosure' report on the Angel website (Research Section). Also, please refer to the
latest update on respective stocks for the disclosure status in respect of those stocks. Angel Broking Pvt. Limited and its affiliates may
have investment positions in the stocks recommended in this report.
Disclosure of Interest Statement
Bata India
1. Analyst ownership of the stock
No
2. Angel and its Group companies ownership of the stock
No
3. Angel and its Group companies' Directors ownership of the stock
No
4. Broking relationship with company covered
No
Note: We have not considered any Exposure below ` 1 lakh for Angel, its Group companies and Directors
Ratings (Returns):
Buy (> 15%)
Accumulate (5% to 15%)
Neutral (-5 to 5%)
Reduce (-5% to -15%)
Sell (< -15%)
June 18, 2018
9