4QFY2016 Result Update | Banking
May 4, 2016
Axis Bank
ACCUMULATE
CMP
`470
Performance Highlights
Target Price
`494
Particulars (` cr)
4QFY16 3QFY16
% chg (qoq) 4QFY15
% chg (yoy)
Investment Period
12 Months
NII
4,553
4,162
9.4
3,799
19.8
Pre-prov. profit
4,399
3,985
10.4
4,013
9.6
Stock Info
PAT
2,154
2,175
(1.0)
2,181
(1.2)
Sector
Banking
Source: Company, Angel Research
Market Cap (` cr)
111,986
Axis Bank has come out with a mixed set of numbers for 4QFY2016. The NII
Beta
1.4
grew 19.8% yoy to `4,553cr, in line with our expectations. However, higher than
52 Week High / Low
613/366
expected provision led to a 1.2% decline in PAT to `2,154cr.
Avg. Daily Volume
12,803,997
Face Value (`)
2
Advances growth remains healthy; During 4QFY2016, the bank reported an
advance growth of 21.0% yoy, while deposits grew by 11% yoy. The retail book
BSE Sensex
25,230
grew by 24% yoy and accounted for 41% of the advances as on March 31,
Nifty
7,747
Reuters Code
AXBK.BO
2016.For FY2017, the bank expects credit growth to be of around 18-20%.
Bloomberg Code
AXSB@IN
CASA ratio came in at 47.3%, increasing by 409bp qoq and 255bp on a yoy
basis. NIM jumped by 18bp qoq and stood at 3.97% while the cost of funds fell
by 2bp qoq to 5.84%. The bank expects its NIM to remain above 3.6% for
Shareholding Pattern (%)
FY2017. The bank created contingency provision to the extent of `300cr during
Promoters
29.7
the quarter, thereby taking the outstanding contingency provision to `480cr.
MF / Banks / Indian Fls
15.7
Corporate lending watch list a concern, asset quality likely to be under pressure;
44.6
FII / NRIs / OCBs
Asset quality for the quarter remained stable with GNPA & NNPA ratios to 1.67%
Indian Public / Others
10.0
and 0.7% vs 1.68% & 0.75% qoq. Slippages came in at `1,474cr, whereas the
bank transferred 1 account worth `170cr under 5/25 scheme and conducted
strategic debt restructuring in 4 accounts worth `205cr. The bank had already
Abs. (%)
3m
1yr
3yr
recognized AQR accounts in 3QFY16.In a significant development the bank has
Sensex
4.2
(6.6)
28.9
come out with a disclosure where in it has mentioned `22,600 cr worth of loans
Axis Bank
23.4
(17.3)
59.3
from the corporate loan book are under stress and ~60% of the same can fall
into NPAs over the next eight quarters. This will keep the provisions on a higher
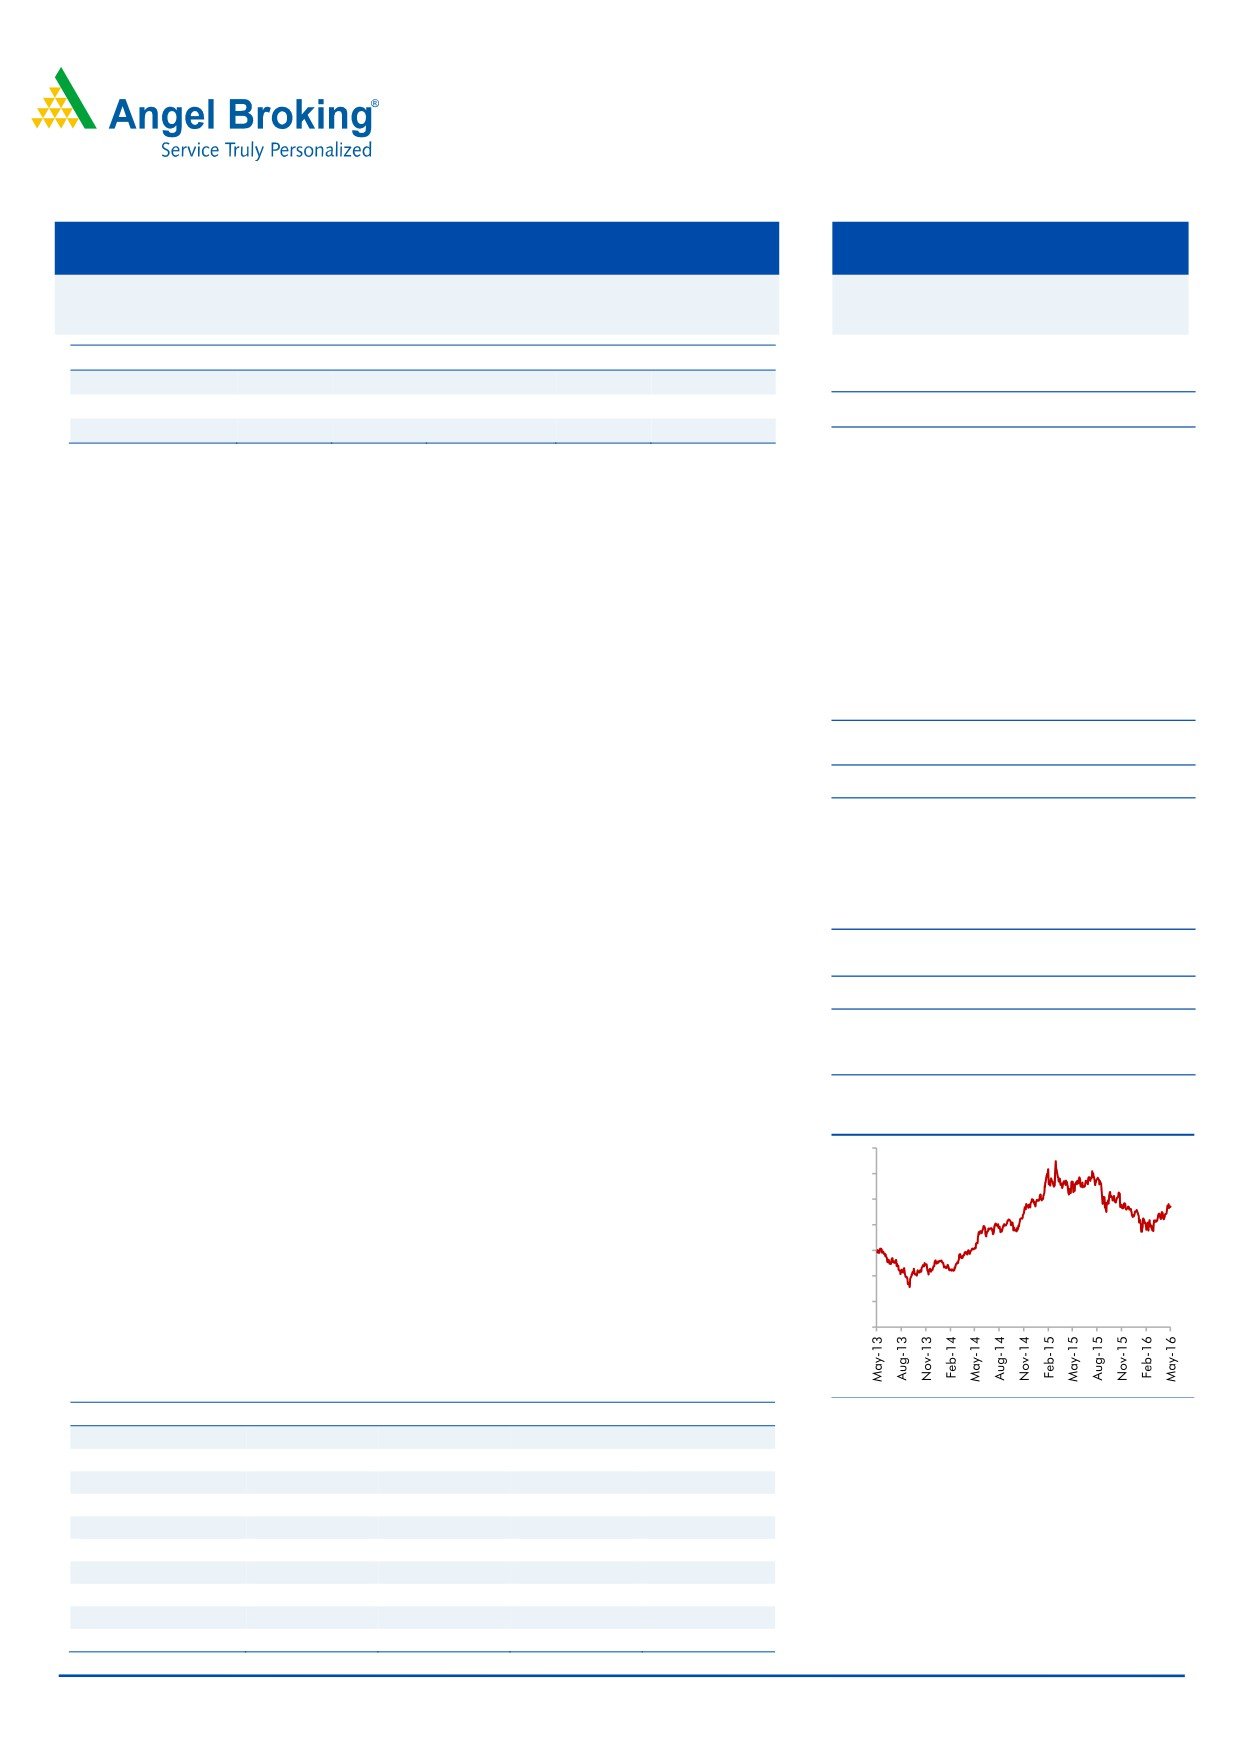
3-year price chart
side over the next 2 years.
700
600
Outlook and valuation: Though the incremental slippages can remain high over
500
the next two years, the disclosure by the bank gives better clarity on earnings
400
going ahead. On a positive side, the core business of the bank continues to grow
300
strong. With higher credit cost we don’t expect FY17 to be a good year with
200
sluggish earnings growth, but remain upbeat on FY18. The stock currently trades
100
at 1.7x P/ABV FY2017E. We maintain our Accumulate rating on the stock with a
0
price target of `494.
Key financials (Standalone)
Source: Company, Angel Research
Y/E March (` cr)
FY2015
FY2016
FY2017E
FY2018E
NII
14,224
16,833
18,872
21,601
% chg
19.0
18.3
12.1
14.5
Net profit
7,358
8,224
8,441
10,380
% chg
18.3
11.8
2.6
23.0
Siddharth Purohit
NIM (%)
3.5
3.6
3.5
3.3
022 - 3935 7800 Ext: 6872
EPS (`)
31.0
34.5
35.4
43.4
P/E (x)
13.2
13.6
13.3
10.8
P/ABV (x)
2.2
2.1
1.7
1.6
Chintan Shah
RoA (%)
1.7
1.7
1.5
1.5
022 - 4000 3600 Ext: 6828
RoE (%)
17.9
16.8
14.9
16.0
Source: Company, Angel Research; Note: CMP as of May 3, 2016
Please refer to important disclosures at the end of this report
1
Axis Bank | 4QFY2016 Result Update
Exhibit 1: 4QFY2016 performance summary (Standalone)
Particulars (` cr)
4QFY16
3QFY16
% chg (qoq)
4QFY15
% chg (yoy)
FY2016
FY2015
% chg
Interest earned
10,899
10,193
6.9
9,697
12.4
40,988
35,479
15.5
- on Advances / Bills
8,093
7,529
7.5
7,025
15.2
30,041
25,868
16.1
- on investments
2,421
2,293
5.6
2,530
(4.3)
9,378
9,117
2.9
- on balance with RBI & others
64
69
(7.2)
67
(4.8)
312
231
35.0
- on others
321
302
6.1
75
326.9
1,258
262
379.2
Interest Expended
6,346
6,031
5.2
5,898
7.6
24,155
21,254
13.6
Net Interest Income
4,553
4,162
9.4
3,799
19.8
16,833
14,224
18.3
Other income
2,694
2,338
15.2
2,687
0.2
10,866
12,732
(14.7)
Other income excl. treasury
2,694
2,000
34.7
2,412
11.7
9,619
11,597
(17.1)
- Fee Income
2,254
1,885
19.6
2,124
6.1
7,502
6,779
10.7
- Trading gains
95
338
(71.9)
275
(65.5)
1,247
1,135
9.9
- Others
440
115
282.7
288
52.6
623
451
38.0
Operating income
7,247
6,500
11.5
6,487
11.7
26,204
22,589
16.0
Operating expenses
2,848
2,515
13.3
2,474
15.1
10,101
9,204
9.7
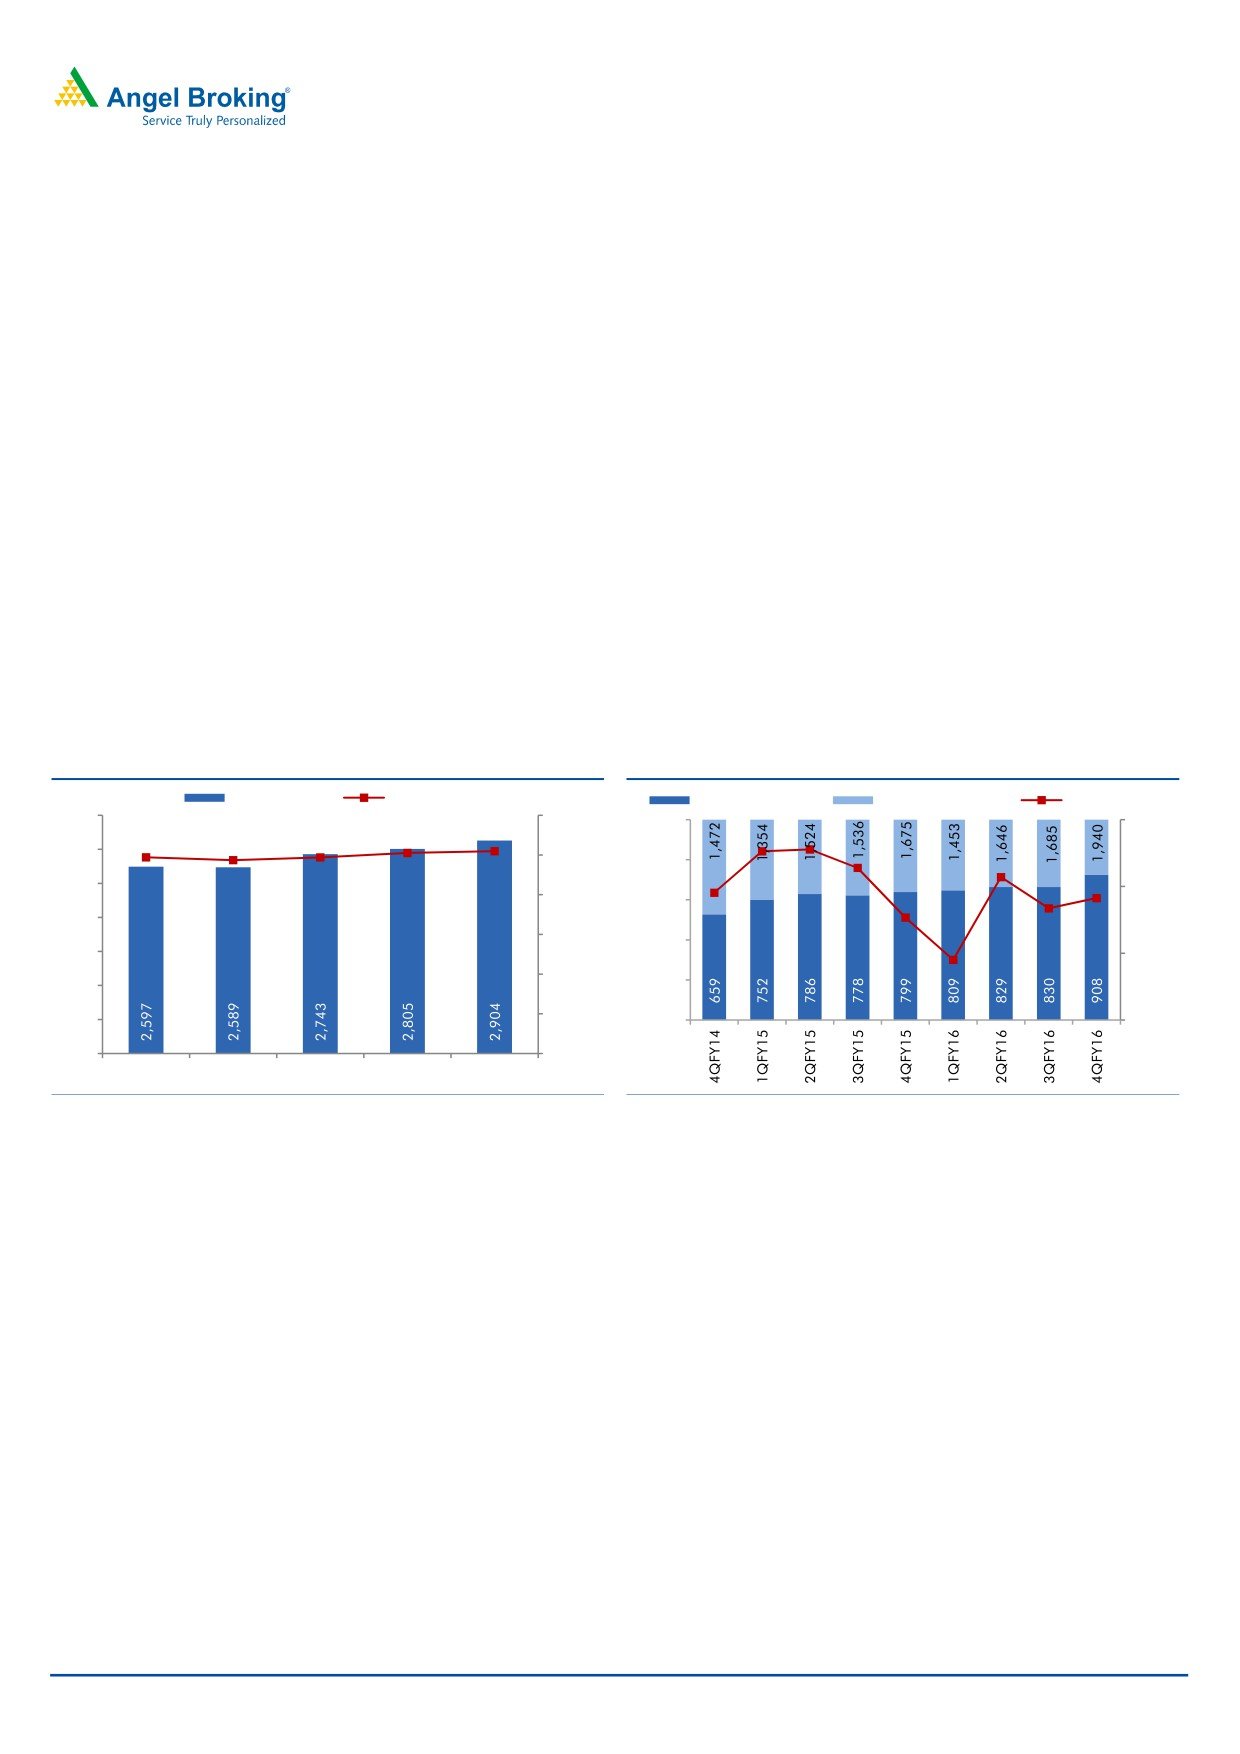
- Employee expenses
908
830
9.4
799
13.7
3,376
3,115
8.4
- Other Opex
1,940
1,685
15.1
1,675
15.8
6,725
6,089
10.4
Pre-provision Profit
4,399
3,985
10.4
4,013
9.6
16,104
13,385
20.3
Provisions & Contingencies
1,168
713
64.0
710
64.6
3,710
2,329
59.3
PBT
3,230
3,272
(1.3)
3,303
(2.2)
12,394
11,057
12.1
Provision for Tax
1,076
1,097
(1.9)
1,122
(4.1)
4,170
3,699
12.7
PAT
2,154
2,175
(1.0)
2,181
(1.2)
8,224
7,358
11.8
Source: Company, Angel Research
May 4, 2016
2
Axis Bank | 4QFY2016 Result Update
Exhibit 2: 4QFY2016 performance analysis (Standalone)
Particulars
4QFY16
3QFY16
% chg (qoq) 4QFY15
% chg (yoy)
Balance sheet
Advances (` cr)
3,38,774 3,15,367
7.4
2,81,083
20.5
Deposits (` cr)
3,57,968 3,38,343
5.8
3,22,442
11.0
Credit-to-Deposit Ratio (%)
94.6
93.2
143bp
87.2
746bp
Current deposits (` cr)
63,652
53,564
18.8
56,108
13.4
Saving deposits (` cr)
1,05,793
92,758
14.1
88,292
19.8
CASA deposits (` cr)
1,69,445 1,46,322
15.8
1,44,400
17.3
CASA ratio (%)
47.3
43.2
409bp
44.8
255bp
CAR (%)*
15.3
15.5
(18)bp
15.1
20bp
Tier 1 CAR (%)*
12.5
12.4
16bp
12.1
44bp
Profitability Ratios (%)
Cost of funds
5.8
5.9
(2)bp
6.3
(42)bp
Reported NIM
4.0
3.8
18bp
3.8
16bp
Cost-to-income ratio
39.3
38.7
61bp
38.1
117bp
Asset quality
Gross NPAs (` cr)
6,088
5,724
6.3
4,110
48.1
Gross NPAs (%)
1.7
1.7
(1)bp
1.3
33bp
Net NPAs (` cr)
2,522
2,514
0.3
1,317
91.5
Net NPAs (%)
0.7
0.8
(5)bp
0.4
26bp
Provision Coverage Ratio (%)
72.0
72.0
0bp
78.0
(600)bp
Slippage ratio (%)
2.1
3.0
(87)bp
1.1
103bp
Loan loss prov. to avg. assets (%)
0.5
0.5
(4)bp
0.4
14bp
Source: Company, Angel Research *Basel III excluding profits
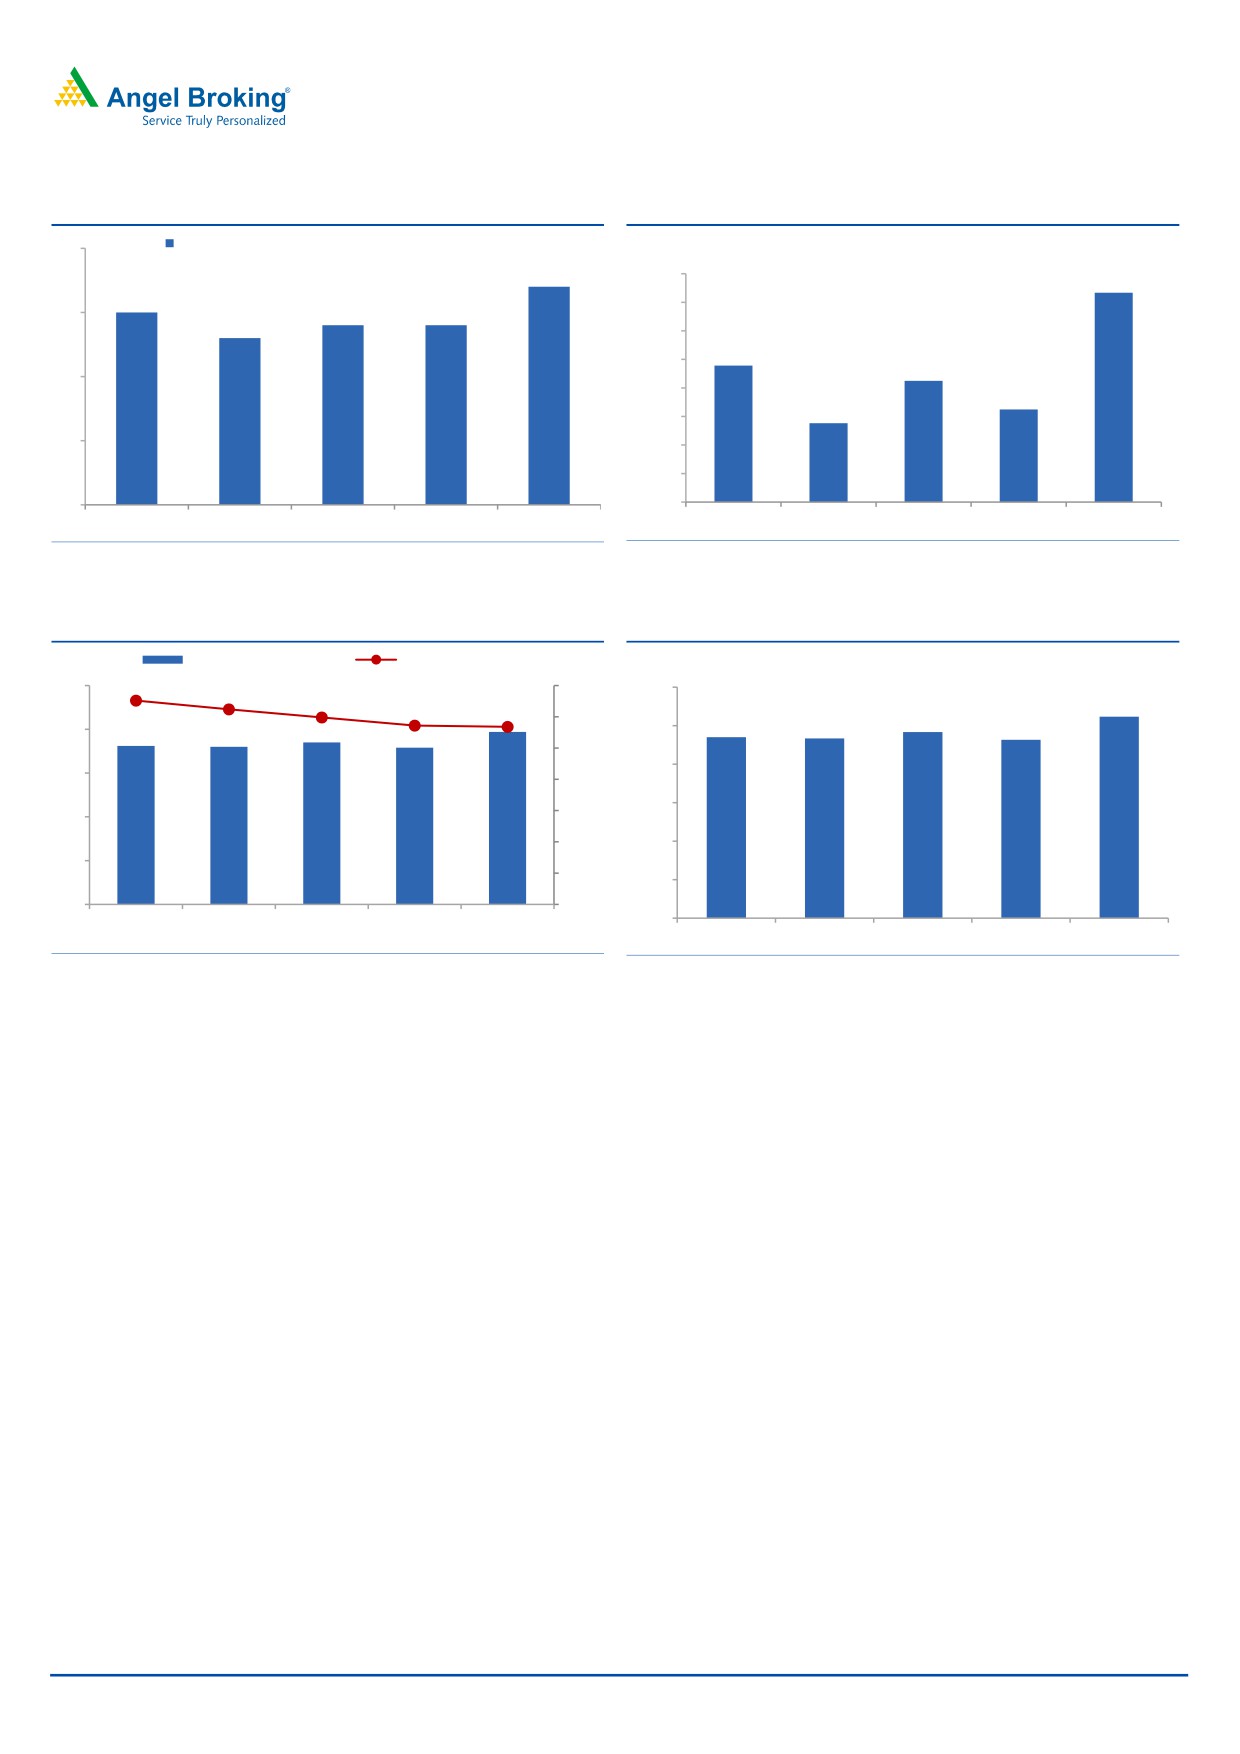
Advances growth remains healthy; NIM declines qoq
During 4QFY2016, the bank reported an advance growth of 21.0% yoy, while
deposits grew by 11% yoy. The retail book grew by 24% yoy and accounted for
41% of the advances as on March 31, 2016. Overall, for the current financial year
(FY2017), the bank expects credit growth to be of around 18-20%.
The CASA ratio came in at 47.3%, increasing by 409bp qoq and 255bp on a yoy
basis. The NIM jumped by 18bp qoq and stood at 3.97% while the cost of funds
fell by 2bp qoq to 5.84%. The bank created contingency provision to the extent of
`300cr during the quarter, thereby taking the outstanding contingency provision to
`480cr.
May 4, 2016
3
Axis Bank | 4QFY2016 Result Update
Exhibit 3: CASA balances grew at 17% yoy
Exhibit 4: Period-end CASA ratio at 47.3%
Reported yoy growth in average CASA balances (%)
20
(%)
17
48.0
47.3
15
14
14
47.0
15
13
46.0
44.8
45.0
44.2
10
44.0
43.2
42.8
43.0
5
42.0
41.0
0
40.0
4QFY15
1QFY16
2QFY16
3QFY16
4QFY16
4QFY15
1QFY16
2QFY16
3QFY16
4QFY16
Source: Company, Angel Research
Source: Company, Angel Research
Exhibit 5: Cost of funds declines qoq
Exhibit 6: NIM at 3.97%
Reported NIMs (%)
Cost of funds (%)
(%)
6.26
4.5
6.12
6.50
4.2
5.99
3.97
5.86
5.84
6.00
3.85
3.9
3.81
3.80
3.79
4.0
5.50
3.6
3.5
5.00
3.3
4.50
3.0
4.00
3.0
2.5
3.50
2.7
3.81
3.80
3.85
3.79
3.97
2.0
3.00
2.4
4QFY15
1QFY16
2QFY16
3QFY16
4QFY16
4QFY15
1QFY16
2QFY16
3QFY16
4QFY16
Source: Company, Angel Research
Source: Company, Angel Research
Slow growth in other income
Fees growth was muted at 6% yoy which constituted 31% of operating revenue.
This was due to decline in corporate fees and flattish transaction banking fees,
which restricted the overall fee growth. However, retail fees grew 15% yoy and
treasury fees grew 12% yoy.
During the quarter, miscellaneous income was up 20% yoy, mainly due to receipt
of dividend from subsidiaries and on account of the bank booking `169cr of
exchange gains from repatriation of profits from its foreign branches compared to
`156cr in 4QFY2015. The sharp sequential jump in miscellaneous income was
also due to higher cash recoveries of `83cr.
Corporate watch list a cause of concern
The asset quality improved marginally with a dip in Gross and Net NPA ratios to
1.67% and 0.7% from 1.68% and 0.75% in the sequential previous quarter.
Slippages came in at `1,474cr, whereas the bank transferred 1 account worth
`170cr under 5/25 scheme and conducted strategic debt restructuring in
4
accounts worth `205cr. The bank has stated that it has taken into account the full
impact of asset quality review conducted by the RBI, which accounted for ~50% of
the total slippages during 3QFY2016.
May 4, 2016
4
Axis Bank | 4QFY2016 Result Update
The bank has come out with strong disclosure this time in which, the management
has outlined that ~`22,600 worth of loans are under stress of which ~60% can
fall into NPA over the next eight quarters. Further large part of the incremental
NPA from this accounts are likely to come up in FY17 itself and hence we believe
slippages to remain high in the 1Q and 2Q of FY17.
24% of the said loans are from metal sector while ~23% are from power and in
the absence of major revival in the above two sector we believe it is fair to assume
that large part of this combined 47% of the loans to turn NPAs over the next few
quarters.
Assuming 60% of the said accounts turns NPAs, it can fairly be said ~`13,500cr of
incremental slippages over the next eight quarters and since the management has
indicated it intends to keep its provisioning coverage ratio at 70%, we can look
towards ~`9,500cr of provisions from this itself over the same period.
Though the slippages numbers indicated by the managements looks like, what we
like is the disclosure and the management’s confidence that no much of other
slippages to come other than from the said accounts.
Exhibit 7: Steady network expansion continues
Exhibit 8: Cost-to-income ratio at 39.3%
Branches
ATMs (RHS)
Staff costs (` cr)
Other opex (` cr)
CIR (%, RHS)
3200
15000
1,250
44.0
12,631
12,743
12,355
12,179
12,352
2800
12500
1,000
42.1
42.2
2400
41.1
40.0
10000
750
40.6
39.6
2000
39.3
7500
38.1
38.7
500
35.6
1600
36.0
5000
250
1200
2500
800
-
32.0
400
0
4QFY15
1QFY16
2QFY16
3QFY16
4QFY16
Source: Company, Angel Research;
Source: Company, Angel Research
May 4, 2016
5
Axis Bank | 4QFY2016 Result Update
Outlook and valuation: Though the incremental slippages expected remains high
over the next two years, the disclosure by the bank gives better clarity on earnings
going ahead. On a positive side the core business of the bank continues to grow
strong. With higher credit cost we don’t expect FY17 to be a good year with
sluggish earnings growth, but remain upbeat on FY18. The stock currently trades
at 1.7x P/ABV FY2017E. We maintain our Accumulate rating on the stock with a price
target of `494.
Exhibit 9: Recommendation summary
CMP
Tgt. Price
Upside
FY2017E
FY2017E
FY2017E
FY15-17E
FY2017E
FY2017E
Company
Reco.
(`)
(`)
(%)
P/ABV (x)
Tgt. P/ABV (x)
P/E (x)
EPS CAGR (%)
RoA (%)
RoE (%)
HDFCBk
Accumulate
1,117
1,262
12.9
3.4
3.8
18.2
22.7
2.0
20.0
ICICIBk*
Accumulate
221
254
14.7
1.5
1.4
9.1
13.5
1.6
14.7
YesBk
Neutral
932
-
-
2.4
2.0
13.4
20.5
1.6
19.6
AxisBk
Accumulate
470
494
5.1
1.9
2.0
10.8
18.4
1.7
18.9
SBI*
Neutral
184
-
-
1.0
0.7
8.9
8.3
0.6
11.2
FedBk
Neutral
47
-
-
0.9
0.9
8.5
(2.9)
0.9
10.8
SIB
Neutral
18
-
-
0.6
0.6
5.4
21.6
0.7
11.6
BOB
Neutral
153
-
-
1.0
1.0
11.8
(7.9)
0.4
7.3
PNB
Neutral
83
-
-
0.5
0.5
3.8
14.4
0.6
10.0
BOI
Neutral
88
-
-
0.2
0.9
2.6
14.0
0.3
7.6
IndBk
Neutral
96
-
-
0.3
0.2
3.2
19.4
0.6
8.6
Vijaya Bank
Neutral
31
-
-
0.4
0.4
4.7
14.1
0.4
8.8
OBC
Neutral
87
-
-
0.2
0.3
1.9
65.5
0.5
9.4
Allahabad Bank Neutral
56
-
-
0.3
0.2
2.1
56.2
0.6
11.9
UnionBk
Neutral
124
-
-
0.4
0.3
3.2
18.1
0.6
11.4
CanBk
Neutral
196
-
-
0.3
0.3
2.8
12.0
0.6
11.2
IDBI#
Neutral
68
-
-
0.4
0.5
4.8
61.6
0.6
9.3
DenaBk
Neutral
29
-
-
0.2
0.3
2.9
45.6
0.4
7.9
Source: Company, Angel Research; Note:*Target multiples=SOTP Target Price/ABV (including subsidiaries), #Without adjusting for SASF
Company Background
Axis Bank is India's third-largest private sector bank after ICICI Bank and HDFC
Bank. The bank is promoted by government institutions, led by UTI (SUUTI
currently holds 12% stake in the bank). The bank has an extensive network of
2,743 branches and 12,352 ATMs spread across 1,796 centers (~51% in metro
and urban regions). The bank's strong growth has been backed by robust retail
branch expansion, strong corporate relationships and a wide range of fee income
products.
May 4, 2016
6
Axis Bank | 4QFY2016 Result Update
Income statement (Standalone)
Y/E March (` cr)
FY12
FY13
FY14
FY15
FY16
FY17E
FY18E
Net Interest Income
8,018
9,666
11,952
14,224
16,833
18,872
21,601
- YoY Growth (%)
22.2
20.6
23.6
19.0
18.3
12.1
14.5
Other Income
5,420
6,551
7,405
8,365
9,371
10,866
12,732
- YoY Growth (%)
17.0
20.9
13.0
13.0
12.0
15.9
17.2
Operating Income
13,438
16,217
19,357
22,589
26,204
29,738
34,332
- YoY Growth (%)
20.0
20.7
19.4
16.7
16.0
13.5
15.5
Operating Expenses
6,007
6,914
7,901
9,204
10,101
11,834
13,869
- YoY Growth (%)
25.7
15.1
14.3
16.5
9.7
17.2
17.2
Pre - Provision Profit
7,431
9,303
11,456
13,385
16,104
17,904
20,464
- YoY Growth (%)
15.8
25.2
23.1
16.8
20.3
11.2
14.3
Prov. & Cont.
1,143
1,750
2,107
2,329
3,710
5,306
4,971
- YoY Growth (%)
(10.7)
53.1
20.4
10.5
59.3
43.0
(6.3)
Profit Before Tax
6,288
7,553
9,349
11,057
12,394
12,598
15,493
- YoY Growth (%)
22.4
20.1
23.8
18.3
12.1
1.6
23.0
Prov. for Taxation
2,046
2,373
3,131
3,699
4,170
4,157
5,113
- as a % of PBT
32.5
31.4
33.5
33.5
33.6%
33.0%
33.0%
PAT
4,242
5,179
6,218
7,358
8,224
8,441
10,380
- YoY Growth (%)
25.2
22.1
20.0
18.3
11.8
2.6
23.0
Balance sheet (Standalone)
Y/E March (` cr)
FY12
FY13
FY14
FY15
FY16
FY17E
FY18E
Share Capital
413
468
470
474
477
477
478
Reserve & Surplus
22,395
32,640
37,751
43,463
52,688
59,863
68,686
Deposits
2,20,104
2,52,614
2,80,945
3,22,442
3,57,968
4,29,561
5,15,473
- Growth (%)
16.3
14.8
11.2
14.8
11.0
20.0
20.0
Borrowings
34,072
43,951
50,291
79,758
99,226
1,18,129
1,41,755
Other Liab. & Prov.
8,643
10,888
13,789
15,795
15,109
18,042
23,196
Total Liabilities
2,85,628
3,40,561
3,83,245
4,61,932
5,25,468
6,26,071
7,49,589
Cash Balances
10,703
14,792
17,041
19,819
22,361
21,478
25,774
Bank Balances
3,231
5,643
11,197
16,280
10,964
17,182
20,619
Investments
93,192
1,13,738
1,13,548
1,32,343
1,22,006
1,46,051
1,75,261
Advances
1,69,760
1,96,966
2,30,067
2,81,083
3,38,774
4,06,528
4,87,834
- Growth (%)
19.2
16.0
16.8
22.2
20.5
20.0
20.0
Fixed Assets
2,259
2,356
2,410
2,514
3,523
4,323
5,123
Other Assets
6,483
7,067
8,981
9,893
27,839
30,509
34,978
Total Assets
2,85,628
3,40,561
3,83,245
4,61,932
5,25,468
6,26,071
7,49,589
- Growth (%)
17.7
19.2
12.5
20.5
13.8
19.1
19.7
May 4, 2016
7
Axis Bank | 4QFY2016 Result Update
Ratio analysis (Standalone)
Y/E March
FY12
FY13
FY14
FY15
FY16
FY17E
FY18E
Profitability ratios (%)
NIMs
3.1
3.2
3.4
3.5
3.6
3.5
3.3
Cost to Income Ratio
44.7
42.6
40.8
40.7
38.5
39.8
40.4
RoA
1.6
1.7
1.7
1.7
1.7
1.5
1.5
RoE
20.3
18.5
17.4
17.9
16.8
14.9
16.0
B/S ratios (%)
CASA Ratio
41.5
44.4
45.0
44.8
47.3
48.0
48.0
Credit/Deposit Ratio
77.1
78.0
81.9
87.2
94.6
94.6
94.6
CAR
13.7
17.0
16.3
16.0
15.4
14.9
14.0
- Tier I
9.4
12.2
12.8
12.2
12.6
12.4
11.8
Asset Quality (%)
Gross NPAs
1.1
1.2
1.4
1.4
1.7
2.8
2.9
Net NPAs
0.3
0.4
0.4
0.5
0.7
1.1
1.0
Slippages
1.3
1.2
1.3
1.2
2.5
1.6
0.8
Loan Loss Prov. /Avg. Assets
0.3
0.4
0.4
0.5
1.1
1.3
1.0
Provision Coverage
73.8
70.6
77.2
68.0
58.6
62.0
65.0
Per Share Data (`)
EPS
20.5
22.1
26.5
31.0
34.5
35.4
43.4
ABVPS (75% cover.)
110.3
141.0
161.7
184.1
218.9
246.9
283.4
DPS
3.2
3.6
4.0
5.9
5.0
6.0
6.5
Valuation Ratios
PER (x)
19.9
18.5
15.4
13.2
13.6
13.3
10.8
P/ABVPS (x)
3.7
2.9
2.5
2.2
2.1
1.7
1.6
Dividend Yield
0.8
0.9
1.0
1.4
1.1
1.3
1.4
DuPont Analysis
NII
3.0
3.1
3.3
3.4
3.4
3.3
3.1
(-) Prov. Exp.
0.4
0.6
0.6
0.6
0.8
0.9
0.7
Adj. NII
2.6
2.5
2.7
2.8
2.7
2.4
2.4
Other Inc.
2.0
1.9
2.0
1.7
1.9
1.9
1.9
Op. Inc.
4.7
4.6
4.8
4.8
4.6
4.2
4.3
Opex
2.3
2.2
2.2
2.2
2.0
2.1
2.0
PBT
2.4
2.4
2.6
2.6
2.5
2.2
2.3
Taxes
0.8
0.8
0.9
0.9
0.8
0.7
0.7
RoA
1.6
1.7
1.7
1.7
1.7
1.5
1.5
Leverage
12.6
11.2
10.1
10.3
10.1
10.1
10.6
RoE
20.3
18.5
17.4
17.9
16.8
14.9
16.0
May 4, 2016
8
Axis Bank | 4QFY2016 Result Update
Research Team Tel: 022 - 39357800
DISCLAIMER
Angel Broking Private Limited (hereinafter referred to as “Angel”) is a registered Member of National Stock Exchange of India Limited,
Bombay Stock Exchange Limited and MCX Stock Exchange Limited. It is also registered as a Depository Participant with CDSL and
Portfolio Manager with SEBI. It also has registration with AMFI as a Mutual Fund Distributor. Angel Broking Private Limited is a
registered entity with SEBI for Research Analyst in terms of SEBI (Research Analyst) Regulations, 2014 vide registration number
INH000000164. Angel or its associates has not been debarred/ suspended by SEBI or any other regulatory authority for accessing
/dealing in securities Market. Angel or its associates including its relatives/analyst do not hold any financial interest/beneficial
ownership of more than 1% in the company covered by Analyst. Angel or its associates/analyst has not received any compensation /
managed or co-managed public offering of securities of the company covered by Analyst during the past twelve months. Angel/analyst
has not served as an officer, director or employee of company covered by Analyst and has not been engaged in market making activity
of the company covered by Analyst.
This document is solely for the personal information of the recipient, and must not be singularly used as the basis of any investment
decision. Nothing in this document should be construed as investment or financial advice. Each recipient of this document should
make such investigations as they deem necessary to arrive at an independent evaluation of an investment in the securities of the
companies referred to in this document (including the merits and risks involved), and should consult their own advisors to determine
the merits and risks of such an investment.
Reports based on technical and derivative analysis center on studying charts of a stock's price movement, outstanding positions and
trading volume, as opposed to focusing on a company's fundamentals and, as such, may not match with a report on a company's
fundamentals.
The information in this document has been printed on the basis of publicly available information, internal data and other reliable
sources believed to be true, but we do not represent that it is accurate or complete and it should not be relied on as such, as this
document is for general guidance only. Angel Broking Pvt. Limited or any of its affiliates/ group companies shall not be in any way
responsible for any loss or damage that may arise to any person from any inadvertent error in the information contained in this report.
Angel Broking Pvt. Limited has not independently verified all the information contained within this document. Accordingly, we cannot
testify, nor make any representation or warranty, express or implied, to the accuracy, contents or data contained within this document.
While Angel Broking Pvt. Limited endeavors to update on a reasonable basis the information discussed in this material, there may be
regulatory, compliance, or other reasons that prevent us from doing so.
This document is being supplied to you solely for your information, and its contents, information or data may not be reproduced,
redistributed or passed on, directly or indirectly.
Neither Angel Broking Pvt. Limited, nor its directors, employees or affiliates shall be liable for any loss or damage that may arise from
or in connection with the use of this information.
Note: Please refer to the important ‘Stock Holding Disclosure' report on the Angel website (Research Section). Also, please refer to the
latest update on respective stocks for the disclosure status in respect of those stocks. Angel Broking Pvt. Limited and its affiliates may
have investment positions in the stocks recommended in this report.
Disclosure of Interest Statement
Axis Bank
1. Analyst ownership of the stock
No
2. Angel and its Group companies ownership of the stock
No
3. Angel and its Group companies' Directors ownership of the stock
No
4. Broking relationship with company covered
No
Note: We have not considered any Exposure below ` 1 lakh for Angel, its Group companies and Directors
Ratings (Based on expected returns
Buy (> 15%)
Accumulate (5% to 15%)
Neutral (-5 to 5%)
over 12 months investment period):
Reduce (-5% to -15%)
Sell (< -15)
May 4, 2016
9