IPO Note | Retail
March 4, 2017
Avenue Supermarts Limited
SUBSCRIBE
sue Open: March 08, 2017
Is
A retailer with a growth appetite
Issue Close: March 10, 2017
Avenue Supermarts Ltd (ASL), founded in 2002, is the owner of well established
supermarket chain D-Mart. ASL is amongst the largest and the most profitable
Food & Grocery retailer in India. It offers wide range of Food and non-food
Issue Details
products. ASL operates total 118 stores in 9 states and 1 Union Territory.
Face Value: `10
Market sentiment moving in favour of organized sector to aid growth: The Indian
Present Eq. Paid up Capital: `562cr
Retail industry is valued at US$616bn and is mainly dominated by the
unorganized sector (accounting for 91% share). Industry reports indicate that the
Fresh issue: `1,870 cr
Retail sector is expected to grow at a CAGR of ~12% over FY2016-20E to
Post Eq. Paid up Capital: `624cr
~US$960bn, within which, the organized segment is expected to grow at a faster pace
than the unorganized segment. The share of organized players is expected to improve
Issue size (amount): `1,870cr
from 9% to ~12% in FY2020E, thus benefitting organised players like D-Mart.
Price Band: `295-299
Steady footprint expansion: ASL has increased its store count from 45 in FY2011
to 118 in 9MFY2017 with total retail business area of ~3.9mn sq. ft in 45 cities.
Lot Size: 50 shares and in multiple
thereafter
Further, the company has plans to increase total retail space by 2.1mn sq. ft by
2020, which will support its growth.
Post-issue implied mkt. cap: *`1,8410cr -
**`1,8660cr
Huge potential for growth in F&G: In the modern retail, Food & Grocery (F&G)
has lower penetration compared to other categories like apparel & accessories,
Promoters holding Pre-Issue: 91.4%
footwear, jewellery & watches, consumer electronics, etc. Going forward, we
Promoters holding Post-Issue: 82.2%
expect the penetration in this category to improve, which will benefit the organised
*Calculated on lower price band
players like D-Mart.
** Calculated on upper price band
Track record of healthy financial performance: ASL has reported revenue CAGR
of ~40% over FY2012-16 on the back of (1) same store growth and (2)
Book Building
expansion of its business by adding new stores. On the bottom-line front, the
company has reported CAGR of ~52% over FY2012-16 due to good business
QIBs
50% of issue
and gradual improvement in the operating margins. Return on equity has also
Non-Institutional
15% of issue
improved from 9% in FY2012 to 32% in FY2016.
Retail
35% of issue
Outlook and Valuation: At the upper end of the price band, the pre-issue P/E
works out to be 32.5x its annualised 9MFY2017 earnings, which is lower
compared to P/E multiple of its peers i.e. Trent - 73.9x, Shoppers Stop - 123.8x
Post Issue Shareholding Pattern
and Future Retail 36.5x. Better RoE profile, promoter’s strong background,
strategically located stores, intense focus on maintaining lower costs and strong
Promoters
82.2%
brand perception are the compelling factors indicating that ASL is a long term story
Others
17.8%
that will unfold going ahead. Thus, we recommend a SUBSCRIBE on this issue.
Key Financials
Y/E March (` cr)
FY2014
FY2015
FY2016
9MHFY17
Net Sales
4,686
6,439
8,588
8,784
% chg
40.3
37.4
33.4
-
Net Profit
161
212
319
387
% chg
71.9
31.2
50.6
OPM (%)
7.3
7.1
7.7
8.8
EPS (`)
2.9
3.8
5.7
6.9
P/E (x)
104.0
79.3
52.7
-
P/BV (x)
17.6
14.0
11.1
-
RoE (%)
25.6
27.0
32.4
-
RoCE (%)
19.4
19.3
22.1
-
Amarjeet S Maurya
EV/Sales (x)
3.7
2.7
2.1
-
+91 22 39357800 Ext: 6831
EV/EBITDA (x)
50.4
38.1
26.8
-
Source: Company, Angel Research; Note: Valuation ratios based on pre-issue outstanding shares and at upper end of the price band
Please refer to important disclosures at the end of this report
1
Avenue Supermarts | IPO Note
Company background
Incorporated in 2002, Avenue Supermarts Limited (ASL) is a Mumbai based
supermarket chain under the name of D-Mart. Company is among the largest and
the most profitable F&G retailers in India. Company offers a wide range of
products with a focus on the Foods, Non-Foods (FMCG) and General Merchandise
& Apparel product categories.
Company has 118 stores with total retail business area of 3.59mn sq. ft in
45 cities spread across 9 states and 1 Union Territory in India. Company also
operates distribution centres and packing centres which form the backbone of the
supply chain to support its retail store network. Company has 21 distribution
centres and six packing centres in Maharashtra, Gujarat, Telangana and
Karnataka.
Exhibit 1: Revenue Mix (9MFY2017)
27.6%
52.8%
19.6%
Foods
Non-Foods (FMCG)
General Merchandise & Apparel
Source: Company, Angel Research
March 4, 2017
2
Avenue Supermarts | IPO Note
Issue details
The company is raising `1,870cr through a fresh issue of equity shares in the price
band of `295-299. The fresh issue will constitute ~10% of the post-issue paid-up
equity share capital of the company, assuming the issue is subscribed at the upper
end of the price band.
Exhibit 2: Pre and Post-IPO shareholding pattern
No. of shares (Pre-issue)
(%) No. of shares (Post-issue)
(%)
Promoters
51,30,25,392
91
51,30,25,392
82
Others
4,85,17,288
9
11,10,59,094
18
56,15,42,680
100
62,40,84,486
100
Source: RHP, Angel Research; Note: Calculated on upper price band
Objects of the offer
Repayment or prepayment of a portion of loans and redemption/ earlier
redemption of NCDs availed by Company - `1,080cr
Construction and purchase of fit outs for new stores - `367cr
General corporate purpose
March 4, 2017
3
Avenue Supermarts | IPO Note
Investment Rationale
Market sentiment moving in favour of organized sector to aid
growth
The Indian Retail industry is currently valued at US$616bn and is mainly
dominated by the unorganized sector (accounting for 91% share). Industry reports
indicate that the Retail sector is expected to grow at a CAGR of 12% over FY2016-
20E to ~US$960bn, within which, the organized segment is expected to grow at a
faster pace than the unorganized segment. The share of organized players is
expected to improve from 9% to ~12% in FY2020E, thus benefitting organised
players like D-Mart.
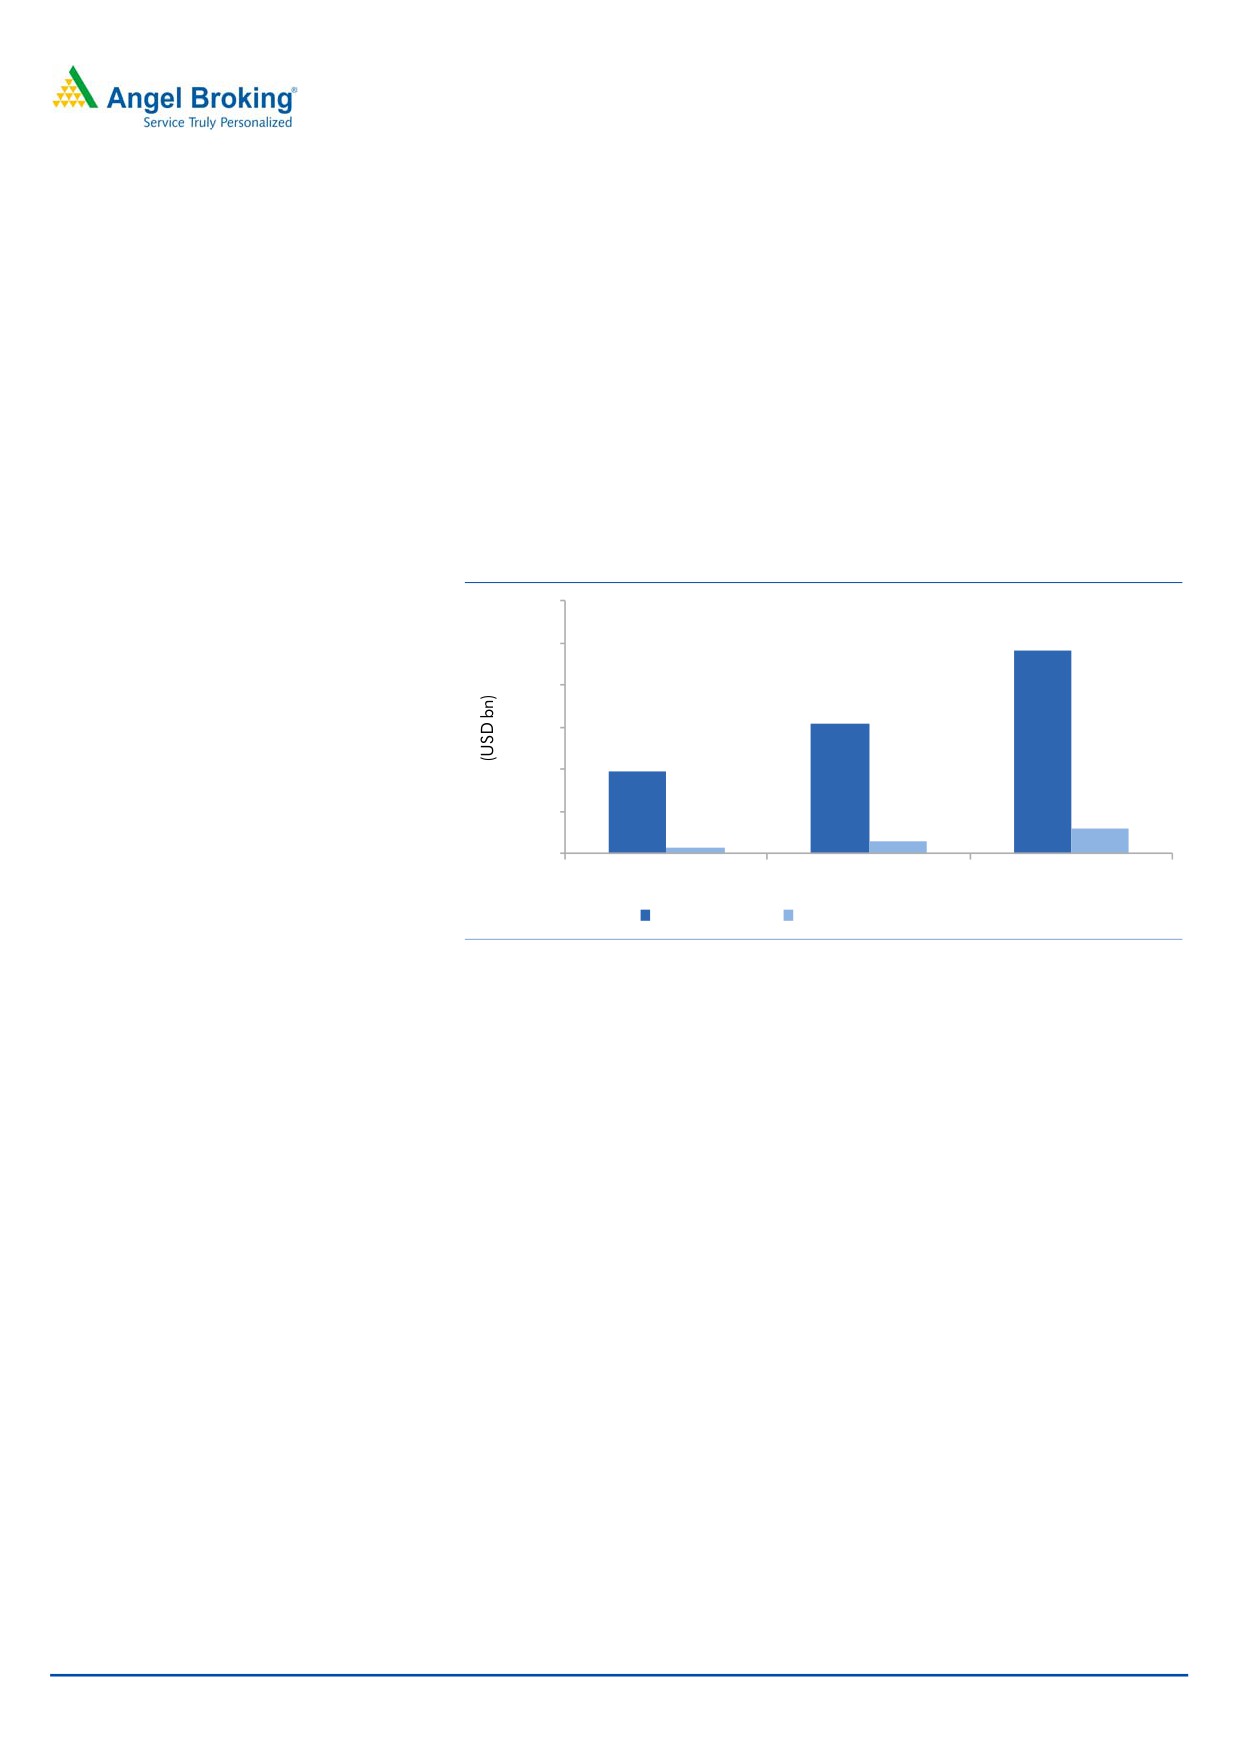
Exhibit 3: Market trend moving toward organised segment
1,200
960
1,000
800
616
600
386
400
200
115
55
27
0
FY2012
FY2016
FY2020
Overall Retail
Organized Brick & Mortar Retail
Source: Company, Angel Research
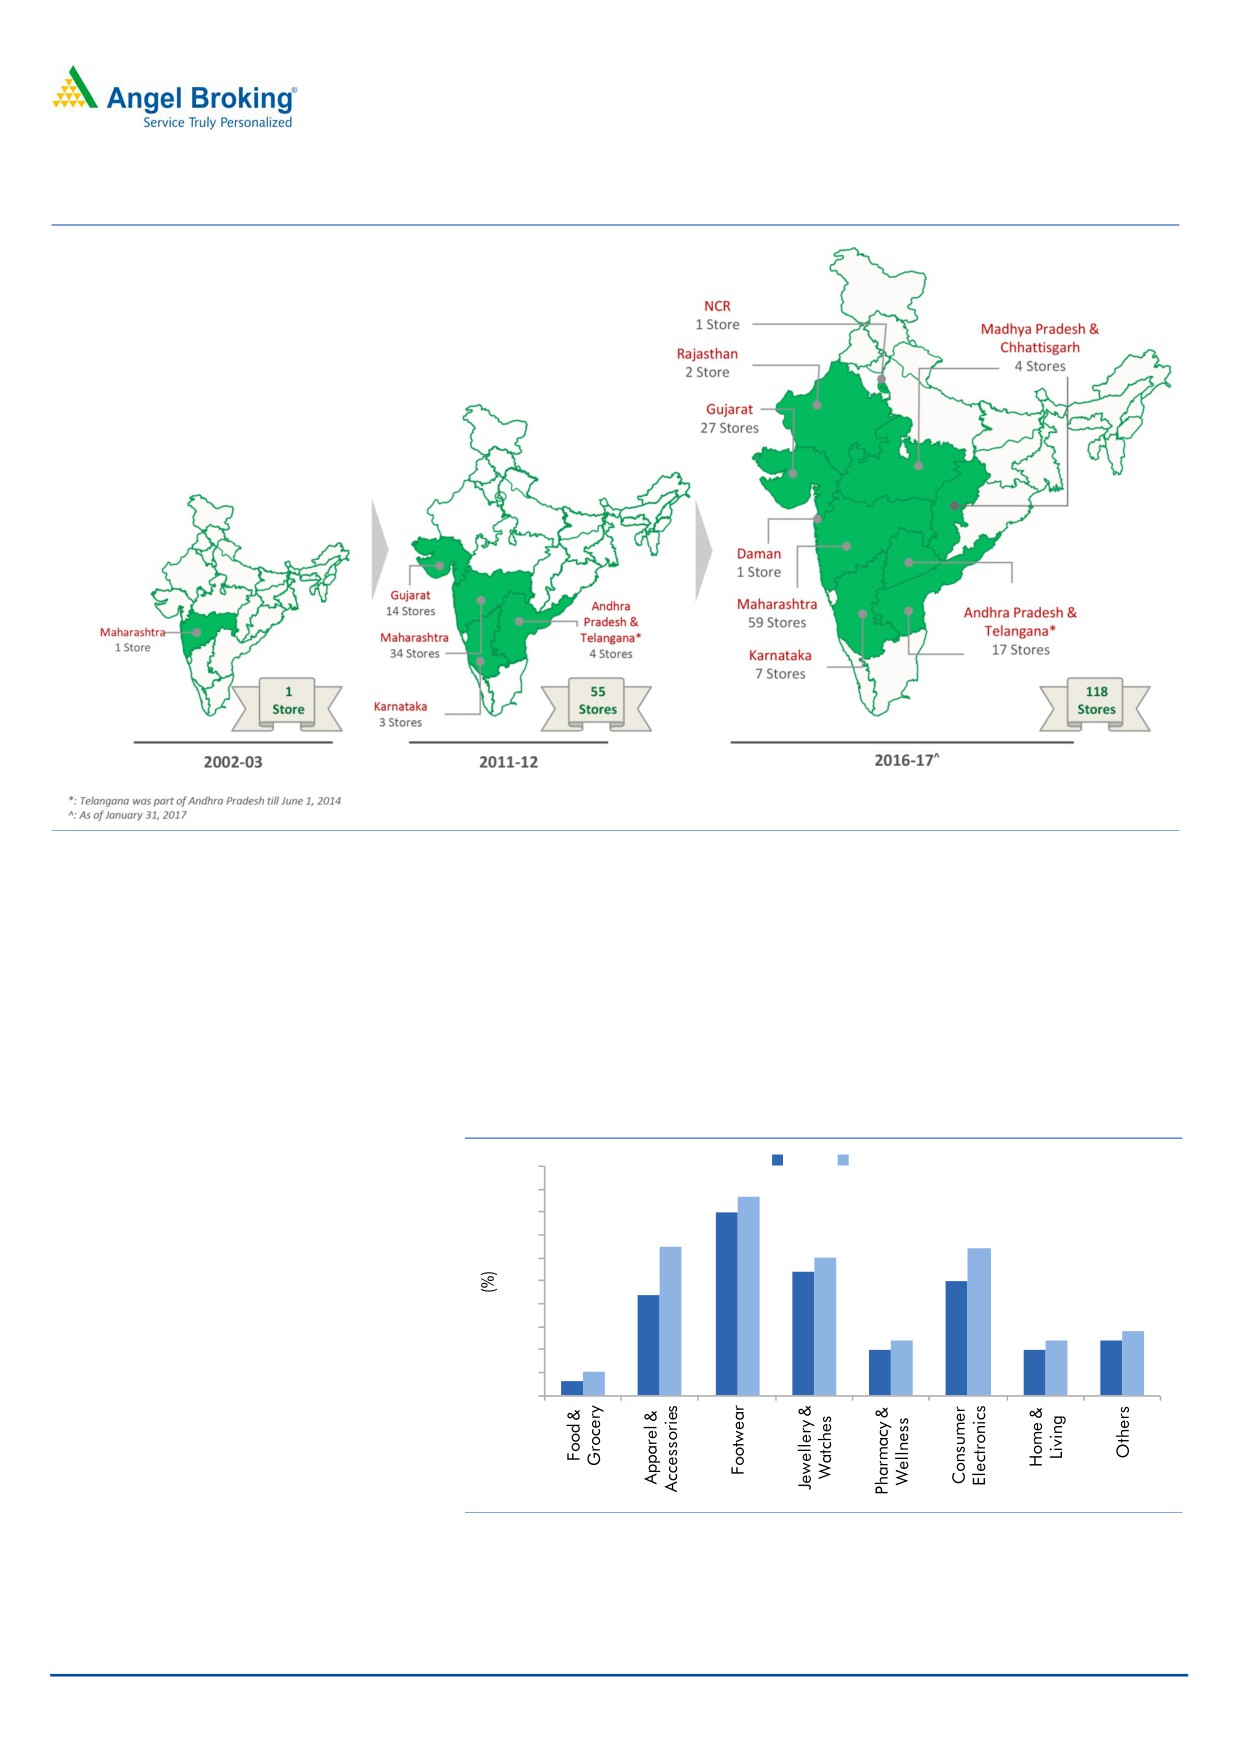
Steady footprint expansion
ASL has increased its store count from 45 in FY2011 to 118 in 9MFY2017, which
is around 3.9mn sq. ft total retail business area in 45 cities spread across 9 states
and 1 Union Territory. Further, the company has expansion plans to increase their
retail space by 2.1mn sq. ft by 2020. Company operates stores in locations where
it has the maximum growth possibility. It’s strategies such as (1) Medium sized
stores instead of large format stores, (2) standalone stores than stores in malls,
(3) maximum owned stores than leased stores, (4) focus on urban + rural than
only urban, and (5) maintaining profits at the store level, have proved to be very
successful for ASL. Company has indicated that it will continue to operate the same
strategy for the new stores as well, which gives a strong sense that it will maintain
the growth trajectory going ahead.
March 4, 2017
4
Avenue Supermarts | IPO Note
Exhibit 4: Expanding footprint
Source: Company, Angel Research
Low penetration provides huge potential for growth in F&G
Currently in the modern retail, Food & Grocery (F&G) has lower penetration
compared to other categories like apparel & accessories, footwear, jewellery &
watches, consumer electronics, etc. Going forward, we expect the penetration in
this category to improve, which in turn will prove beneficial for the big organised
players like D-Marts.
Exhibit 5: Modern Retail Penetration Category wise
2016
2020
50
43.5
45
40
40
32.5
32
35
30
30
27
25
25
22
20
14
15
12
12
12
10
10
10
5
3
5
0
Source: Company, Angel Research
March 4, 2017
5
Avenue Supermarts | IPO Note
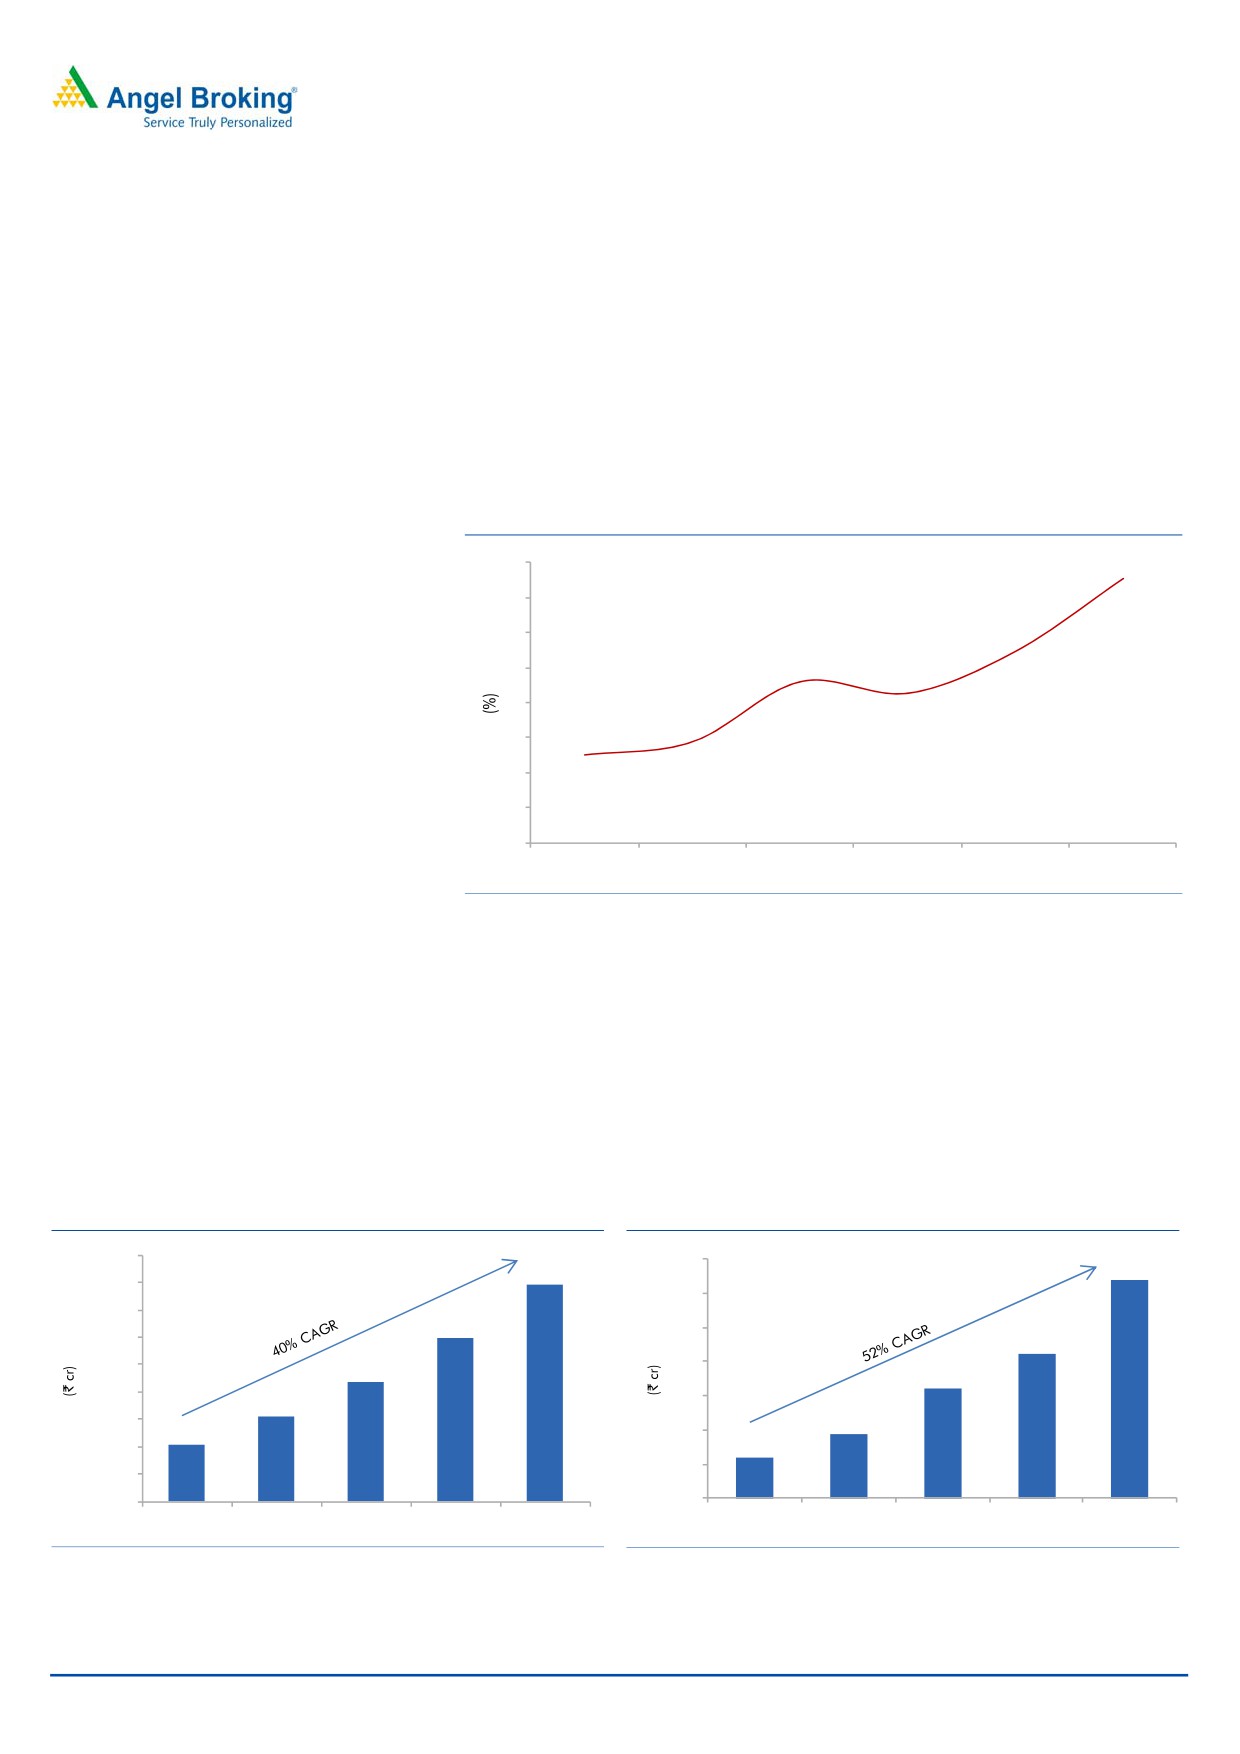
Consistently improving margins in a low margin industry
While growing its business, company has not compromised on its profitability,
which can be seen in its healthy operating profit margins over FY2012-16. While it
continues to attract consumers by keeping low prices every day, it also maintains
lower operating costs every day, which shows that management is involved in the
day to day operations and maintains a strong discipline in costs. While margins
are not likely to go up from the current levels, focus on strong operational
efficiency is likely to keep margins at the current levels, which we think is a
comfortable level.
Exhibit 6: Strong operating margin improvement
9
9
8
8
7
7
6
6
5
FY2012
FY2013
FY2014
FY2015
FY2016
9MFY17
Source: Company, Angel Research
Track record of healthy financial performance
The company has reported revenue CAGR of ~40% over FY2012-16 on the back
of strong growth in number of stores and also growth in existing stores. On the
bottom-line front, the company has reported CAGR of ~52% over FY2012-16 on
the back strong revenue growth and gradual improvement n operating margins.
Further, the company has also improved its ROE from 9% in FY2012 to 32% in
FY2016.
Exhibit 7: Historical revenue trend
Exhibit 8: Historical PAT trend
9,000
350
7,925
319
8,000
300
7,000
5,980
250
6,000
212
5,000
4,345
200
161
4,000
3,126
150
3,000
94
2,071
100
60
2,000
50
1,000
-
0
FY2012
FY2013
FY2014
FY2015
FY2016
FY2012
FY2013
FY2014
FY2015
FY2016
Source: Company, Angel Research
Source: Company, Angel Research
March 4, 2017
6
Avenue Supermarts | IPO Note
Outlook and Valuation
At the upper end of the price band, the pre-issue P/E works out to be 32.5x its
annualised 9MFY2017 earnings, which is lower compared to P/E multiple of its
peerss i.e. Trent - 73.9x, Shoppers Stop - 123.8x and Future Retail 36.5x. Better
RoE profile, promoter’s strong background, strategically located stores, intense
focus on maintaining lower costs and strong brand perception are the compelling
factors indicating that ASL is a long term story that will unfold going ahead. Thus,
we recommend a SUBSCRIBE on this issue.
Key risks
Increase in penetration of e-commerce
Increase in penetration of e-commerce in retails could affect the company’s
profitability
Increase in competition
Due to low entry barrier in business, the company could face increased
competition, which would impact the company’s profitability
March 4, 2017
7
Avenue Supermarts | IPO Note
Consolidated Income Statement
Y/E March (` cr)
FY2013
FY2014
FY2015
FY2016
9MFY17
Total operating income
3,341
4,686
6,439
8,588
8,784
% chg
51.3
40.3
37.4
33.4
-
Total Expenditure
3,126
4,345
5,980
7,925
8,014
Raw Material
2,857
3,984
5,487
7,308
7,416
Personnel
69
87
134
149
138
Others Expenses
200
273
359
468
461
EBITDA
215
342
459
663
770
% chg
55.8
59.0
34.3
44.6
-
(% of Net Sales)
6.4
7.3
7.1
7.7
8.8
Depreciation& Amortisation
46
57
82
98
92
EBIT
169
285
377
565
678
% chg
68.3
68.3
32.5
49.7
-
(% of Net Sales)
5.1
6.1
5.9
6.6
7.7
Interest & other Charges
43
56
72
91
91
Other Income
14
16
18
18
19
(% of PBT)
10.1
6.5
5.6
3.7
3.2
Share in profit of Associates
-
-
-
-
-
Recurring PBT
141
245
323
492
606
% chg
59.9
73.8
32.0
52.2
Tax
47
83
111
172
213
PAT (reported)
94
161
212
321
393
% chg
55.1
72.3
31.6
50.9
-
(% of Net Sales)
2.8
3.4
3.3
3.7
4.5
Adj.
0.2
(0.1)
(0.7)
(1.7)
(5.4)
PAT after adj.
94
161
212
319
387
(% of Net Sales)
2.8
3.4
3.3
3.7
4.4
Basic & Fully Diluted EPS (`)
1.7
2.9
3.8
5.7
6.9
% chg
55.4
71.9
31.2
50.6
-
March 4, 2017
8
Avenue Supermarts | IPO Note
Consolidated Balance Sheet
Y/E March (` cr)
FY2013
FY2014
FY2015
FY2016
9MFY17
SOURCES OF FUNDS
Equity Share Capital
544
547
562
562
562
Reserves& Surplus
245
409
638
956
1,344
Shareholders Funds
790
956
1,199
1,518
1,905
Minority Interest
0
0
0
0
0
Total Loans
434
511
757
1,038
1,242
Deferred Tax Liability
20
27
31
40
48
Total Liabilities
1,243
1,494
1,987
2,596
3,195
APPLICATION OF FUNDS
Net Block
925
1,172
1,528
2,094
2,330
Capital Work-in-Progress
118
89
98
82
206
Investments
16
16
15
27
59
Current Assets
433
532
713
896
1,173
Inventories
276
378
540
672
848
Sundry Debtors
13
10
7
8
41
Cash
62
55
38
35
49
Loans & Advances
82
88
128
180
234
Other Assets
0
0
0
1
1
Current liabilities
249
314
368
502
573
Net Current Assets
185
218
346
394
601
Mis. Exp. not written off
-
-
-
-
-
Total Assets
1,243
1,494
1,987
2,596
3,195
March 4, 2017
9
Avenue Supermarts | IPO Note
Consolidated Cash Flow Statement
Y/E March (` cr)
FY2013
FY2014
FY2015
FY2016
9MFY17
Profit before tax
141
245
323
493
607
Depreciation
46
57
82
98
92
Change in Working Capital
(65)
(83)
(152)
(69)
(219)
Interest / Dividend (Net)
43
56
72
91
91
Direct taxes paid
37
75
100
164
185
Others
(74)
(152)
(202)
(330)
(376)
Cash Flow from Operations
127
198
222
447
378
(Inc.)/ Dec. in Fixed Assets
(239)
(272)
(477)
(648)
(466)
(Inc.)/ Dec. in Investments
9
2
4
(10)
(31)
Cash Flow from Investing
(231)
(270)
(474)
(658)
(497)
Issue of Equity
14
5
33
0
0
Inc./(Dec.) in loans
103
60
201
208
132
Others
0
1
0
1
1
Cash Flow from Financing
118
65
234
208
133
Inc./(Dec.) in Cash
14
(7)
(17)
(3)
14
Opening Cash balances
48
61
55
37
34
Closing Cash balances
61
55
37
34
48
Key Ratios
Y/E March
FY2013
FY2014
FY2015
FY2016
Valuation Ratio (x)
P/E (on FDEPS)
178.9
104.0
79.3
52.7
P/CEPS
120.4
76.9
57.1
40.1
P/BV
21.3
17.6
14.0
11.1
EV/Sales
5.1
3.7
2.7
2.1
EV/EBITDA
79.7
50.4
38.1
26.8
EV / Total Assets
13.8
11.5
8.8
6.8
Per Share Data (`)
EPS (Basic)
1.7
2.9
3.8
5.7
EPS (fully diluted)
1.7
2.9
3.8
5.7
Cash EPS
2.5
3.9
5.2
7.5
Book Value
14.1
17.0
21.4
27.0
Returns (%)
ROCE
13.8
19.4
19.3
22.1
Angel ROIC (Pre-tax)
14.8
20.4
19.8
22.7
ROE
17.8
25.6
27.0
32.4
Turnover ratios (x)
Inventory / Sales (days)
30
29
31
29
Receivables (days)
10
10
7
8
WC cycle (ex-cash) (days)
21
21
24
21
Note: Valuation ratios based on pre-issue outstanding shares and at upper end of the price band
March 4, 2017
10
Avenue Supermarts | IPO Note
Research Team Tel: 022 - 39357800
DISCLAIMER
Angel Broking Private Limited (hereinafter referred to as “Angel”) is a registered Member of National Stock Exchange of India Limited,
Bombay Stock Exchange Limited and Metropolitan Stock Exchange Limited. It is also registered as a Depository Participant with CDSL
and Portfolio Manager with SEBI. It also has registration with AMFI as a Mutual Fund Distributor. Angel Broking Private Limited is a
registered entity with SEBI for Research Analyst in terms of SEBI (Research Analyst) Regulations, 2014 vide registration number
INH000000164. Angel or its associates has not been debarred/ suspended by SEBI or any other regulatory authority for accessing
/dealing in securities Market. Angel or its associates/analyst has not received any compensation / managed or co-managed public
offering of securities of the company covered by Analyst during the past twelve months.
This document is solely for the personal information of the recipient, and must not be singularly used as the basis of any investment
decision. Nothing in this document should be construed as investment or financial advice. Each recipient of this document should
make such investigations as they deem necessary to arrive at an independent evaluation of an investment in the securities of the
companies referred to in this document (including the merits and risks involved), and should consult their own advisors to determine
the merits and risks of such an investment.
Reports based on technical and derivative analysis center on studying charts of a stock's price movement, outstanding positions and
trading volume, as opposed to focusing on a company's fundamentals and, as such, may not match with a report on a company's
fundamentals. Investors are advised to refer the Fundamental and Technical Research Reports available on our website to evaluate the
contrary view, if any.
The information in this document has been printed on the basis of publicly available information, internal data and other reliable
sources believed to be true, but we do not represent that it is accurate or complete and it should not be relied on as such, as this
document is for general guidance only. Angel Broking Pvt. Limited or any of its affiliates/ group companies shall not be in any way
responsible for any loss or damage that may arise to any person from any inadvertent error in the information contained in this report.
Angel Broking Pvt. Limited has not independently verified all the information contained within this document. Accordingly, we cannot
testify, nor make any representation or warranty, express or implied, to the accuracy, contents or data contained within this document.
While Angel Broking Pvt. Limited endeavors to update on a reasonable basis the information discussed in this material, there may be
regulatory, compliance, or other reasons that prevent us from doing so.
This document is being supplied to you solely for your information, and its contents, information or data may not be reproduced,
redistributed or passed on, directly or indirectly.
Neither Angel Broking Pvt. Limited, nor its directors, employees or affiliates shall be liable for any loss or damage that may arise from
or in connection with the use of this information.
March 4, 2017
11