3QFY2016 Result Update | FMCG
January 20, 2016
Asian Paints
NEUTRAL
CMP
`845
Performance Highlights
Target Price
-
Quarterly Data
Investment Period
-
(` cr)
3QFY16
3QFY15
% yoy
2QFY16
% qoq
Revenue
4,160
3,653
13.9
3,779
10.1
Stock Info
EBITDA
748
585
27.9
621
20.5
Sector
FMCG
Margin (%)
18.0
16.0
(197bp)
16.4
(156bp)
Market Cap (` cr)
81,071
Adj. PAT
499
368
35.4
399
25.0
Net Debt (` cr)
-1,374
Source: Company, Angel Research
Beta
0.8
52 Week High / Low
925 / 693
Asian Paints’ posted a healthy performance for 3QFY2014, both on the top-line
Avg. Daily Volume
91,960
as well as the bottom-line front. For the quarter, the company’s top-line grew by
Face Value (`)
1
13.9% yoy to `4,160cr while the reported Adj.PAT grew ~35% yoy to `499cr.
BSE Sensex
24,480
Key highlights: For 3QFY2016, Asian Paints’ consolidated top-line posted a
Nifty
7,435
double-digit growth of 13.9% yoy to `4,160cr on the back of healthy festival
Reuters Code
ASPN.BO
season demand. However, heavy rainfall in south India did impact its sales
Bloomberg Code
APNT@IN
performance. The company’s protective and powder coatings business did well
with the segment benefitting from lower material prices. Its international business
posted healthy growth, particularly in the Middle East and Bangladesh. However
Shareholding Pattern (%)
as per the Management, the domestic demand environment continues to be
Promoters
52.8
challenging.
MF / Banks / Indian Fls
15.3
On the operating profit front, the company reported a growth of 27.9% yoy due to
FII / NRIs / OCBs
18.8
healthy sales growth and lower material prices. The operating profit margin was
Indian Public / Others
13.1
up by 197bp yoy to 18.0% due to easing material prices and employee costs as a
percentage of sales. During the quarter, the company reported an adjusted net
profit of 35.4% yoy to `499cr.
Abs. (%)
3m 1yr 3yr
Sensex
(11.6)
(5.9)
20.7
Outlook and valuation: We expect Asian Paints to post a ~10.2% and ~11.9%
CAGR in its top-line and bottom-line respectively, over FY2015-18E. At the current
Asian Paints
2.5
0.2
96.1
market price, the stock is trading at 40.9x FY2018E earnings. We maintain our
Neutral view on the stock.
3-year price chart
Key financials (Consolidated)
Y/E March (` cr)
FY2015
FY2016
FY2017E
FY2018E
1000
900
Net sales
14,183
15,403
17,128
18,978
800
% chg
11.6
8.6
11.2
10.8
700
Adj. Net profit
1,414
1,705
1,835
1,984
600
500
% chg
15.4
20.6
7.6
8.1
400
EBITDA margin (%)
15.6
17.4
16.8
16.4
300
EPS (`)
14.7
17.8
19.1
20.7
P/E (x)
57.3
47.5
44.2
40.9
Source: Company, Angel Research
P/BV (x)
17.1
16.3
15.4
14.5
RoE (%)
29.4
34.3
34.8
35.5
RoCE (%)
37.6
44.3
45.1
46.2
EV/Sales (x)
5.6
5.2
4.6
4.2
Amarjeet S Maurya
022-39357800 Ext: 6831
EV/EBITDA (x)
36.1
29.7
27.7
25.6
Source: Company, Angel Research; Note: CMP as of January 19, 2016
Please refer to important disclosures at the end of this report
1
Asian Paints | 3QFY2016 Result Update
Exhibit 1: Consolidated quarterly performance
Y/E March (` cr)
3QFY16
3QFY15
% yoy
2QFY15
% qoq
9MFY16
9MFY15
% chg
Net Sales
4,160
3,653
13.9
3,779
10.1
11,563
10,648
8.6
Consumption of RM
2,200
2,052
7.2
2,032
8.3
6,179
6,030
2.5
(% of Sales)
52.9
56.2
53.8
53.4
56.6
Staff Costs
247
232
6.5
247
0.1
741
691
7.3
(% of Sales)
5.9
6.3
6.5
6.4
6.5
Other Expenses
965
784
23.0
880
9.6
2,591
2,277
13.8
(% of Sales)
23.2
21.5
23.3
22.4
21.4
Total Expenditure
3,412
3,068
11.2
3,159
8.0
9,510
8,997
5.7
Operating Profit
748
585
27.9
621
20.5
2,052
1,650
24.4
OPM
18.0
16.0
16.4
17.8
15.5
Interest
8
10
(22.2)
9
(17.5)
26
25
4.8
Depreciation
73
67
7.7
71
2.3
213
199
7.0
Other Income
36
31
17.3
58
(37.8)
167
128
30.2
PBT (excl. Ext Items)
704
538
30.7
598
17.7
1,981
1,555
27.4
Ext (Income)/Expense
-
-
-
-
-
-
-
-
PBT (incl. Ext Items)
704
538
30.7
598
17.7
1,981
1,555
27.4
(% of Sales)
16.9
14.7
15.8
17.1
14.6
Provision for Taxation
229
167
184
624
480
30.0
(% of PBT)
32.5
31.0
30.7
31
31
Reported PAT
475
372
27.8
415
14.6
1,357
1,075
26.2
PATM
11.4
10.2
11.0
11.7
10.1
Minority Interest After NP
11.7
3.5
15.6
39.5
21.2
Extra-ordinary Items
(35)
-
-
-
--
-
-
-
Reported PAT
499
368
35.4
399
25.0
1,317
1,054
25.0
Equity shares (cr)
96
96
96
96
96
FDEPS (`)
5.2
3.8
35.4
4.2
25.0
13.7
11.0
25.0
Source: Company, Angel Research
January 20, 2016
2
Asian Paints | 3QFY2016 Result Update
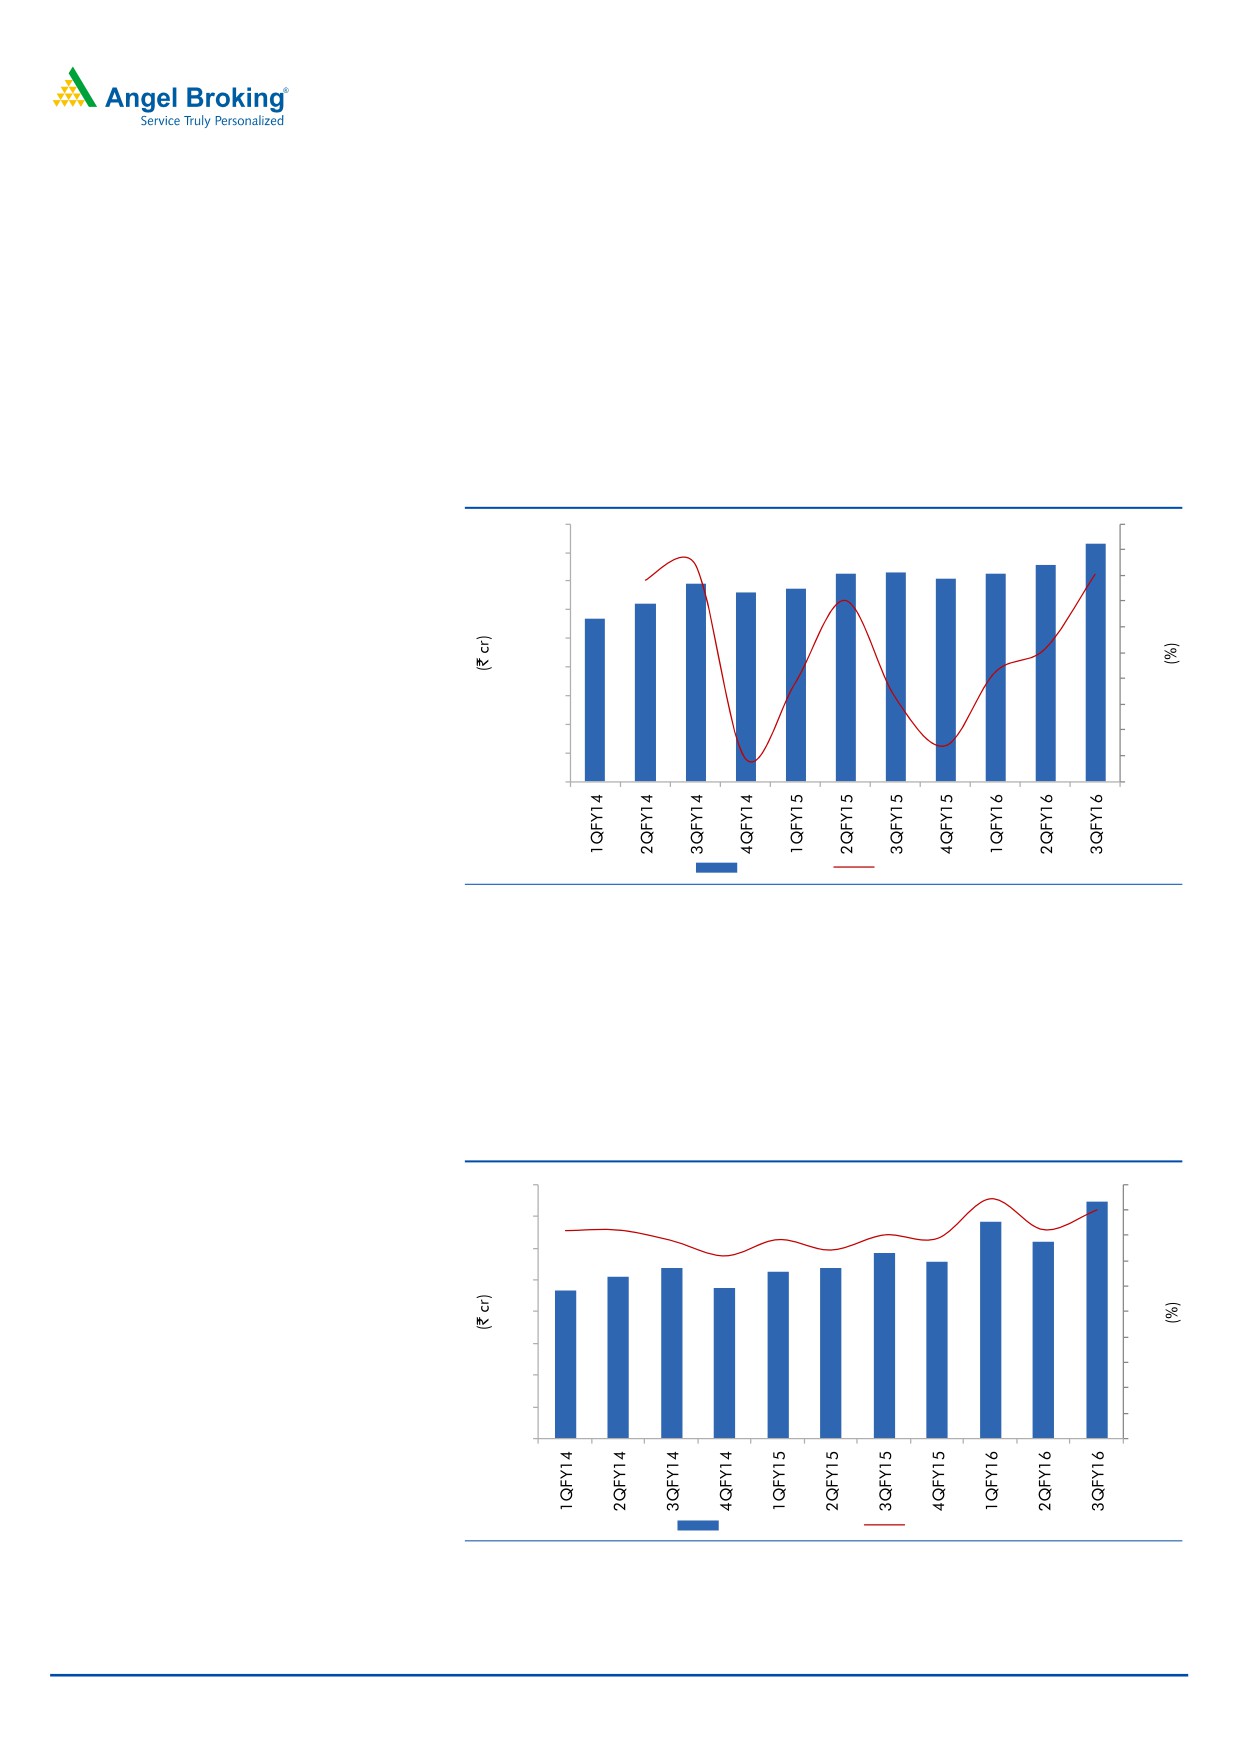
Healthy top-line growth
For 3QFY2016, Asian Paints’ consolidated top-line posted a double-digit growth
of 13.9% yoy to `4,160cr on the back of healthy festival season demand.
However, heavy rainfall in south India did impact its sales performance. The
company’s protective and powder coatings business did well with the segment
benefitting from lower material prices. Its international business posted healthy
growth, particularly in the Middle East and Bangladesh. However as per the
Management, the domestic demand environment continues to be challenging.
Exhibit 2: Top-line growth trend
4,500
14
4,000
12
3,500
10
8
3,000
6
2,500
4
2,000
2
1,500
-
1,000
(2)
500
(4)
0
(6)
Net Sales
QoQ growth (%)
Source: Company, Angel Research
Operating margin up due to lower material prices
On the operating profit front, the company reported a growth of 27.9% yoy due to
healthy sales growth and lower material prices. The operating profit margin was
up by 197bp yoy to 18.0% due to easing material prices and employee costs as a
percentage of sales.
Exhibit 3: Operating profit and margin trend
800
20
18
700
16
600
14
500
12
400
10
8
300
6
200
4
100
2
0
0
Operating Profit
Margin (%)
Source: Company, Angel Research
January 20, 2016
3
Asian Paints | 3QFY2016 Result Update
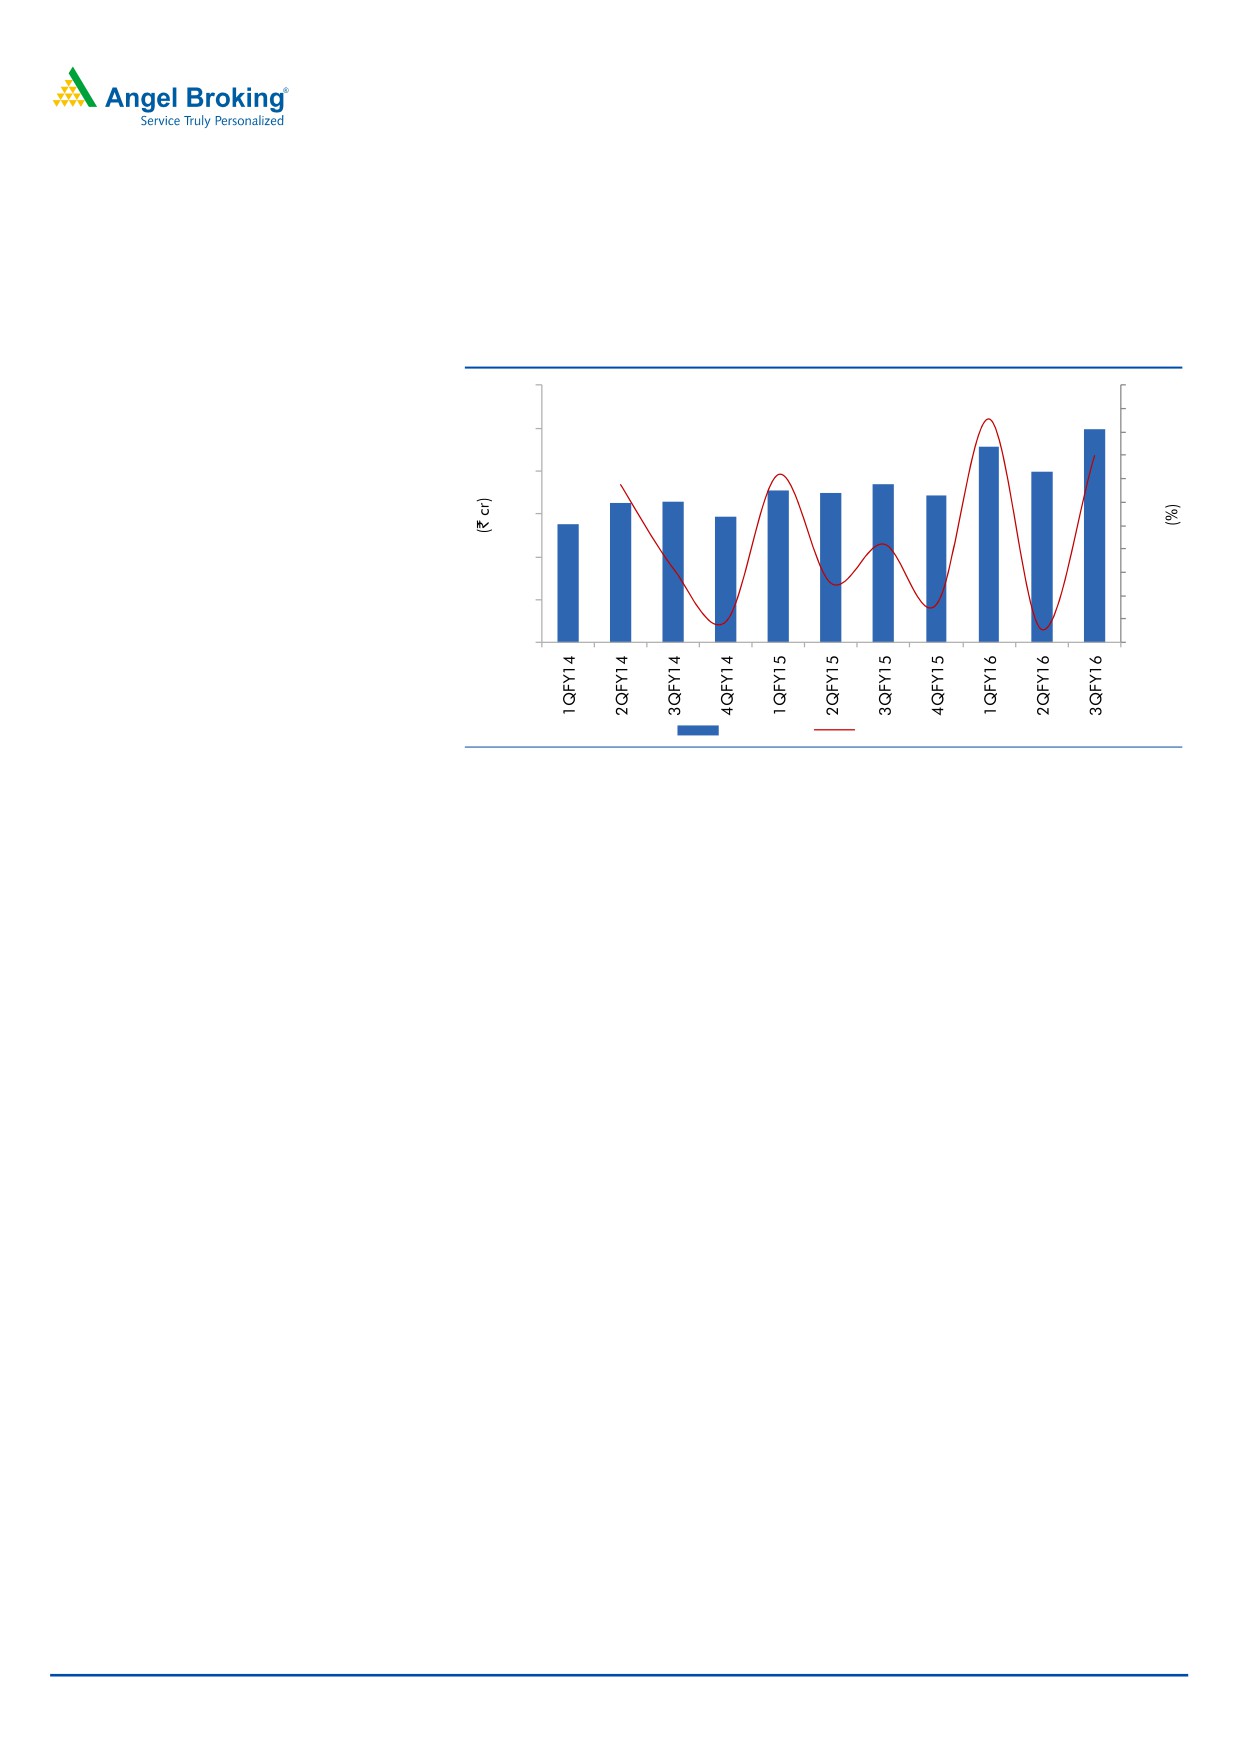
Adjusted PAT grew ~35.4% yoy
During the quarter, the company reported an adjusted net profit of 35.4% yoy to
`499cr.
Exhibit 4: Net Profit and growth trend
600
40
35
500
30
25
400
20
15
300
10
5
200
-
100
(5)
(10)
0
(15)
Net Profit
QOQ growth (%)
Source: Company, Angel Research
January 20, 2016
4
Asian Paints | 3QFY2016 Result Update
Investment rationale
Market leadership in India
Asian Paints is the largest paint company in India with a leadership position in the
decorative paint segment with market share in excess of 50%. The overall weak
demand environment in the economy has been impacting the domestic decorative
paint market in the recent past. We believe that with gradual recovery in the
economy, coupled with increased focus of the government on infrastructure
spending, Asian Paints stands to benefit owing to its vast dealer network and
strong brand equity.
Stable raw material price to aid margin
Since raw materials are crude derivatives, lower crude prices are positive for paint
companies. We believe that with oil prices likely to be stable at current levels in the
near term, Asian Paints’ margins are likely to expand.
Outlook and valuation
We expect Asian Paints to post a ~10.2% and ~11.9% CAGR in its top-line and
bottom-line respectively, over FY2015-18E. At the current market price, the stock is
trading at 40.9x FY2018E earnings. We maintain our Neutral view on the stock.
Company background
Asian Paints is India's largest paint company, with a market share of ~50%. The
company is mainly present in the decorative segment, which contributes over 75%
of its sales. The company features among the top 10 decorative paint players
globally. It has a large distribution network of over 25,000 dealers and 27,000
'Colour World' outlets across India. The company's international revenue comes
from countries in the Caribbean, Middle East, South Pacific and Asian regions.
January 20, 2016
5
Asian Paints | 3QFY2016 Result Update
Consolidated Profit & Loss Statement
Y/E March (` cr)
FY2013
FY2014
FY2015
FY2016E FY2017E FY2018E
Total operating income
10,939
12,715
14,183
15,403
17,128
18,978
% chg
13.6
16.2
11.6
8.6
11.2
10.8
Total Expenditure
9,207
10,727
11,976
12,723
14,251
15,866
Raw Materials
6413
7341
7972
8287
9249
10248
Personnel Expenses
624
760
907
1,047
1,199
1,366
Others Expenses
2,170
2,626
3,096
3,389
3,803
4,251
EBITDA
1,732
1,988
2,208
2,680
2,878
3,112
% chg
14.8
14.8
11.1
21.4
7.4
8.2
(% of Net Sales)
15.8
15.6
15.6
17.4
16.8
16.4
Depreciation& Amortisation
155
246
266
291
313
336
EBIT
1,577
1,742
1,942
2,389
2,564
2,777
% chg
13.7
10.5
11.5
23.0
7.3
8.3
(% of Net Sales)
14.4
13.7
13.7
15.5
15.0
14.6
Interest & other Charges
37
42
35
36
38
40
Other Income
114
134
170
190
220
240
(% of PBT)
6.9
7.3
8.2
7.5
8.0
8.1
Share in profit of Associates
-
-
-
-
-
-
PBT (reported)
1,655
1,834
2,077
2,543
2,746
2,977
Tax
496
572
650
788
851
923
(% of PBT)
29.9
31.2
31.3
31.0
31.0
31.0
PAT (reported)
1,160
1,263
1,427
1,755
1,895
2,054
Less: Minority interest (MI)
46
44
32
50
60
70
PAT after MI (reported)
1,114
1,219
1,395
1,705
1,835
1,984
Prior Period & Extra. Exp./(Inc.)
-
(7)
(19)
-
-
-
ADJ. PAT
1,114
1,226
1,414
1,705
1,835
1,984
% chg
12.7
10.0
15.4
20.6
7.6
8.1
(% of Net Sales)
10.2
9.6
10.0
11.1
10.7
10.5
Basic & diluted EPS (`)
11.6
12.8
14.7
17.8
19.1
20.7
Adjusted EPS EPS (`)
11.6
12.8
14.7
17.8
19.1
20.7
% chg
12.7
10.0
15.4
20.6
7.6
8.1
January 20, 2016
6
Asian Paints | 3QFY2016 Result Update
Exhibit 5:
Y/E March (` cr)
FY2013 FY2014 FY2015 FY2016E FY2017E FY2018E
SOURCES OF FUNDS
Equity Share Capital
96
96
96
96
96
96
Reserves& Surplus
3,288
3,943
4,646
4,880
5,174
5,491
Shareholders Funds
3,384
4,039
4,742
4,976
5,270
5,587
Minority Interest
161
246
264
264
264
264
Total Loans
251
249
418
420
420
420
Deferred Tax Liability
195
231
247
247
247
247
Total Liabilities
3,991
4,765
5,671
5,906
6,200
6,517
APPLICATION OF FUNDS
Gross Block
3,429
3,804
4,112
4,442
4,772
5,102
Less: Acc. Depreciation
979
1,223
1,438
1,728
2,042
2,377
Less:Impairment of Assets
9
19
15
15
15
15
Net Block
2,441
2,562
2,660
2,699
2,716
2,710
Capital Work-in-Progress
59
72
196
196
196
196
Investments
296
1,424
1,588
1,588
1,588
1,588
Current Assets
3,989
4,019
4,468
5,104
5,875
6,652
Inventories
1,830
2,070
2,259
2,532
2,909
3,380
Sundry Debtors
981
1,110
1,180
1,350
1,596
1,768
Cash
737
229
204
266
308
328
Loans & Advances
313
454
511
616
685
759
Other Assets
128
156
315
339
377
418
Current liabilities
2,834
3,353
3,308
3,747
4,241
4,696
Net Current Assets
1,155
665
1,160
1,357
1,633
1,957
Deferred Tax Asset
41
43
67
67
67
67
Mis. Exp. not written off
-
-
-
-
-
-
Total Assets
3,991
4,765
5,671
5,906
6,200
6,517
January 20, 2016
7
Asian Paints | 3QFY2016 Result Update
Consolidated Cashflow Statement
Y/E March (` cr)
FY2013
FY2014
FY2015
FY2016E FY2017E FY2018E
Profit before tax
1,655
1,834
2,077
2,543
2,746
2,977
Depreciation
155
256
268
291
313
336
Change in Working Capital
(159)
(159)
(168)
(450)
(135)
(235)
Interest / Dividend (Net)
(7)
(10)
(37)
(47)
36
38
Direct taxes paid
(438)
(480)
(633)
(788)
(851)
(923)
Others
(19)
(39)
(320)
398
(99)
(66)
Cash Flow from Operations
1,187
1,402
1,188
1,947
2,011
2,127
(Inc.)/ Dec. in Fixed Assets
(522)
542
(301)
(343)
(344)
(345)
(Inc.)/ Dec. in Investments
59
(1,128)
(164)
-
-
-
Cash Flow from Investing
(463)
(586)
(465)
(343)
(344)
(345)
Issue of Equity
-
-
-
-
-
-
Inc./(Dec.) in loans
(102)
(37)
153
2
-
-
Dividend Paid (Incl. Tax)
(4,000)
(2,811)
(3,245)
(1,432)
(1,541)
(1,667)
Interest / Dividend (Net)
3,490
1,525
1,648
(112)
(84)
(95)
Cash Flow from Financing
(611)
(1,324)
(1,445)
(1,542)
(1,625)
(1,762)
Inc./(Dec.) in Cash
112
(508)
(722)
62
42
20
Opening Cash balances
624
737
926
204
266
308
Closing Cash balances
737
229
204
266
308
328
January 20, 2016
8
Asian Paints | 3QFY2016 Result Update
Key Ratios
Y/E March
FY2013
FY2014
FY2015
FY2016E FY2017E FY2018E
Valuation Ratio (x)
P/E (on FDEPS)
72.8
66.1
57.3
47.5
44.2
40.9
P/CEPS
61.7
53.7
47.9
39.6
36.7
33.9
P/BV
23.9
20.1
17.1
16.3
15.4
14.5
Dividend yield (%)
4.9
3.5
4.0
1.8
1.9
2.1
EV/Sales
7.3
6.3
5.6
5.2
4.6
4.2
EV/EBITDA
46.3
40.1
36.1
29.7
27.7
25.6
EV / Total Assets
11.8
9.8
8.9
8.2
7.6
7.1
Per Share Data (`)
EPS (Basic)
11.6
12.8
14.7
17.8
19.1
20.7
EPS (fully diluted)
11.6
12.8
14.7
17.8
19.1
20.7
Cash EPS
13.7
15.7
17.7
21.3
23.0
24.9
DPS
41.7
29.3
33.8
14.9
16.1
17.4
Book Value
35.3
42.1
49.4
51.9
54.9
58.2
Returns (%)
ROCE
43.4
40.6
37.6
44.3
45.1
46.2
ROE
32.9
30.2
29.4
34.3
34.8
35.5
Turnover ratios (x)
Asset Turnover (Gross Block)
3.2
3.3
3.4
3.5
3.6
3.7
Inventory / Sales (days)
61
59
58
60
62
65
Receivables (days)
33
32
30
32
34
34
Payables (days)
49
51
41
40
40
40
WC cycle (ex-cash) (days)
44
41
47
52
56
59
January 20, 2016
9
Asian Paints | 3QFY2016 Result Update
Research Team Tel: 022 - 39357800
DISCLAIMER
Angel Broking Private Limited (hereinafter referred to as “Angel”) is a registered Member of National Stock Exchange of India Limited,
Bombay Stock Exchange Limited and Metropolitian Stock Exchange of India Limited. It is also registered as a Depository Participant
with CDSL and Portfolio Manager with SEBI. It also has registration with AMFI as a Mutual Fund Distributor. Angel Broking Private
Limited is a registered entity with SEBI for Research Analyst in terms of SEBI (Research Analyst) Regulations, 2014 vide registration
number INH000000164. Angel or its associates has not been debarred/ suspended by SEBI or any other regulatory authority for
accessing /dealing in securities Market. Angel or its associates including its relatives/analyst do not hold any financial
interest/beneficial ownership of more than 1% in the company covered by Analyst. Angel or its associates/analyst has not received any
compensation / managed or co-managed public offering of securities of the company covered by Analyst during the past twelve
months. Angel/analyst has not served as an officer, director or employee of company covered by Analyst and has not been engaged in
market making activity of the company covered by Analyst.
This document is solely for the personal information of the recipient, and must not be singularly used as the basis of any investment
decision. Nothing in this document should be construed as investment or financial advice. Each recipient of this document should
make such investigations as they deem necessary to arrive at an independent evaluation of an investment in the securities of the
companies referred to in this document (including the merits and risks involved), and should consult their own advisors to determine
the merits and risks of such an investment.
Reports based on technical and derivative analysis center on studying charts of a stock's price movement, outstanding positions and
trading volume, as opposed to focusing on a company's fundamentals and, as such, may not match with a report on a company's
fundamentals.
The information in this document has been printed on the basis of publicly available information, internal data and other reliable
sources believed to be true, but we do not represent that it is accurate or complete and it should not be relied on as such, as this
document is for general guidance only. Angel Broking Pvt. Limited or any of its affiliates/ group companies shall not be in any way
responsible for any loss or damage that may arise to any person from any inadvertent error in the information contained in this report.
Angel Broking Pvt. Limited has not independently verified all the information contained within this document. Accordingly, we cannot
testify, nor make any representation or warranty, express or implied, to the accuracy, contents or data contained within this document.
While Angel Broking Pvt. Limited endeavors to update on a reasonable basis the information discussed in this material, there may be
regulatory, compliance, or other reasons that prevent us from doing so.
This document is being supplied to you solely for your information, and its contents, information or data may not be reproduced,
redistributed or passed on, directly or indirectly.
Neither Angel Broking Pvt. Limited, nor its directors, employees or affiliates shall be liable for any loss or damage that may arise from
or in connection with the use of this information.
Note: Please refer to the important ‘Stock Holding Disclosure' report on the Angel website (Research Section). Also, please refer to the
latest update on respective stocks for the disclosure status in respect of those stocks. Angel Broking Pvt. Limited and its affiliates may
have investment positions in the stocks recommended in this report.
Disclosure of Interest Statement
Hindustan Unilever
1. Analyst ownership of the stock
No
2. Angel and its Group companies ownership of the stock
No
3. Angel and its Group companies' Directors ownership of the stock
No
4. Broking relationship with company covered
No
Note: We have not considered any Exposure below ` 1 lakh for Angel, its Group companies and Directors
Ratings (Based on expected returns
Buy (> 15%)
Accumulate (5% to 15%)
Neutral (-5 to 5%)
over 12 months investment period):
Reduce (-5% to -15%)
Sell (< -15%)
January 20, 2016
10