Initiating Coverage | Ceramics
October 3, 2016
Asian Granito
BUY
CMP
`277
Merger to boost the margin
Target Price
`351
Asian Granito India (AGIL) is engaged in the manufacturing and sale of ceramic wall,
Investment Period
12 Months
ceramic floor, vitrified tiles, digital polished glazed vitrified tiles, digital wall tiles, marble,
and quartz. The company offers more than 1,200 designs and export its products in
50+ countries. It has eight manufacturing facilities spread across Gujarat and the
Stock Info
current combined capacity is 100,000 sq. mtrs per day.
Sector
Ceramics
Focus on high value product: AGIL’s current, vitrified sales (35%) are lower as compared
Market Cap (` cr)
836
to its peers like Somany Ceramics (47%) and Kajaria Ceramics (61%). Recently, AGIL
has launched various products in premium segments like Imperio, Jumbo - Double
Net Debt (` cr)
304
Charge, CARARRA White, XXL - Polished Glazed Vitrified Tiles, Polished Vitrified Tiles
Beta
1.3
(Double Charge) etc. Going forward, we expect AGIL’s profit margin to improve due to
52 Week High / Low
304/109
increase in focus for higher vitrified product sales, which is a high margin business.
Avg. Daily Volume
74,887
Shift from B2B to B2C would improve the margin: AGIL is continuously putting efforts to
increase the B2C sales from the current level (35% in FY16). It is expected to reach up to
Face Value (`)
10
50% in next 2-3 years on the back of various initiatives taken by AGIL to increase direct
BSE Sensex
27,866
interaction with customers like strengthening distribution network, opening exclusive
brand showrooms, trade schemes on high value products, participation in key trade
Nifty
8,611
exhibition, etc.
Reuters Code
ASGI.BO
Strengthening distribution network: AGIL has an extensive marketing and distribution
Bloomberg Code
ASIAN.IN
network. It comprises of more than 4,500 dealers and sub-dealers (~27% grew over
last two years) and more than 80 exclusive dealer showrooms covering each and every
state of the country. This helps the company in promoting its range of products in the
market and hence is planning to open 200 more exclusive dealer showrooms. Going
Shareholding Pattern (%)
forward, we expect the company to continue to expand its network through dealers &
Promoters
37.5
sub-dealers. Also, the company is opening 16 large format exclusive corporate
MF / Banks / Indian Fls
0.8
display stores for dealers and architects.
FII / NRIs / OCBs
0.1
Artistique Ceramic merger to boost margins: In July FY2016, AGIL acquired Artistique
Ceramic which has a better margin profile. Going forward, we expect the company to
Indian Public / Others
61.6
improve its operating margin from 7.5% in FY16 (excluding merger) to 12-12.5% in
coming financial year. Artisique Ceramics has a contract with RAS GAS to supply quality
natural gas at a discounted rate of 50% to current market rate, which would reduce the
Abs.(%)
3m
1yr
3yr
overall power & fuel cost of the company.
Sensex
3.2
6.5
43.8
Outlook and Valuation: Considering the various initiatives taken by the
government like smart cities, housing for all by 2022, and push towards providing
AGIL
43.9
118.4
1000.9
sanitation, would create new demand avenues for entry level or lower priced tiles
(ceramic tiles). We expect AGIL to report a net revenue CAGR of ~11% to
~`1,220cr over FY2016-18E. On bottom-line front, we expect CAGR of ~39% to
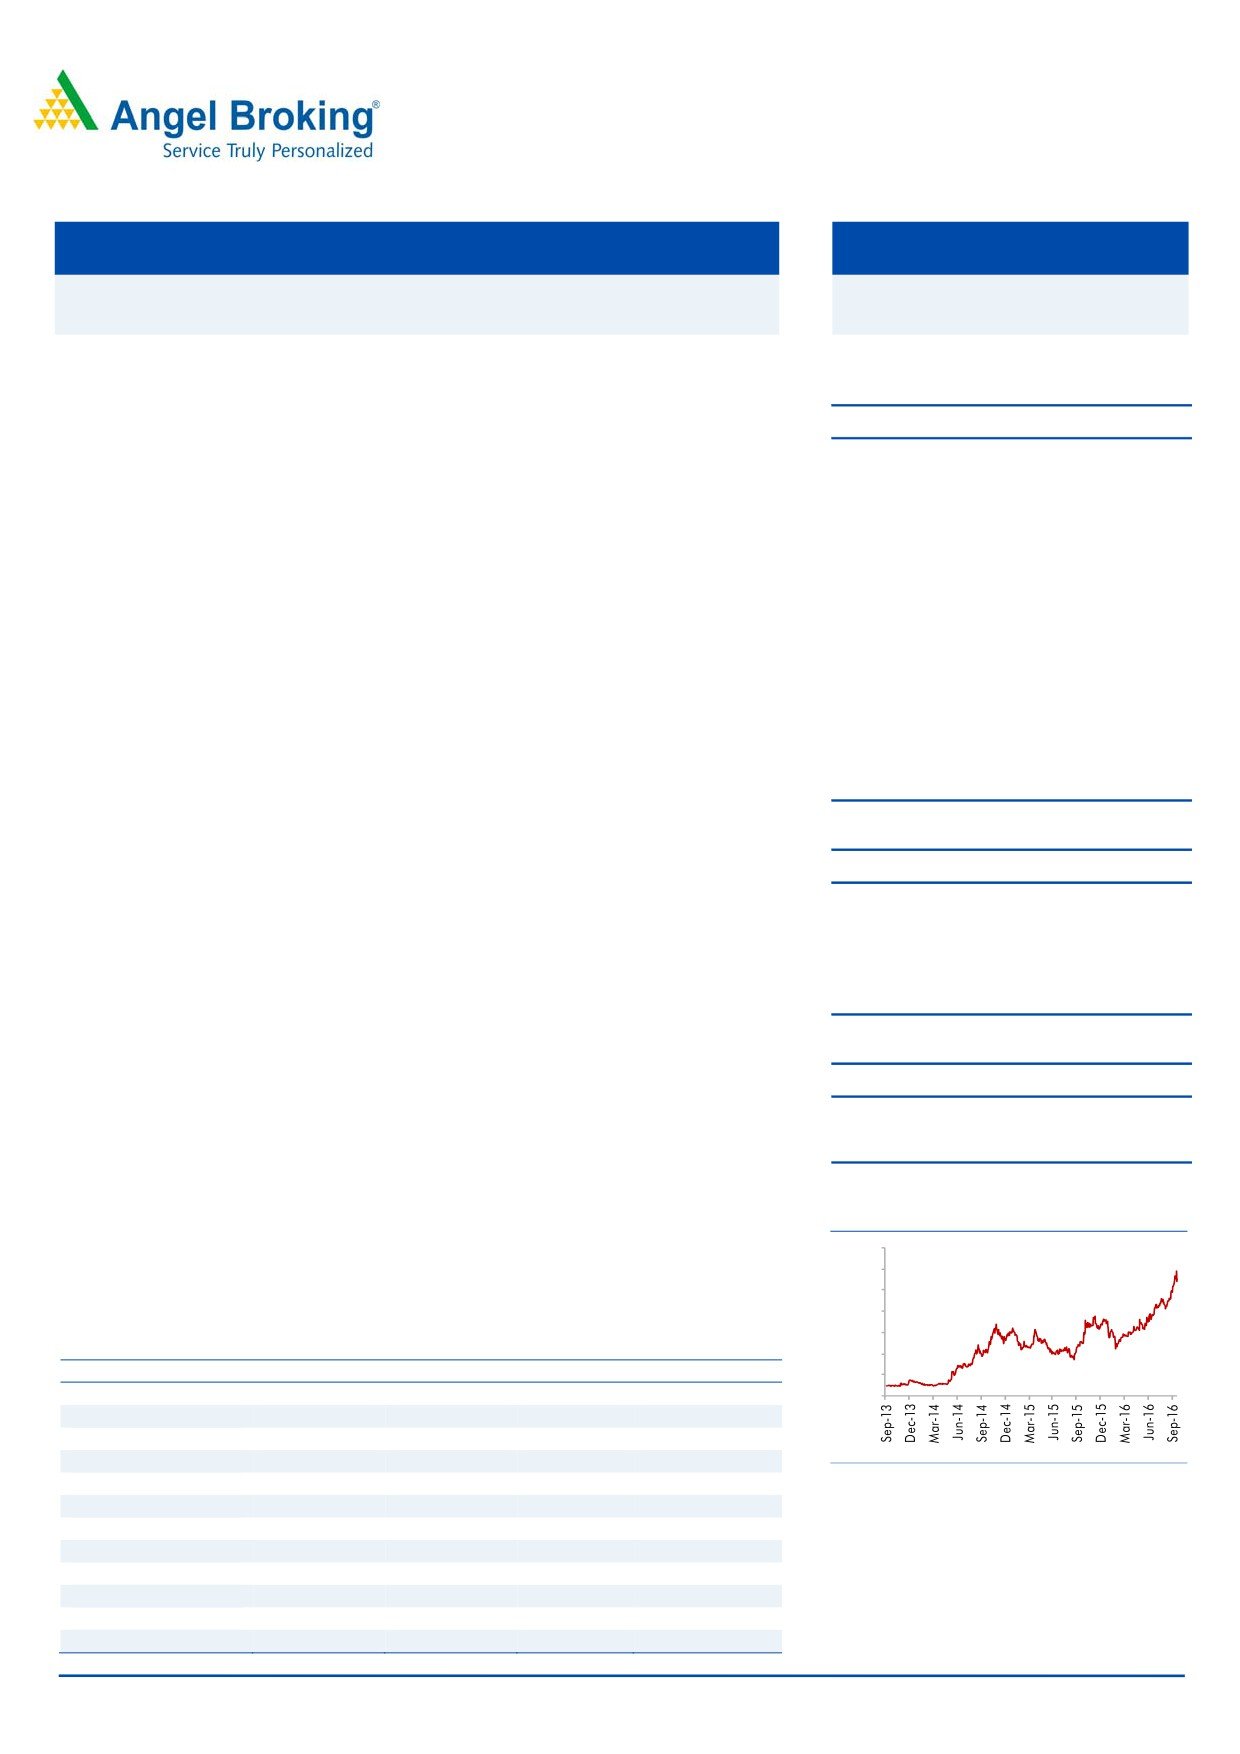
3-year price chart
`48cr over FY2016-18E owing to better product mix, higher B2C sales and
350
amalgamation synergy. We initiate coverage on the stock with a Buy
300
recommendation and target price of `351 (22x FY2018E EPS), indicating an upside
250
200
of ~27% from the current levels.
150
Key financials
100
Y/E March (` cr)
FY2015
FY2016
FY2017E
FY2018E
50
Net Sales
842
994
1,118
1,220
0
% chg
9.0
18.1
12.5
9.2
Net Profit
15
25
39
48
% chg
14.5
24.8
39.1
48.0
Source: Company, Angel Research
OPM (%)
7.2
9.1
11.8
12.0
EPS (`)
4.8
8.2
13.0
16.0
P/E (x)
57.5
33.6
21.3
17.3
P/BV (x)
2.9
2.3
2.1
1.9
RoE (%)
5.0
6.8
9.7
10.7
RoCE (%)
9.0
9.0
13.3
14.4
Amarjeet S Maurya
EV/Sales (x)
1.2
1.1
1.0
0.9
022-39357800 Ext: 6831
EV/EBITDA (x)
16.2
12.6
8.4
7.4
Source: Company, Angel Research, Note: CMP as of September 30, 2016
Please refer to important disclosures at the end of this report
1
Asian Granito | Initiating Coverage
Key investment arguments
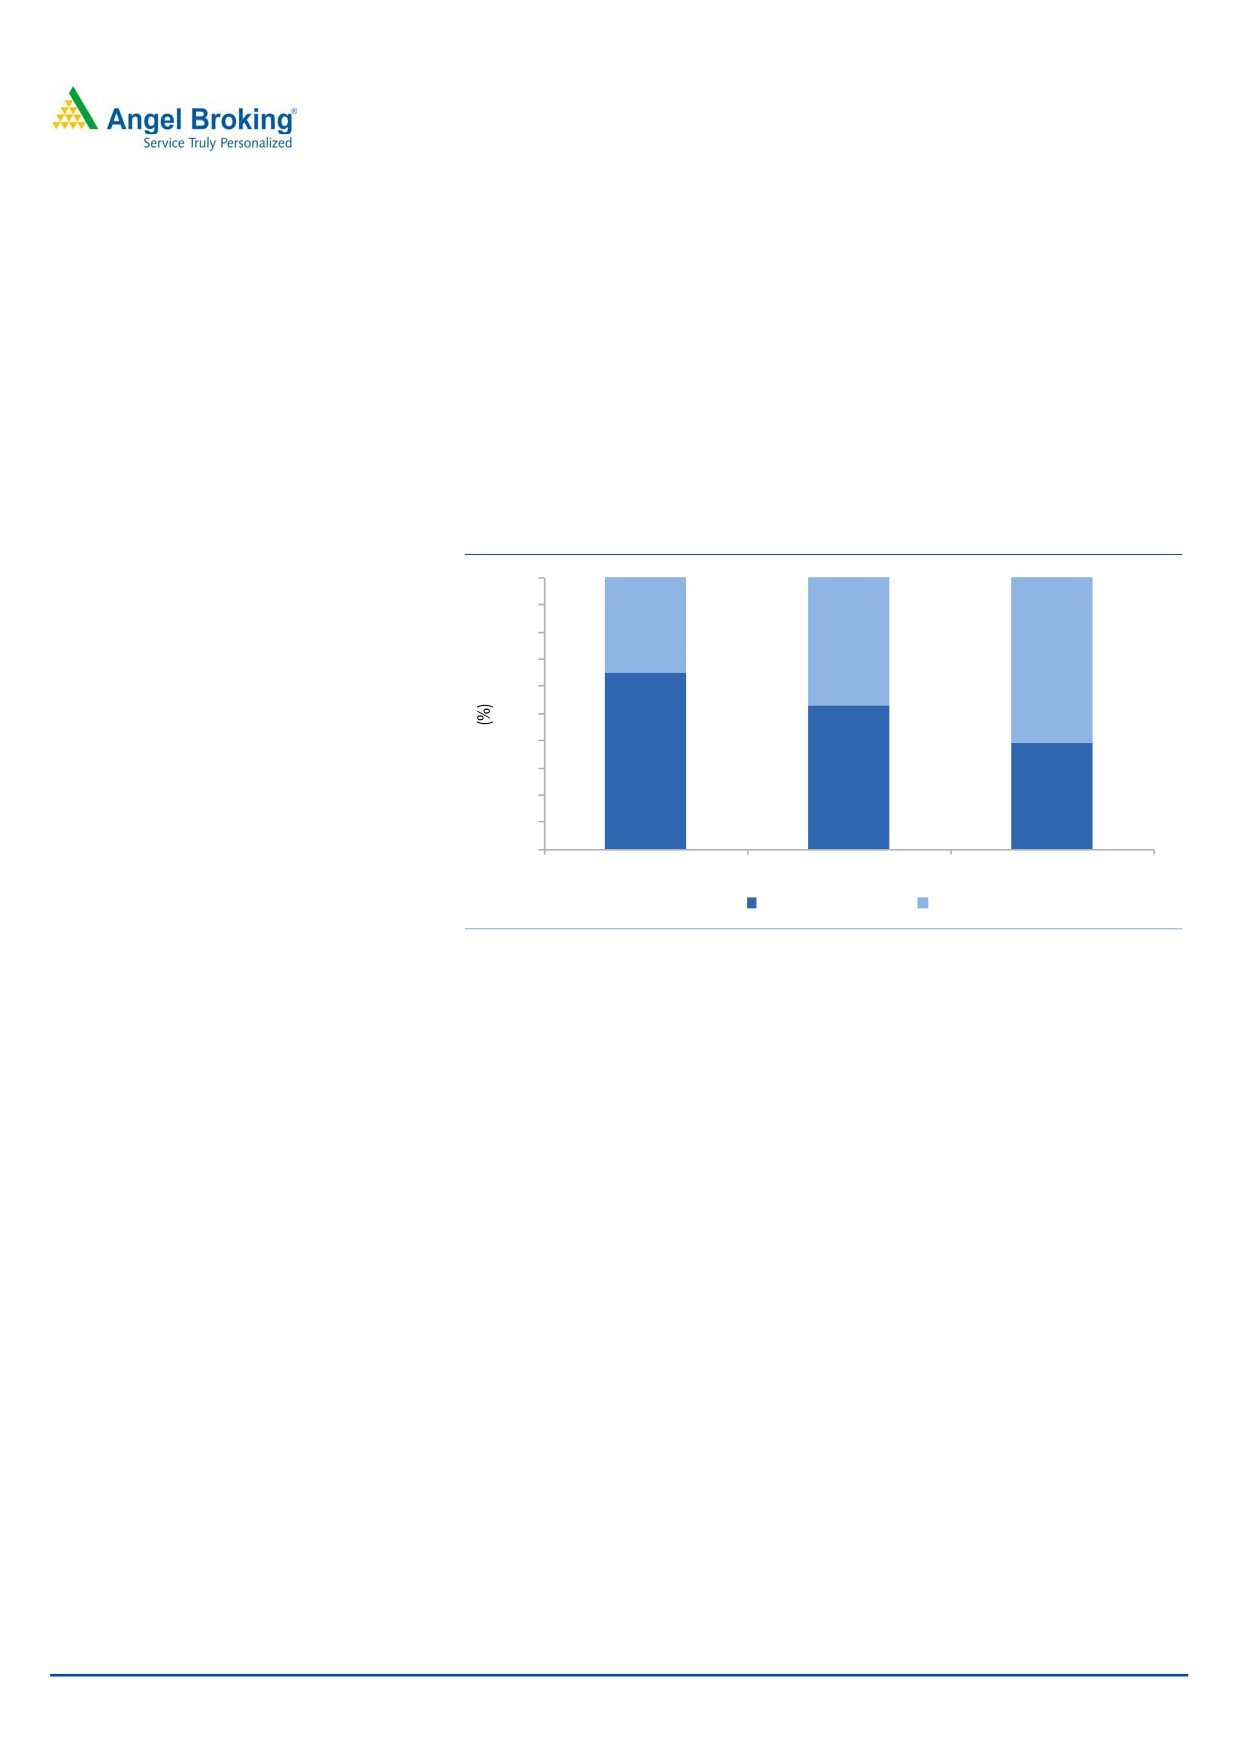
Focus on high value product
Currently, AGIL has lower (35%) vitrified sales as compares to its peers like
Somany Ceramics (47%) and Kajaria Ceramics (61%). AGIL has recently launched
various products in premium segments like Imperio, Jumbo - Double Charge,
CARARRA White, XXL - Polished Glazed Vitrified Tiles, Polished Vitrified Tiles
(Double Charge), etc. Going forward, we expect AGIL’s profit margin would
improve due to their focus on increasing the vitrified product sales, which is a high
margin business.
Exhibit 1: Product mix of its peers
100
90
35
80
47
70
61
60
50
40
65
30
53
20
39
10
0
Asian Granito
Somany Ceramics
Kajaria Ceramics
Ceramic & others
Vitrified
Source: Company, Angel Research
Shift from B2B to B2C would improve the margin
AGIL is continuously putting efforts to increase the B2C sales from current level
(35% in FY16). It is expected to go up to 50% in next 2-3 years on the back of
various initiatives taken by AGIL to increase direct interaction with customers like
strengthening distribution network, opening exclusive brand showroom, trade
schemes on high value products, participation in key trade exhibition, etc.
October 3, 2016
2
Asian Granito | Initiating Coverage
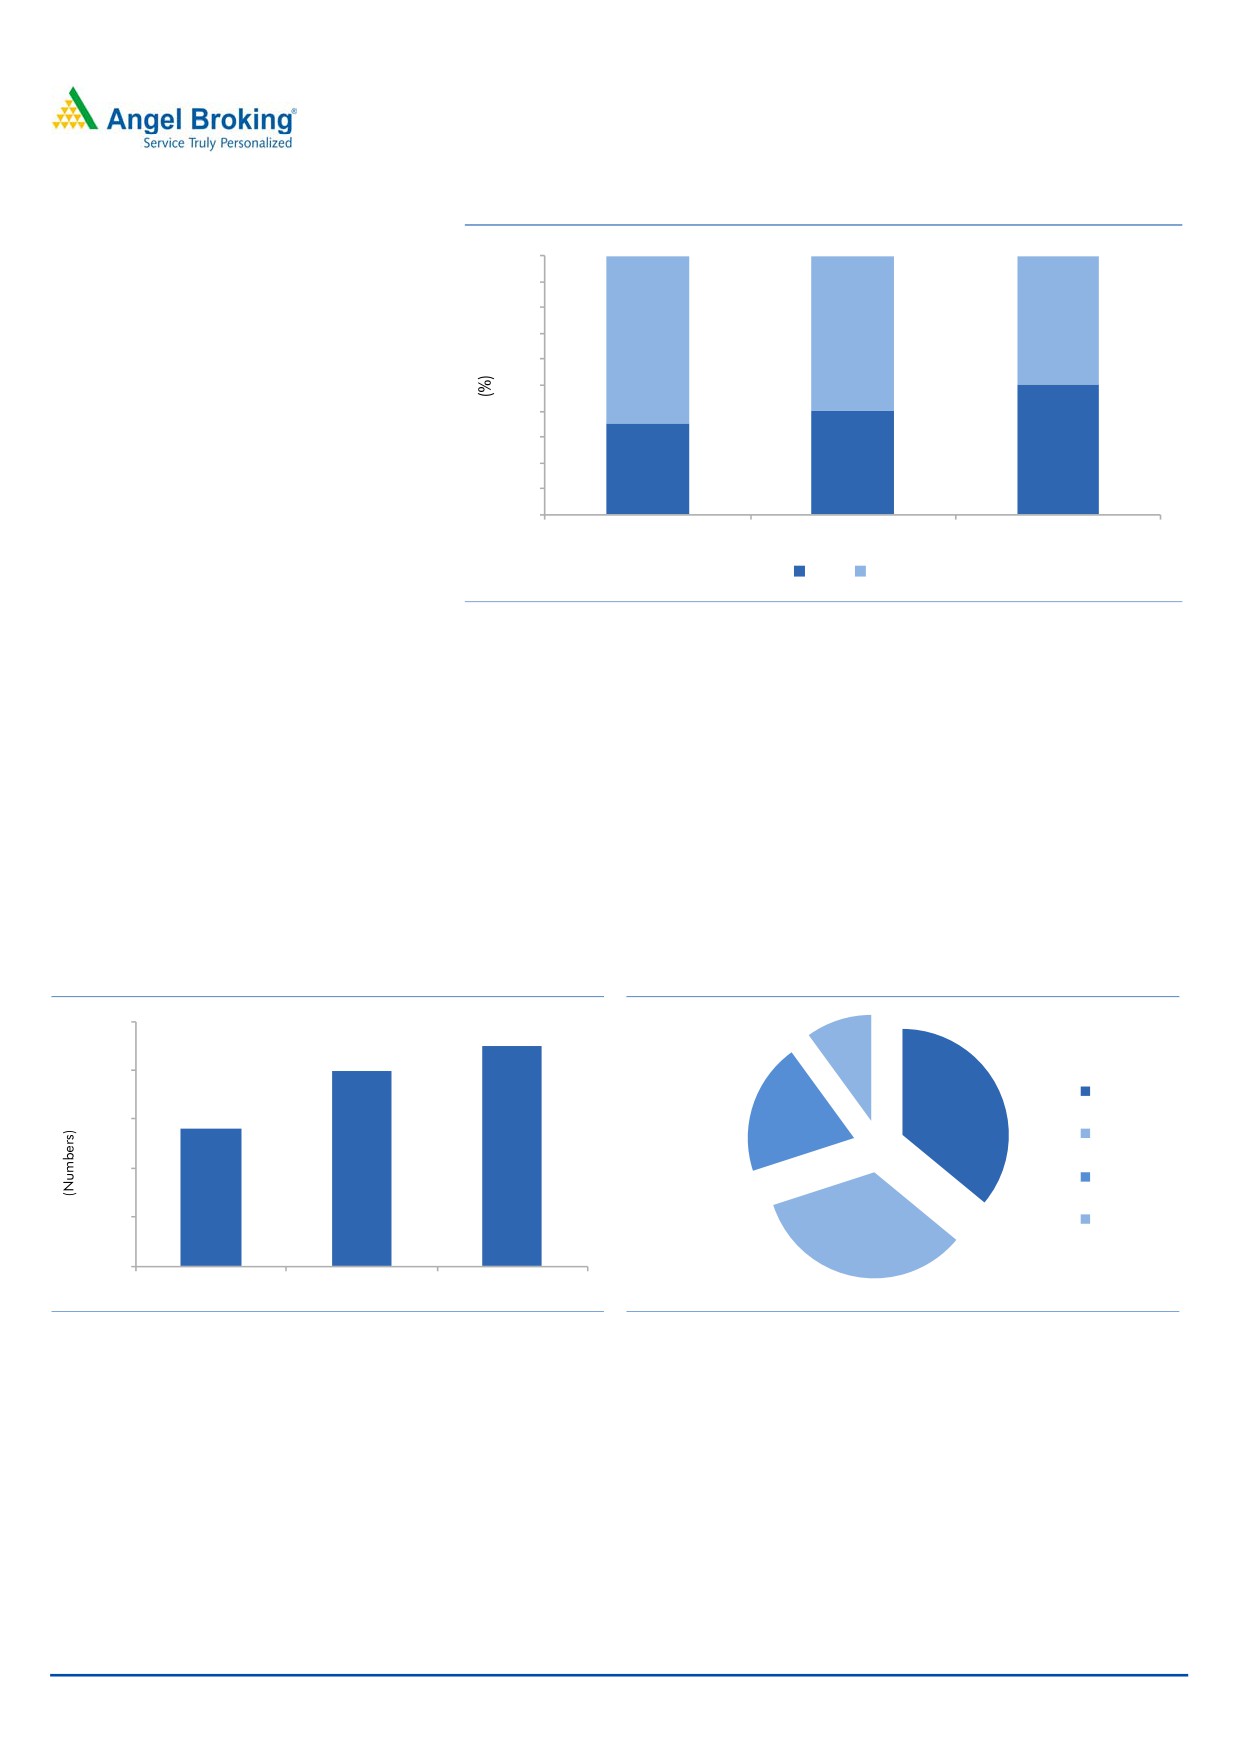
Exhibit 2: B2C business expected to increase
100
90
80
50
70
60
65
60
50
40
30
50
20
40
35
10
0
FY2016
FY2017
Next 2-3 years
B2C B2B
Source: Company, Angel Research
Strengthening Distribution Network
AGIL has an extensive marketing and distribution network. It comprises of more
than 4,500 dealers and sub-dealers (~27 grew over last two years) and more than
80 exclusive dealer showrooms covering each and every state of the country. This
helps the company in promoting its range of products to the consumers and hence
is planning to open 200 more exclusive dealer showrooms. Going forward, we expect
the company to continue to expand its deal network through its dealers &
sub-dealers. Also, the company is opening 16 large format exclusive corporate
display stores for dealers and architects.
Exhibit 3: No. of dealer & sub-dealer
Exhibit 4: Geographical revenue breakup
5000
4500
10%
4000
4000
South
36%
3000
2800
20%
West
2000
North
1000
East
34%
0
FY2014
FY2015
FY2016
Source: Company, Angel Research
Source: Company, Angel Research
October 3, 2016
3
Asian Granito | Initiating Coverage
Artistique Ceramic merger to boost margins
In July FY2016, AGIL acquired Artistique Ceramic which has a comparatively
better margin profile. Going forward, we expect the company would be able to
improve its operating margin from 7.5% in FY16 (excluding merger) to 12-12.5%
in coming financial year. Artisique Ceramics has a contract with RAS GAS to supply
natural gas of 10,000 calorific value at `10 per cubic meter which is lower than
the market rate of 8,000 calorific value at `24 per cubic meter. This would
definitely reduce overall power & fuel cost of the company.
The company is also expecting strong reduction in gas prices in coming quarters.
Further, due to this merger, the company’s capacity has increased from 45,000 sq.
mtrs to 88,000 sq. mtrs per day and the combined capacity has reached to
100,000 sq. mtrs per day (Incl. Outsource).
Consideration: 157 equity shares of face value of Rs.10/- at par each fully paid-up
of Asian Granito Ltd for every 100 equity shares of face value of Rs.10/- each fully
paid-up held in Artistique Ceramics
Exhibit 5: Financial data of AGIL and Artistique
Pre-Merger AGIL (FY16)
Artistique (9MFY16)
Consolidated Post-Merger AGIL
Net Sales
878
116
994
Operating Profit
66
24
90
Margin (%)
7.5%
21.1%
9.1%
PAT
18
7
25
EPS (EPS accretive by 5%)
7.79
8.24
No of share
2.3
3.0
Source: Company, Angel Research
October 3, 2016
4
Asian Granito | Initiating Coverage
Outlook and Valuation
Considering the various initiatives taken by the government like smart cities,
housing for all by 2022, and push towards providing sanitation would create new
demand avenues for entry level or lower priced ceramic tiles. We expect AGIL to
report a net revenue CAGR of ~11% to ~`1,220cr over FY2016-18E. On bottom-
line front, we expect CAGR of ~39% to `48cr over FY2016-18E owing to better
product mix, higher B2C sales and amalgamation synergy. At the current market
price of `277, the stock trades at a PE of 21.3x and 17.3x its FY2017E and
FY2018E EPS of `13 and `16, respectively. We initiate coverage on the stock with
a Buy recommendation and target price of `351, based on 22x FY2018E EPS,
indicating an upside of ~27% from the current levels.
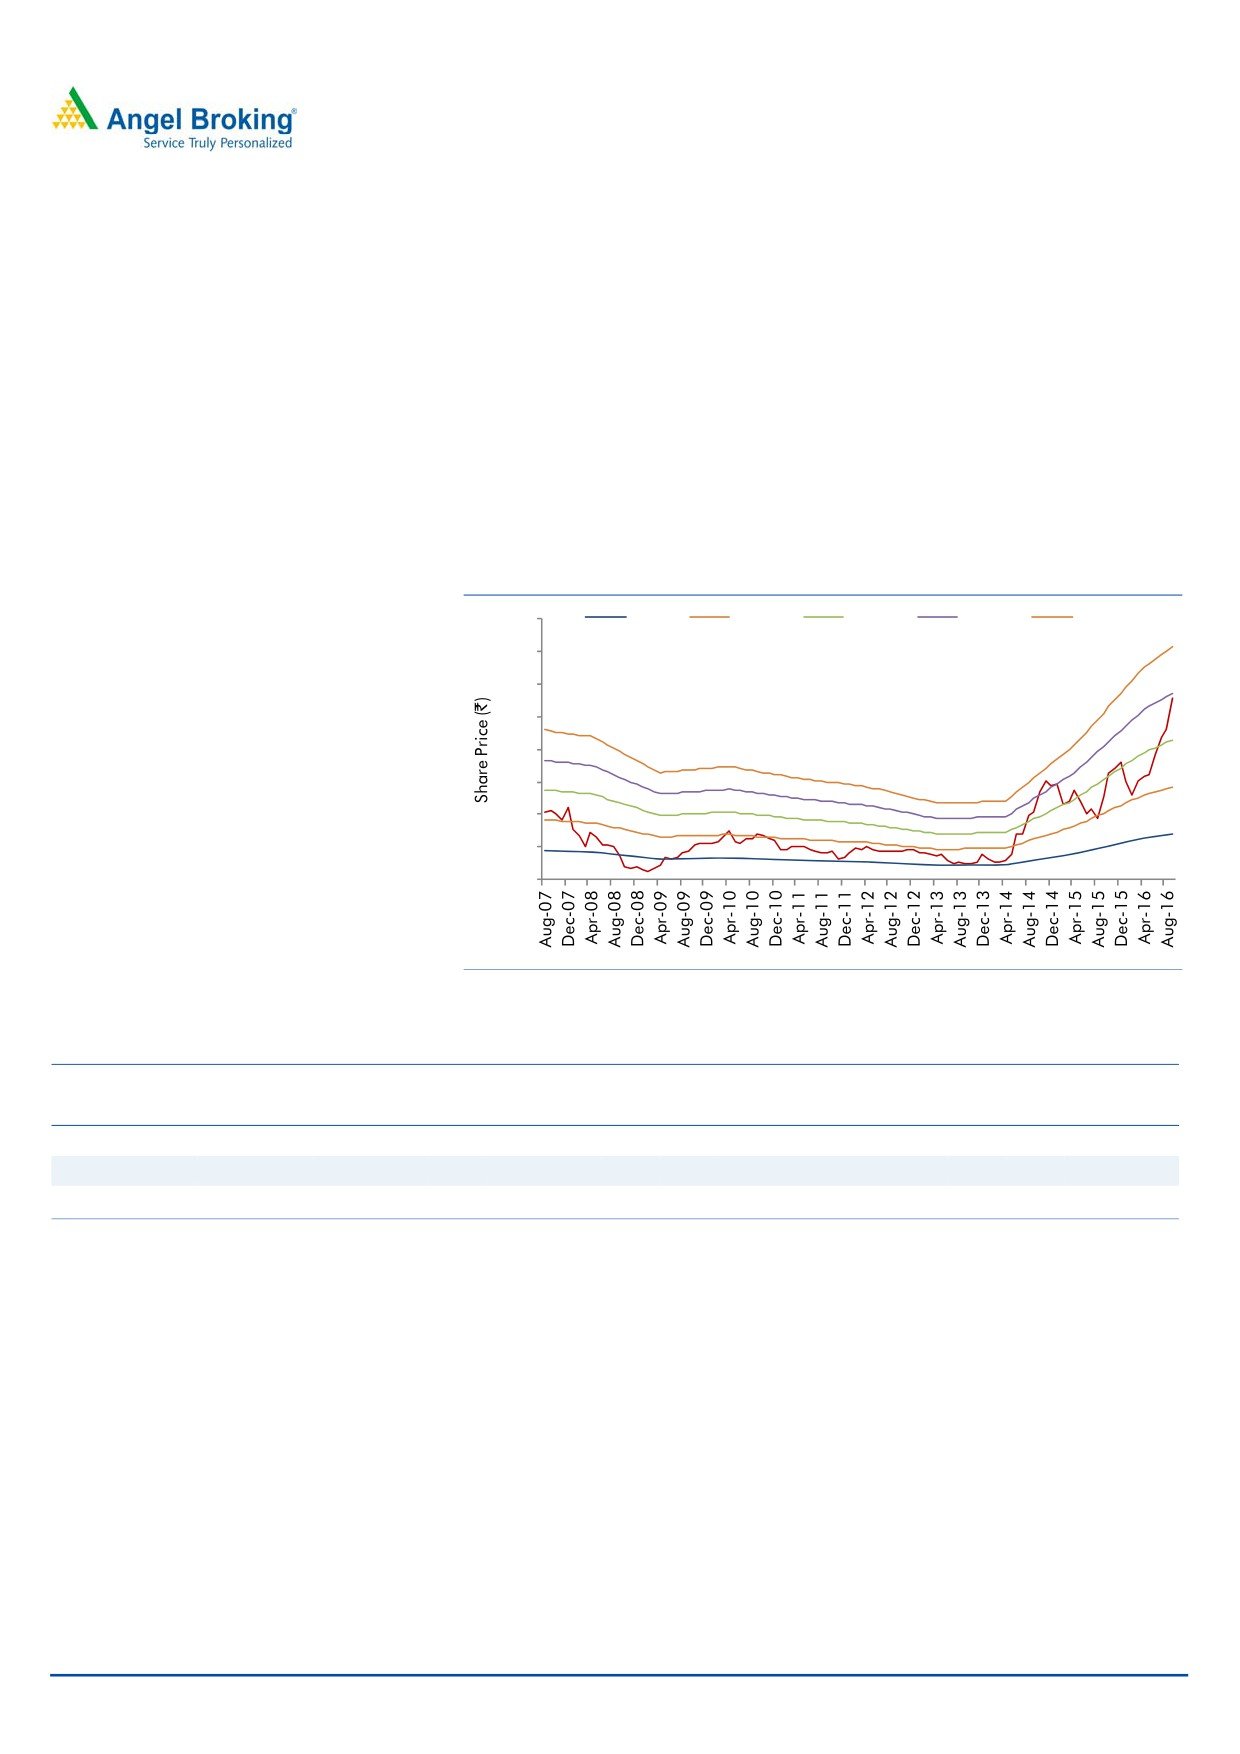
Exhibit 6: One year forward PE Chart
400
5.0 X
10.0 X
15.0 X
20.0 X
25.0 X
350
300
250
200
150
100
50
0
Source: Company, Angel Research
Exhibit 7: Peer Comparison
EPS
PE
EV/EBITDA (x)
EV/Sales (x)
ROE (%)
Market Cap FY16 FY17 FY18 FY16 FY17 FY18 FY16 FY17 FY18 FY16 FY17 FY18 FY16 FY17 FY18
AGIL
836
8.2
13.0
16.0
33.6
21.3
17.3
12.6
8.4
7.4
1.1
1.0
0.9
6.8
9.7
10.7
Kajaria Ceramics
5,839
28.3
37.1
44.8
48.9
37.3
30.9
24.3
20.1
17.3
4.7
4.1
3.5
24.8
25.2
26.1
Somany Ceramics
2,589
16.3
20.0
26.4
37.6
30.5
23.1
19.1
15.5
12.7
1.6
1.4
1.2
15.1
16.2
17.1
Source: Company, Angel Research
The downside risks to our estimates include
1) Lower than expected recovery in real estate industry can impact the overall
performance (~65% revenue comes from B2B business)
2) Increase in gas prices can impact the company’s operating performance
October 3, 2016
5
Asian Granito | Initiating Coverage
Company Background
Asian Granito India (AGIL) is an India-based tiles manufacturing company. The
company is engaged in the manufacture and sale of ceramic wall, ceramic floor,
vitrified tiles, digital polished glazed vitrified tiles, digital wall tiles,marble, and
quartz. The company operates two business segments: tiles and marble and
quartz. The company manufactures tiles in multiple sizes and offers more than
1,200 designs. The company exports its products in 50+ countries like North
America, Europe, Africa, UAE, Australia, East Asia, Middle East, etc. It has eight
manufacturing facilities spread across Gujarat. Currently, the company has
combined capacity of 100,000 Sq. mtrs per day.
Exhibit 8: Product portfolio mix
18%
34%
Ceramic Tiles
13%
Vitrified Tiles
Grestek
Marble & Quartz
35%
Source: Company, Angel Research
Exhibit 9: Product portfolio
Ceramic Tiles
Vitrified Tiles
Grestek
Marble & Quartz
Digital wall tiles
Soluble Salt
Marvel Colour Body Tiles
Multi Colour Marble
Porcellanto wall tiles
Homogenous Body
Slimgress
Nano Crystal Marble
Nano Tech - Double Charge
Hard Stone
Imported Natural Marble
Grandura Exteriors
Hi-Tech Tuff Guard Digital
Onix Marble
Grandura Digital
Grestek - Digital Glazed Vitrified
Imperio - Double Charge
XXL
Jumbo - Double Charge
Source: Company, Angel Research
October 3, 2016
6
Asian Granito | Initiating Coverage
Financial performance
Going forward, we expect the company to report healthy top-line of ~11% CAGR
over next two years on the back of revival in real estate industry, strong addition of
dealer network, and plan to increase up to 200 exclusive dealer showrooms.
Further, the company is planning to increase their ad spend for more brand
visibility. On the operating front, we expect the company’s margin to improve
owing to the merger with Artistique Ceramic, which has comparatively higher
margin (due to lower cost of gas prices). Further, the company is changing their
product mix of value added products and is also expected to increase their retail
business. On the bottom-line front, we expect 39% CAGR on the back of healthy
revenue growth and strong improvement in operating performance.
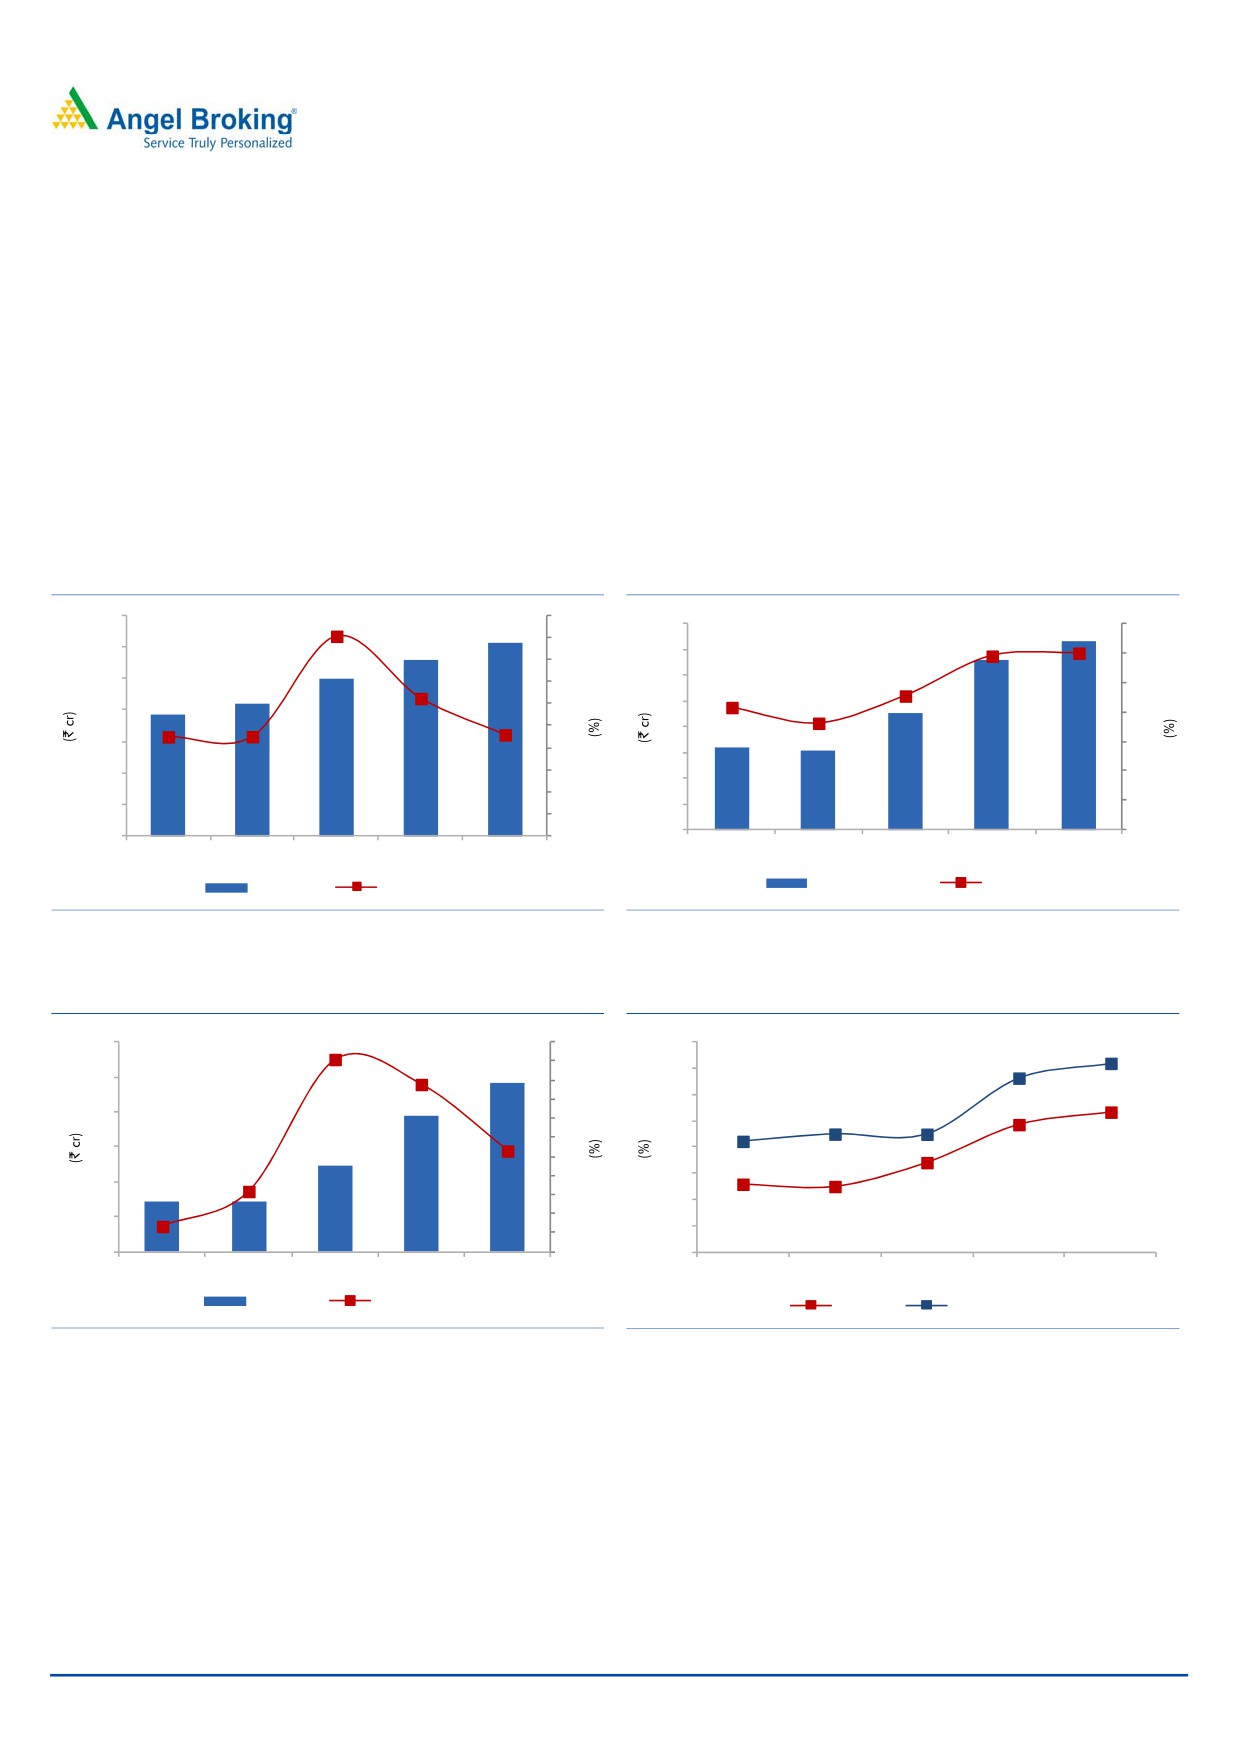
Exhibit 10: Historical net sales trend
Exhibit 11: Historical operating profit trend
1400
20
1220
160
14
11.8
12.0
1118
18
1200
140
12
994
16
120
9.1
1000
14
842
8.3
10
772
100
7.2
12
800
8
10
80
600
6
8
60
400
6
4
40
4
200
20
2
2
64
61
90
132
146
0
0
0
0
FY2014
FY2015
FY2016
FY2017
FY2018
FY2014
FY2015
FY2016
FY2017
FY2018
Net Sales
yoy growth (%)
Operating Profit
Margin (%)
Source: Company, Angel Research
Source: Company, Angel Research
Exhibit 12: Historical net profit trend
Exhibit 13: Historical ROE & ROCE trend
60
71
80
16.0
14.4
58
70
13.3
14.0
50
60
12.0
50
40
9.0
9.0
40
10.0
8.4
23
30
10.7
30
8.0
9.7
20
2
10
6.0
20
6.8
(17)
0
4.0
5.2
5.0
10
(10)
2.0
15
25
39
48
(20)
14
0
(30)
0.0
FY2014
FY2015
FY2016
FY2017
FY2018
FY2014
FY2015
FY2016
FY2017
FY2018
Net Profit
yoy growth (%)
ROE (%)
ROCE (%)
Source: Company, Angel Research
Source: Company, Angel Research
October 3, 2016
7
Asian Granito | Initiating Coverage
Consolidated Profit & Loss Statement
Y/E March (` cr)
FY2014
FY2015
FY2016
FY2017E
FY2018E
Total operating income
772
842
994
1,118
1,220
% chg
9.0
9.0
18.1
12.5
9.2
Total Expenditure
708
781
904
986
1,074
Cost of Materials
480
534
615
687
747
Personnel
37
42
59
69
79
Power, Oil & Fuel
116
131
128
112
122
Others Expenses
74
74
102
117
126
EBITDA
64
61
90
132
146
% chg
(8.2)
(5.1)
48.4
46.1
11.0
(% of Net Sales)
8.3
7.2
9.1
11.8
12.0
Depreciation& Amortisation
22
19
28
37
39
EBIT
43
42
63
95
107
% chg
(11.7)
(1.6)
50.0
51.6
12.7
(% of Net Sales)
5.5
5.0
6.3
8.5
8.8
Interest & other Charges
21
23
29
37
35
Other Income
1
1
1
2
2
(% of PBT)
5.7
4.7
3.9
2.5
2.0
Share in profit of Associates
-
-
-
-
-
Recurring PBT
23
20
35
59
74
% chg
(10.7)
(11.3)
74.2
69.2
24.3
Prior Period & Extr. Expense/(Inc.)
-
-
-
-
-
PBT (reported)
23
20
35
59
74
Tax
8
6
11
20
24
(% of PBT)
37.1
27.9
32.2
33.0
33.0
PAT (reported)
14
15
24
40
49
Add: Share of earnings of asso.
-
-
2
2
2
Less: Minority interest (MI)
-
-
2
3
3
Extraordinary Items
(1)
PAT after MI (reported)
14
15
25
39
48
% chg
14.3
14.5
24.8
39.1
48.0
(% of Net Sales)
1.8
1.7
2.5
3.5
3.9
Basic EPS (`)
4.7
4.8
8.2
13.0
16.0
Fully Diluted EPS (`)
4.7
4.8
8.2
13.0
16.0
% chg
(16.7)
1.7
70.9
57.8
22.9
October 3, 2016
8
Asian Granito | Initiating Coverage
Consolidated Balance Sheet
Y/E March (` cr)
FY2014
FY2015
FY2016
FY2017E FY2018E
SOURCES OF FUNDS
Equity Share Capital
23
23
23
30
30
Reserves& Surplus
253
267
341
372
420
Shareholders Funds
275
290
363
402
450
Minority Interest
-
-
19
19
19
Total Loans
228
175
335
315
295
Deferred Tax Liability
17
18
30
30
30
Total Liabilities
520
483
747
766
794
APPLICATION OF FUNDS
Gross Block
308
338
603
623
643
Less: Acc. Depreciation
131
149
211
248
287
Net Block
178
188
392
375
356
Capital Work-in-Progress
7
15
6
6
6
Investments
13
11
13
13
13
Current Assets
488
438
539
615
681
Inventories
207
191
245
282
311
Sundry Debtors
191
166
197
217
237
Cash
19
15
17
26
35
Loans & Advances
21
21
30
34
37
Other Assets
49
46
50
56
61
Current liabilities
165
168
203
242
261
Net Current Assets
323
270
336
372
419
Deferred Tax Asset
-
-
-
-
-
Mis. Exp. not written off
-
-
-
-
-
Total Assets
520
483
747
766
794
October 3, 2016
9
Asian Granito | Initiating Coverage
Consolidated Cashflow Statement
Y/E March (` cr)
FY2014
FY2015
FY2016
FY2017E FY2018E
Profit before tax
22
19
35
59
74
Depreciation
22
19
28
37
39
Change in Working Capital
6
49
(64)
(27)
(39)
Interest / Dividend (Net)
21
23
29
37
35
Direct taxes paid
(8)
(6)
(5)
(20)
(24)
Others
(0)
0
(1)
(1)
(1)
Cash Flow from Operations
62
104
21
86
84
(Inc.)/ Dec. in Fixed Assets
(23)
(30)
(224)
(20)
(20)
(Inc.)/ Dec. in Investments
5
2
(3)
-
-
Cash Flow from Investing
(29)
(33)
(221)
(20)
(20)
Issue of Equity
4
-
8
-
-
Inc./(Dec.) in loans
(24)
(53)
160
(20)
(20)
Dividend Paid (Incl. Tax)
-
-
-
-
-
Interest / Dividend (Net)
(24)
(23)
36
(37)
(35)
Cash Flow from Financing
(43)
(76)
203
(57)
(55)
Inc./(Dec.) in Cash
(10)
(4)
3
9
9
Opening Cash balances
29
19
15
17
26
Closing Cash balances
19
15
17
26
35
October 3, 2016
10
Asian Granito | Initiating Coverage
Key ratios
Y/E March
FY2014
FY2015
FY2016
FY2017E FY2018E
Valuation Ratio (x)
P/E (on FDEPS)
58.4
57.5
33.6
21.3
17.3
P/CEPS
23.2
24.8
16.2
10.9
9.4
P/BV
3.0
2.9
2.3
2.1
1.9
Dividend yield (%)
0.0
0.0
0.0
0.0
0.0
EV/Sales
1.3
1.2
1.1
1.0
0.9
EV/EBITDA
16.1
16.2
12.6
8.4
7.4
EV / Total Assets
1.5
1.5
1.2
1.1
1.0
Per Share Data (`)
EPS (Basic)
4.7
4.8
8.2
13.0
16.0
EPS (fully diluted)
4.7
4.8
8.2
13.0
16.0
Cash EPS
11.9
11.1
17.0
25.4
29.4
DPS
0.0
0.0
0.0
0.0
0.0
Book Value
91.5
96.3
120.7
133.7
149.7
Returns (%)
ROCE
8.4
9.0
9.0
13.3
14.4
Angel ROIC (Pre-tax)
9.0
9.5
9.4
14.0
15.4
ROE
5.2
5.0
6.8
9.7
10.7
Turnover ratios (x)
Asset Turnover (Gross Block)
2.5
2.5
1.6
1.8
1.9
Inventory / Sales (days)
98
83
90
92
93
Receivables (days)
90
72
72
71
71
Payables (days)
68
61
57
56
55
WC cycle (ex-cash) (days)
121
94
105
107
109
October 3, 2016
11
Asian Granito | Initiating Coverage
Research Team Tel: 022 - 39357800
DISCLAIMER
Angel Broking Private Limited (hereinafter referred to as “Angel”) is a registered Member of National Stock Exchange of India Limited,
Bombay Stock Exchange Limited and Metropolitan Stock Exchange Limited. It is also registered as a Depository Participant with CDSL
and Portfolio Manager with SEBI. It also has registration with AMFI as a Mutual Fund Distributor. Angel Broking Private Limited is a
registered entity with SEBI for Research Analyst in terms of SEBI (Research Analyst) Regulations, 2014 vide registration number
INH000000164. Angel or its associates has not been debarred/ suspended by SEBI or any other regulatory authority for accessing
/dealing in securities Market. Angel or its associates/analyst has not received any compensation / managed or co-managed public
offering of securities of the company covered by Analyst during the past twelve months.
This document is solely for the personal information of the recipient, and must not be singularly used as the basis of any investment
decision. Nothing in this document should be construed as investment or financial advice. Each recipient of this document should
make such investigations as they deem necessary to arrive at an independent evaluation of an investment in the securities of the
companies referred to in this document (including the merits and risks involved), and should consult their own advisors to determine
the merits and risks of such an investment.
Reports based on technical and derivative analysis center on studying charts of a stock's price movement, outstanding positions and
trading volume, as opposed to focusing on a company's fundamentals and, as such, may not match with a report on a company's
fundamentals. Investors are advised to refer the Fundamental and Technical Research Reports available on our website to evaluate the
contrary view, if any.
The information in this document has been printed on the basis of publicly available information, internal data and other reliable
sources believed to be true, but we do not represent that it is accurate or complete and it should not be relied on as such, as this
document is for general guidance only. Angel Broking Pvt. Limited or any of its affiliates/ group companies shall not be in any way
responsible for any loss or damage that may arise to any person from any inadvertent error in the information contained in this report.
Angel Broking Pvt. Limited has not independently verified all the information contained within this document. Accordingly, we cannot
testify, nor make any representation or warranty, express or implied, to the accuracy, contents or data contained within this document.
While Angel Broking Pvt. Limited endeavors to update on a reasonable basis the information discussed in this material, there may be
regulatory, compliance, or other reasons that prevent us from doing so.
This document is being supplied to you solely for your information, and its contents, information or data may not be reproduced,
redistributed or passed on, directly or indirectly.
Neither Angel Broking Pvt. Limited, nor its directors, employees or affiliates shall be liable for any loss or damage that may arise from
or in connection with the use of this information.
Disclosure of Interest Statement
Asian Granito
1. Financial interest of research analyst or Angel or his Associate or his relative
No
2. Ownership of 1% or more of the stock by research analyst or Angel or associates or relatives
No
3. Served as an officer, director or employee of the company covered under Research
No
4. Broking relationship with company covered under Research
No
Ratings (Based on expected returns
Buy (> 15%)
Accumulate (5% to 15%)
Neutral (-5 to 5%)
over 12 months investment period):
Reduce (-5% to -15%)
Sell (< -15)
October 3, 2016
12