3QFY2017 Result Update | Automobile
February 13, 2017
Ashok Leyland
BUY
CMP
`93
Performance Highlights
Target Price
`111
Quarterly highlights (Standalone)
Investment Period
12 Months
Y/E March (` cr)
3QFY17 3QFY16
% chg (yoy) 2QFY17
% chg (qoq)
Net Sales
4,431
4,114
7.7
4,622
(4.1)
Stock Info
EBITDA
454
444
2.3
536
0.0
Sector
Automobile
EBITDA margin (%)
10
11
(55 bps)
12
(136 bps)
Market Cap (` cr)
26,452
Adj. PAT
250
217
14.8
294
196.0
Net Debt (` cr)
(1,211)
Source: Company, Angel Research
Beta
1.2
Overall good results during tough times: Ashok Leyland reported 7.7% growth in
52 Week High / Low
113/74
top line and 14.8% growth in the bottom line. Net realization grew by 1.3% yoy to
Avg. Daily Volume
1,330,069
`13.20 lakh per vehicle. Operating profit grew by 2.2% to `454cr in Q3FY17;
Face Value (`)
1.0
EBITDA margins declined by 55bps yoy to 10.25% vs. 10.80% in Q3FY16. The
BSE Sensex
28,334
decline in EBITDA margins was due to higher discounts and increase in raw
Nifty
8,794
material prices. Reported PAT declined by 13% yoy to `185.9cr due to loss of
Reuters Code
ASOK.BO
`67.3cr on swap contracts. Adjusted PAT grew by 14.8% yoy to 249.6cr. The
Bloomberg Code
AL@IN
company during the quarter saw 6% yoy growth in its total volumes to 32,838.
This came despite industry witnessed negative impact of demonetisation. The
MHCV volumes grew by 9% while LCV volumes declined by 2%.
Shareholding Pattern (%)
Promoters
50.4
Outlook and valuation While demonetisation has negatively impacted the
automobile industry, we are expecting faster recovery in the volumes with
MF / Banks / Indian Fls
8.9
improving liquidity. The quantum of recovery cannot be assessed at this time. We
FII / NRIs / OCBs
28.7
forecast ALL’s volume growth of 8% and 9% in FY18E and FY19E. Company has
Indian Public / Others
12.0
taken a 4% price hike in January hence we believe that margins are likely to see
minor expansion going ahead. We forecast average 21% ROE for FY18E and
Abs. (%)
3m 1yr 3yr
FY19E showing significant improvement from its ROE profile in FY16. The
Sensex
5.6
23.4
39.1
improving consumer sentiment and government’s initiative to boost the
Ashok Leyland
9.0
17.4
506.7
infrastructure would play out positively for Ashok Leyland. Overall we expect 10%
and 13% CAGR in revenue and net profit over next two years. We value the stock at
19x of FY2019E EPS `5.8 and maintain buy rating with price target of `111.
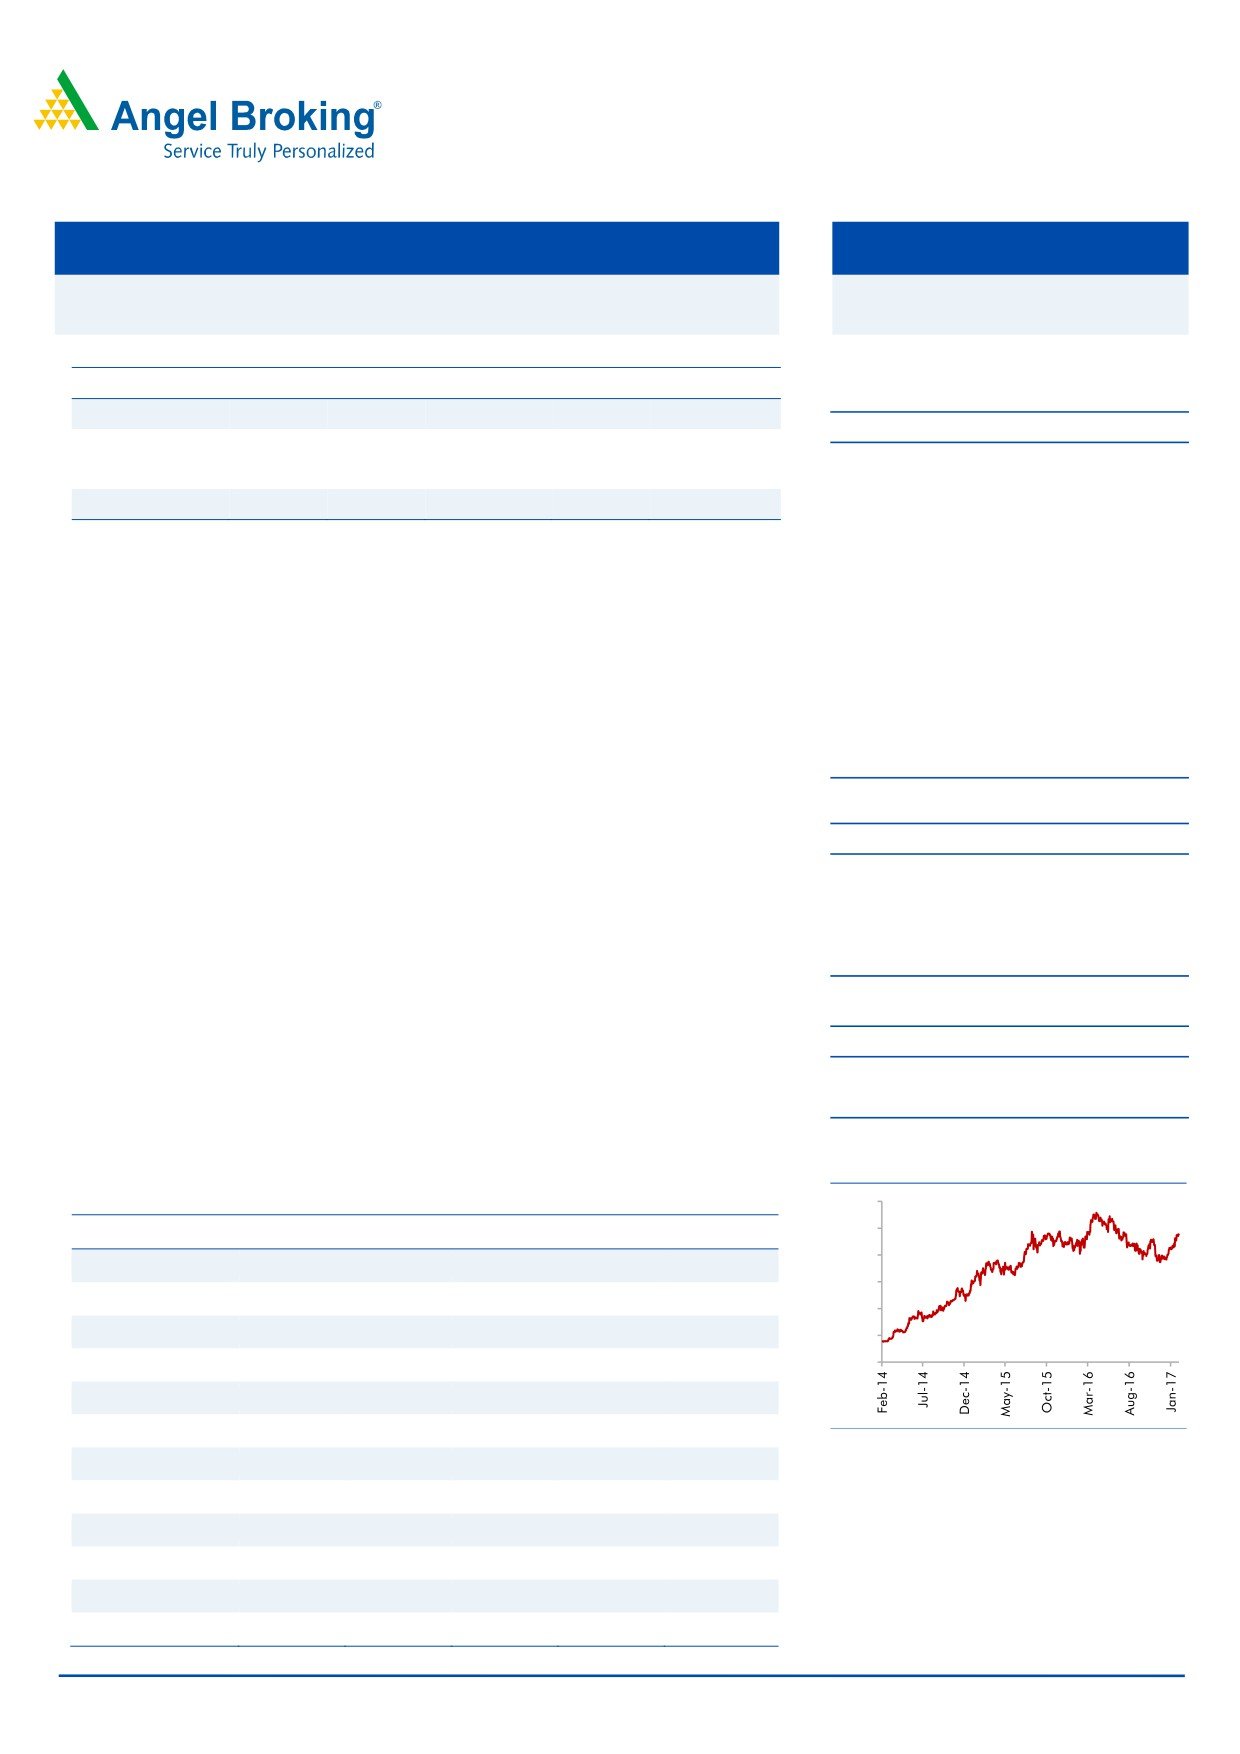
3 year price chart
Key financials (Standalone)
120.0
100.0
Y/E March (` cr)
FY2015
FY2016
2017E
2018E
2019E
80.0
Net Sales
13,562
18,822
20,021
21,915
24,076
60.0
% chg
36.4
38.8
6.4
9.5
9.9
40.0
Adjusted net profit
234
1,111
1,294
1,514
1,655
20.0
0.0
% chg
-
375.1
16.4
17.0
9.3
EBITDA (%)
7.7
11.6
11.6
11.9
11.6
EPS (`)
1.2
2.5
4.5
5.3
5.8
Source: Company, Angel Research
P/E (x)
79.0
36.6
20.4
17.5
16.0
P/BV (x)
5.2
4.8
4.2
3.8
3.4
RoE (%)
6.5
13.1
20.6
21.5
21.0
RoCE (%)
7.2
21.1
20.2
21.2
21.7
Shrikant Akolkar
EV/Sales (x)
1.9
1.4
1.3
1.1
1.0
022-3935 7800 Ext: 6846
EV/EBITDA (x)
25.7
11.8
11.1
9.6
8.7
Source: Company, Angel Research; Note: CMP as of February 10, 2017
Please refer to important disclosures at the end of this report
1
Ashok Leyland | 3QFY2017 Result Update
Exhibit 1: Quarterly financial performance (Standalone)
Y/E March (` cr)
3QFY17
3QFY16
% chg (yoy)
2QFY17
% chg (qoq)
9MFY17
9MFY17
% chg (yoy)
Net Sales
4,431
4,114
7.7
4,622
(4.1)
13,312
12,964
2.7
Consumption of RM
3,134
2,875
9.0
3,134
0.0
9,198
8,994
2.3
(% of sales)
70.7
69.9
67.8
69.1
69.4
Staff costs
362
347
4.1
369
(2.1)
1,089
1,053
3.5
(% of sales)
8.2
8.4
8.0
8.2
8.1
Purchase of traded goods
481
447
7.8
583
(17.4)
1,558
1,614
(3.4)
(% of sales)
10.9
10.9
12.6
11.7
12.4
Total Expenditure
3,977
3,670
8.4
4,086
(2.7)
11,845
11,660
1.6
Operating Profit
454
444
2.3
536
(15.3)
1,467
1,304
12.5
OPM (%)
10.3
10.8
11.6
11.0
10.1
Interest
31
60
(48.4)
34
(8.2)
99
193
(48.9)
Depreciation
119
119
(0.1)
126
(5.4)
366
356
2.8
Other income
(40)
28
(243.1)
38
(205.3)
92
73
25.3
PBT (excl. Extr. Items)
264
293
415
1,094
827
Extr. income/expense
0
0
0
0
0
PBT (incl. Extr. Items)
264
293
(9.9)
415
(36.4)
1,094
827
32.2
(% of sales)
6.0
7.1
9.0
8.2
6.4
Provision for taxation
78
79
120
323
297
(% of PBT)
29.5
27.0
29.0
29.5
35.9
Reported PAT
186
214
(13.0)
294
(36.9)
771
530
45.4
Adj PAT
250
217
14.8
294
835
619
Adj. PATM
5.6
5.3
6.4
6.3
4.8
Equity capital (cr)
285
285
285
285
285
Adjusted EPS (`)
0.9
0.8
1.0
2.9
2.2
Source: Company, Angel Research
Exhibit 2: Quarterly volume performance
(units)
3QFY17
3QFY16
% chg (yoy)
2QFY17
% chg (qoq)
9MFY17
9MFY17
% chg (yoy)
MHCV passenger
25,284
23,176
9.1
25,341
(0.2)
74,652
74,513
0.2
MHCV goods
7,554
7,752
(2.6)
8,100
(6.7)
22,792
21,950
3.8
Total volume (ex. Dost)
32,838
30,928
6.2
33,441
(1.8)
97,444
96,463
1.0
Source: Company, Angel Research
February 13, 2017
2
Ashok Leyland | 3QFY2017 Result Update
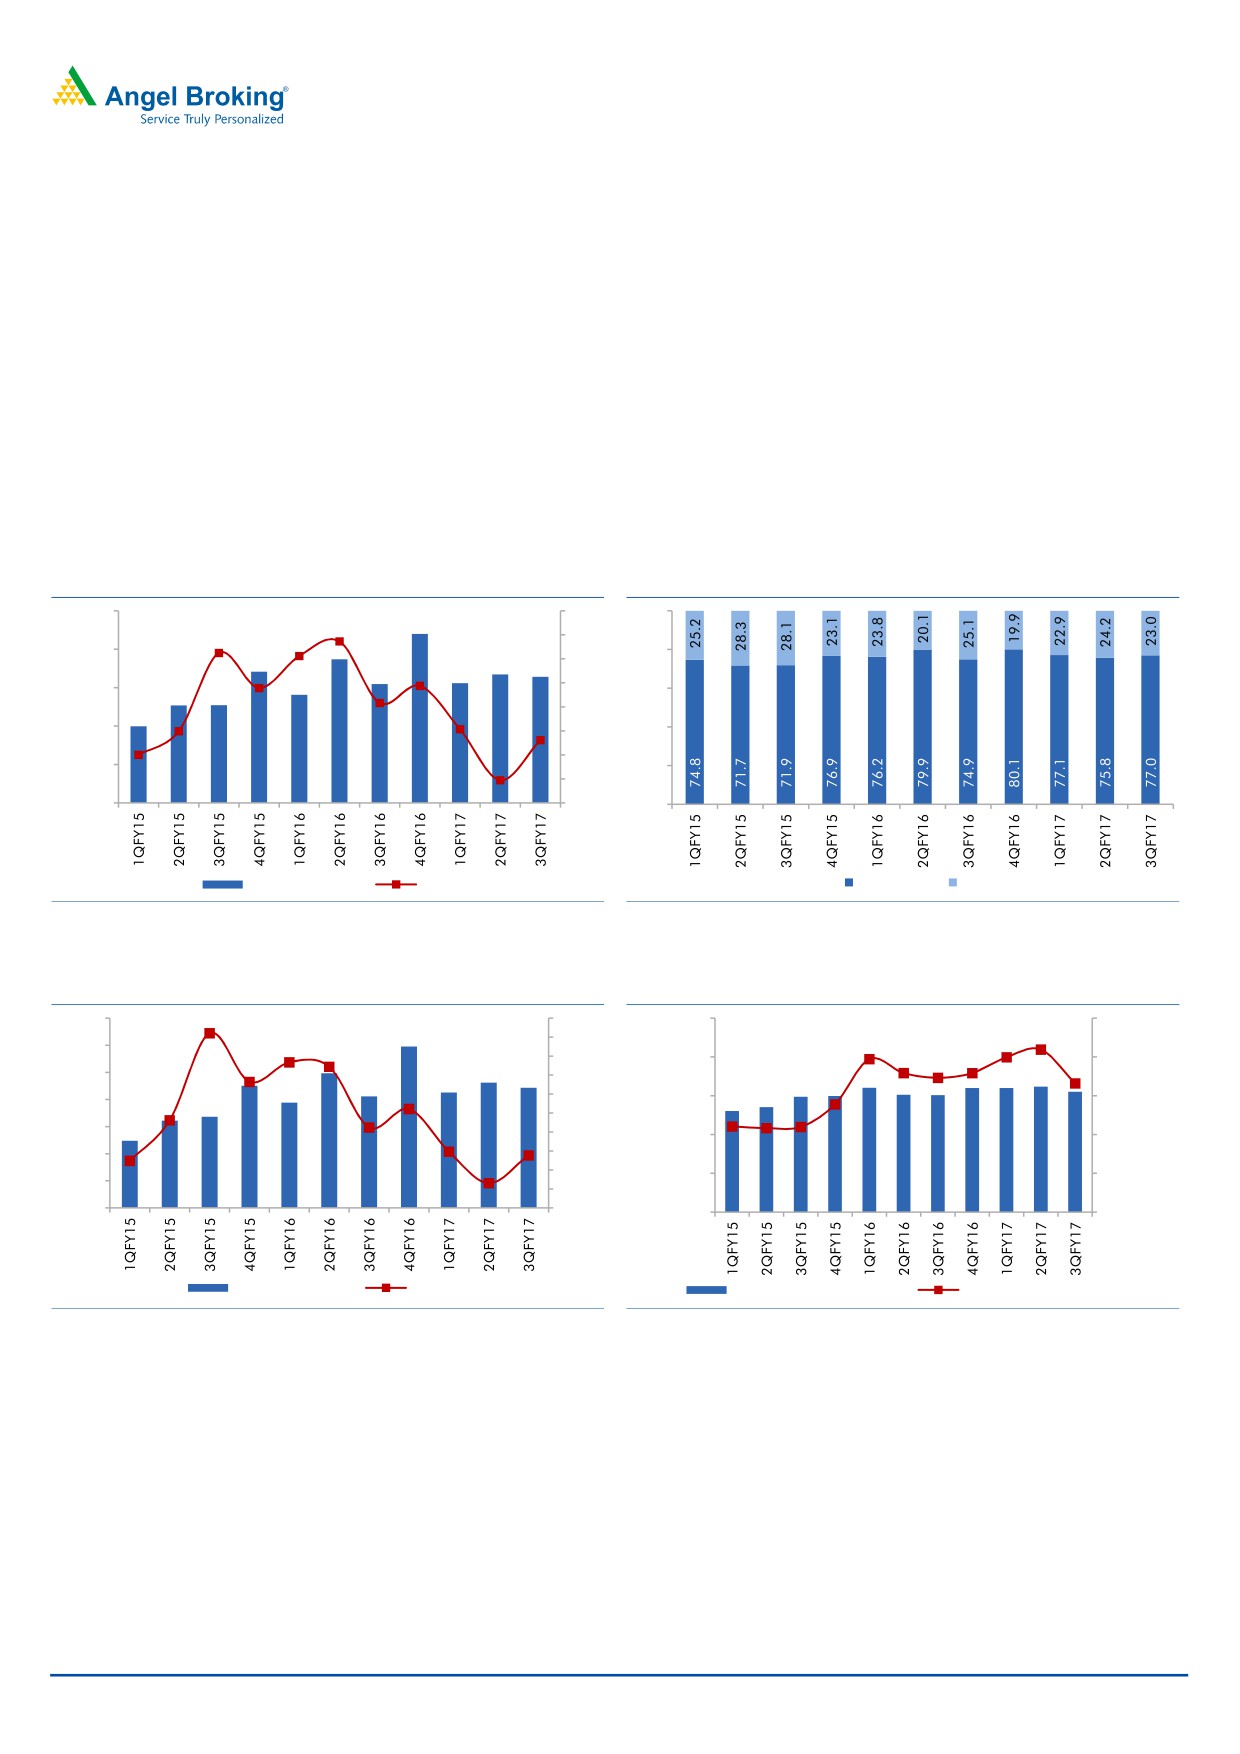
ALLs MHCV volumes grew by
9% yoy during the quarter showing
demonetisation has not led to a negative impact on its MHCV business. The
industry, during this period grew by 3%.
Realization/vehicle declined by
1.3% yoy to
`13.20 lakh, as company
increased discounts from `2.5 lakh per vehicle to ~`3.3 lakh per vehicle.
RM cost per vehicle increased by 2.6% yoy to ` 9.54 lakh. This was due to
increase in the raw material costs.
ALL has continued to increase its market share on the back of higher
proportion of the fast growing heavy trucks and geographical expansion. ALL’s
market share improved from 30.1% in Q3FY16 to 33.7% in Q3FY17.
Exhibit 3: Volume grew despite demonetisation
Exhibit 4: MHCVs share in product mix rises yoy
50,000
60
100
50
40,000
80
40
30,000
30
60
20
20,000
40
10
0
10,000
20
(10)
0
(20)
0
Overall Volumes
yoy chg %
MHCV (%)
LCV (%)
Source: Company, Angel Research
Source: Company, Angel Research
Exhibit 5: Net sales growth at 7.7%
Exhibit 6: Realisation & contribution trend
7,000
80.0
17,00,000
4,50,000
70.0
6,000
60.0
15,00,000
4,00,000
5,000
50.0
4,000
40.0
13,00,000
3,50,000
30.0
3,000
20.0
11,00,000
3,00,000
2,000
10.0
0.0
9,00,000
2,50,000
1,000
-10.0
0
-20.0
7,00,000
2,00,000
Net sales (` cr)
Growth %
Realisation/vehicle (`)
Contribution/vehicle (`)
Source: SIAM, Angel Research
Source: SIAM, Angel Research
Company has indicated of greater focus on exports, LCV and aftermarket
business going ahead.
February 13, 2017
3
Ashok Leyland | 3QFY2017 Result Update
Exhibit 7: EBITDA margin declines due to higher costs
Exhibit 8: Bottom-line continues to improve yoy
600.0
14
350.0
8
12
300.0
500.0
6
10
250.0
400.0
8
200.0
4
300.0
150.0
6
2
200.0
100.0
4
100.0
50.0
0
2
0.0
0.0
0
(2)
(50.0)
(100.0)
(4)
EBIDTA (` cr)
Margin %
Net Profit (` cr)
Margin %
Source: Company, Angel Research
Source: Company, Angel Research
Conference call - Key highlights
Company reported 9% yoy growth in its MH&CV (bus + truck) volumes
whereas LCV volumes saw 2.5% yoy decline
During the quarter, exports revenue was at `388cr and company expects
export revenue contribution to be ~25% of sales in next 4-5 years.
FY17E Capex at `500cr
Company’s market share increased from 30.1% in Q3FY16 to 33.7% in
Q3FY17
During the quarter company reported higher discounts of ~ `3.30 lakh.
Due to higher RM prices, company reported decline in the operating margins.
While in Q3, company was not able to pass on the prices, it has increased
prices by ~4% in January.
Company has indicated of higher LCV sales going ahead and expects to
increase its aftermarket share from 10% to 15%.
Investment arguments
Volumes recovery in FY18E: ALL continues to report a good set of volumes. The
Implementation of BSIV standards is also expected to be positive for the stock and
company expects pre-buying in next few months. This implies that the volumes are
expected to recover faster, shrugging off the demonetisation impact. We remain
positive on its volume growth. Company has also indicated to increase its LCV
market share to ~30% with new product launches in coming years.
Pure CV play: ALL is a pure CV play and is expected to benefit from government’s
push to improve infrastructure. The MHCV segment, accounts for 3/4th of ALLs total
volumes and has grown at a 3 year CAGR of 11% by FY16. We expect the
momentum to continue, in FY18E and FY19E as economic outlook improves.
Return ratio to improve: ALL has taken 4% price hike in January and we expect
further price hikes as company anticipates volume growth on the back of
February 13, 2017
4
Ashok Leyland | 3QFY2017 Result Update
implementation of new emission standards. We expect ALL’s margins to remain at
the current levels for new two years (11.6%). This level of margins is significantly
higher than the margins seen during FY12-FY15 when automobile industry was
going through a period of slower growth. Owing to this, company is expected to
see improvement in RoE profile. We expect ALL’s average RoE to remain at
~21.2% over next two years indicating strong improvement in return ratios.
Outlook and valuation
While demonetisation has negatively impacted the automobile industry, we are
expecting faster recovery in the volumes with improving liquidity. The quantum of
recovery cannot be assessed at this time. We forecast ALL’s volume growth of 8%
and 9% in FY18E and FY19E. Company has taken a 4% price hike in January
hence we believe that margins are likely to see minor expansion going ahead. We
forecast average 21% ROE for FY18E and FY19E showing significant improvement
from its ROE profile in FY16. The improving consumer sentiment and
government’s initiative to boost the infrastructure would play out positively for
Ashok Leyland. Overall we expect 10% and 13% CAGR in revenue and net profit
over next two years. We value the stock at 19x of FY2019E EPS `5.8 and maintain buy
rating with PT of `111 (11x FY2019E EV/EBITDA multiple).
Exhibit 9: Key assumptions
(units)
FY2013
FY2014
FY2015
FY2016E
FY2017E
FY2018E
MH&CV
79,694
60,342
77,660
109,762
112,674
122,821
LCV
34,917
28,995
27,242
30,695
31,980
33,904
Total volume (units)
114,611
89,337
104,902
140,457
144,654
156,725
% yoy chg
12.4
(22.1)
17.4
33.9
3.0
8.3
Source: Company, Angel Research
Company background
Ashok Leyland Ltd (ALL) is the country's second largest CV manufacturer. The
company has a strong presence in the MHCV segment, with a domestic market
share of ~34% as of Q3FY2017. ALL enjoys a dominant position in southern
India, and has been focusing on expanding its presence in northern and western
India by increasing its touch points in the region. The company intends to increase
its market share in trucks by launching new products under Guru and Partner
range.
February 13, 2017
5
Ashok Leyland | 3QFY2017 Result Update
Profit and loss statement (Standalone)
Y/E March (` cr)
FY2015
FY2016
2017E
2018E
2019E
Total operating income
13,562
18,822
20,021
21,915
24,076
% chg
36.4
38.8
6.4
9.5
9.9
Total Expenditure
12,536
16,656
17,748
19,352
21,333
Cost of Materials
9,965
13,262
13,692
14,977
16,528
Personnel
1,184
1,399
1,626
1,759
1,933
Others Expenses
1,386
1,995
2,430
2,615
2,872
EBITDA
1,027
2,166
2,273
2,564
2,743
% chg
778.3
111.0
4.9
12.8
7.0
(% of Net Sales)
7.7
11.6
11.6
11.9
11.6
Depreciation& Amortisation
416
444
459
486
486
EBIT
610
1,722
1,814
2,078
2,257
% chg
(334.6)
182.2
5.3
14.5
8.6
(% of Net Sales)
4.6
9.3
9.3
9.7
9.6
Interest & other Charges
394
274
133
134
134
Other Income
124
110
159
219
241
(% of PBT)
36.5
7.0
8.6
10.1
10.2
Share in profit of Ass.
-
-
-
-
-
Recurring PBT
341
1,559
1,840
2,163
2,364
% chg
(157.2)
356.7
18.1
17.5
9.3
Prior Period & Extra. Exp.
(101)
389
-
-
-
PBT (reported)
442
1,169
1,840
2,163
2,364
Tax
107
447
547
649
709
(% of PBT)
24.3
38.3
29.7
30.0
30.0
PAT (reported)
335
722
1,294
1,514
1,655
Add: Share of earnings of ass.
-
-
-
-
-
Less: Minority interest (MI)
-
-
-
-
-
PAT after MI (reported)
335
722
1,294
1,514
1,655
ADJ. PAT
234
1,111
1,294
1,514
1,655
% chg
(149.1)
375.1
16.4
17.0
9.3
(% of Net Sales)
1.7
5.9
6.5
6.9
6.9
Basic EPS (`)
1.2
2.5
4.5
5.3
5.8
Fully Diluted EPS (`
1.2
2.5
4.5
5.3
5.8
% chg
-
375.1
16.4
17.0
9.3
February 13, 2017
6
Ashok Leyland | 3QFY2017 Result Update
Balance sheet statement (Standalone)
Y/E March (` cr)
FY2014
FY2015
FY2016
2017E
2018E
2019E
SOURCES OF FUNDS
Equity share capital
266
285
285
285
285
285
Reserves & surplus
4,182
4,834
5,230
6,006
6,763
7,590
Shareholders’ Funds
4,448
5,119
5,514
6,290
7,048
7,875
Total loans
Deferred tax liability
4,690
3,350
2,659
2,709
2,759
2,509
Other long term liabilities
70
99
142
137
151
165
Long term provisions
624
611
589
589
589
589
Total Liabilities
9,833
9,178
8,903
9,725
10,546
11,138
APPLICATION OF FUNDS
Gross block
8,672
8,555
8,747
9,178
9,716
10,306
Less: Acc. depreciation
3,012
3,300
3,693
4,152
4,638
5,153
Net Block
5,660
5,256
5,054
5,026
5,078
5,153
Capital work-in-progress
182
120
76
60
40
40
Goodwill
2,790
2,649
1,918
2,000
2,100
2,200
Investments
4,177
5,287
6,338
7,242
8,408
9,314
Long term loans and adv.
1,189
1,399
1,731
2,147
2,478
2,716
Other noncurrent assets
1,299
1,243
1,251
1,342
1,475
1,617
Current assets
12
751
1,568
1,911
2,431
2,762
Cash
643
892
741
764
840
921
Loans & advances
1,035
1,002
1,048
1,078
1,184
1,298
Other
3,193
4,234
4,535
4,656
5,133
5,622
Current liabilities
984
1,053
1,803
2,586
3,274
3,692
Net current assets
217
101
53
53
53
53
Misc. exp. not written off
-
-
-
-
-
-
Total Assets
9,833
9,178
8,903
9,725
10,546
11,138
February 13, 2017
7
Ashok Leyland | 3QFY2017 Result Update
Cash flow statement (Standalone)
Y/E March (` cr)
FY2015
FY2016
2017E
2018E
2019E
Profit before tax
442
1,169
1,840
2,163
2,364
Depreciation
416
444
459
486
515
Change in Working Capital
705
(128)
(410)
(62)
28
Interest / Dividend (Net)
367
229
133
134
134
Direct taxes paid
(50)
(441)
(547)
(649)
(709)
Others
(104)
402
-
-
-
Cash Flow from Operations
1,777
1,676
1,475
2,072
2,332
(Inc.)/ Dec. in Fixed Assets
(211)
(147)
(415)
(518)
(590)
(Inc.)/ Dec. in Investments
314
537
(112)
(207)
(214)
Cash Flow from Investing
103
390
(527)
(725)
(804)
Issue of Equity
667
-
-
-
-
Inc./(Dec.) in loans
(1,401)
(799)
46
64
(236)
Dividend Paid (Incl. Tax)
-
(154)
(518)
(757)
(827)
Interest / Dividend (Net)
(406)
(296)
(133)
(134)
(134)
Cash Flow from Financing
(1,140)
(1,249)
(605)
(828)
(1,197)
Inc./(Dec.) in Cash
740
817
343
520
331
Opening Cash balances
12
751
1,568
1,911
2,431
Closing Cash balances
751
1,568
1,911
2,431
2,762
February 13, 2017
8
Ashok Leyland | 3QFY2017 Result Update
Key ratios
Y/E March
FY2014
FY2015
FY2016
2017E
2018E
2019E
Valuation Ratio (x)
P/E (on FDEPS)
841.7
79.0
36.6
20.4
17.5
16.0
P/CEPS
60.9
35.2
22.7
15.1
13.2
12.4
P/BV
5.9
5.2
4.8
4.2
3.8
3.4
Dividend yield (%)
-
206.6
97.8
51.1
34.9
32.0
EV/Sales
2.9
1.9
1.4
1.3
1.1
1.0
EV/EBITDA
242.5
25.7
11.8
11.1
9.6
8.7
EV / Total Assets
2.2
2.0
1.9
1.8
1.6
1.4
Per Share Data (`)
EPS (Basic)
0.1
1.2
2.5
4.5
5.3
5.8
EPS (fully diluted)
0.1
1.2
2.5
4.5
5.3
5.8
Cash EPS
1.5
2.6
4.1
6.2
7.0
7.5
DPS
0.0
0.5
1.0
1.8
2.7
2.9
Book Value
15.6
18.0
19.4
22.1
24.8
27.7
Returns (%)
ROCE
(2.8)
7.2
21.1
20.2
21.2
21.7
Angel ROIC (Pre-tax)
(4.1)
12.0
36.7
35.7
39.4
41.6
ROE
0.7
6.5
13.1
20.6
21.5
21.0
Turnover ratios (x)
Asset Turnover (Gross Block)
1.1
1.6
2.2
2.2
2.3
2.3
Inventory / Sales (days)
45
38
34
40
42
42
Receivables (days)
49
34
25
25
25
25
Payables (days)
89
78
51
50
50
50
WC cycle (ex-cash) (days)
5
(6)
8
15
17
17
February 13, 2017
9
Ashok Leyland | 3QFY2017 Result Update
Research Team Tel: 022 - 39357800
DISCLAIMER
Angel Broking Private Limited (hereinafter referred to as “Angel”) is a registered Member of National Stock Exchange of India Limited,
Bombay Stock Exchange Limited and Metropolitan Stock Exchange of India Limited. It is also registered as a Depository Participant with
CDSL and Portfolio Manager with SEBI. It also has registration with AMFI as a Mutual Fund Distributor. Angel Broking Private Limited is
a registered entity with SEBI for Research Analyst in terms of SEBI (Research Analyst) Regulations, 2014 vide registration number
INH000000164. Angel or its associates has not been debarred/ suspended by SEBI or any other regulatory authority for accessing
/dealing in securities Market. Angel or its associates including its relatives/analyst do not hold any financial interest/beneficial
ownership of more than 1% in the company covered by Analyst. Angel or its associates/analyst has not received any compensation /
managed or co-managed public offering of securities of the company covered by Analyst during the past twelve months. Angel/analyst
has not served as an officer, director or employee of company covered by Analyst and has not been engaged in market making activity
of the company covered by Analyst.
This document is solely for the personal information of the recipient, and must not be singularly used as the basis of any investment
decision. Nothing in this document should be construed as investment or financial advice. Each recipient of this document should
make such investigations as they deem necessary to arrive at an independent evaluation of an investment in the securities of the
companies referred to in this document (including the merits and risks involved), and should consult their own advisors to determine
the merits and risks of such an investment.
Reports based on technical and derivative analysis center on studying charts of a stock's price movement, outstanding positions and
trading volume, as opposed to focusing on a company's fundamentals and, as such, may not match with a report on a company's
fundamentals.
The information in this document has been printed on the basis of publicly available information, internal data and other reliable
sources believed to be true, but we do not represent that it is accurate or complete and it should not be relied on as such, as this
document is for general guidance only. Angel Broking Pvt. Limited or any of its affiliates/ group companies shall not be in any way
responsible for any loss or damage that may arise to any person from any inadvertent error in the information contained in this report.
Angel Broking Pvt. Limited has not independently verified all the information contained within this document. Accordingly, we cannot
testify, nor make any representation or warranty, express or implied, to the accuracy, contents or data contained within this document.
While Angel Broking Pvt. Limited endeavors to update on a reasonable basis the information discussed in this material, there may be
regulatory, compliance, or other reasons that prevent us from doing so.
This document is being supplied to you solely for your information, and its contents, information or data may not be reproduced,
redistributed or passed on, directly or indirectly.
Neither Angel Broking Pvt. Limited, nor its directors, employees or affiliates shall be liable for any loss or damage that may arise from
or in connection with the use of this information.
Note: Please refer to the important ‘Stock Holding Disclosure' report on the Angel website (Research Section). Also, please refer to the
latest update on respective stocks for the disclosure status in respect of those stocks. Angel Broking Pvt. Limited and its affiliates may
have investment positions in the stocks recommended in this report.
Disclosure of Interest Statement
Ashok Leyland
1. Analyst ownership of the stock
No
2. Angel and its Group companies ownership of the stock
No
3. Angel and its Group companies' Directors ownership of the stock
No
4. Broking relationship with company covered
No
Note: We have not considered any Exposure below ` 1 lakh for Angel, its Group companies and Directors
Ratings (Based on expected returns
Buy (> 15%)
Accumulate (5% to 15%)
Neutral (-5 to 5%)
over 12 months investment period):
Reduce (-5% to -15%)
Sell (< -15)
February 13, 2017
10