2QFY2016 Result Update | Automobile
November 7, 2015
Ashok Leyland
BUY
CMP
`88
Performance Highlights
Target Price
`111
Quarterly highlights (Standalone)
Investment Period
12 Months
Y/E March (` cr)
2QFY16 2QFY15
% chg (yoy) 1QFY16
% chg (qoq)
Net Sales
4,940
3,218
53.5
3,841
28.6
EBITDA
594
229
159.8
389
52.9
Stock Info
EBITDA margin (%)
12.0
7.1
490 bp
10.1
190 bp
Sector
Automobile
Adj. PAT
287
121
137.6
159
80.0
Market Cap (` cr)
24,916
Source: Company, Angel Research
Net Debt (` cr)
1,432
Results miss estimates: Ashok Leyland (ALL)’s 2QFY2016 results have come in
Beta
1.4
below our estimates on account of a lower-than-anticipated top-line.
52 Week High / Low
100/34
Revenue grew by a robust 54% yoy and by 29% on a sequential basis to
Avg. Daily Volume
2,520,012
`4,940cr, but still, is below our estimate of `5,281cr. Volumes grew strongly by
Face Value (`)
1.0
51% yoy, led by a sharp 64% yoy growth in the MHCV segment. However, the
BSE Sensex
26,265
blended realization grew only marginally; it came in at `14.08 lakh/unit, up 2%
yoy, declined 4% sequentially, and is below our estimate of `15 lakh/unit. Lower
Nifty
7,954
proportion of defence supplies and exports led to a sequential dip in the
Reuters Code
ASOK.BO
realisation. Operating margin at 12% is at a record five-year high, improving
Bloomberg Code
AL@IN
sharply by 490bp yoy, and is broadly in line with our estimates of 12.6%. Soft
commodity prices, better product mix (with greater proportion of higher-tonnage
vehicles) and cost control initiatives implemented by the company enabled ALL to report
Shareholding Pattern (%)
a double-digit margin. The adj net profit, at `292cr, missed our estimate of `355cr.
Promoters
38.8
Outlook and valuation: ALL results were below estimates primarily due to lower
MF / Banks / Indian Fls
15.0
realization on account of unfavourable mix. However, we expect the mix to be
FII / NRIs / OCBs
23.7
favourable in 2HFY2016 due to higher defence supplies and recovery in exports
Indian Public / Others
22.5
which would boost realisations. Given the improvement in fleet operators’
sentiments due to revival in the economy, improvement in profitabilities due to
falling diesel prices, and policy action initiated in the infrastructure and the mining
Abs. (%)
3m 1yr 3yr
space, the MHCV demand would continue to grow in double digits. The MHCV
Sensex
(7.2)
(5.9)
39.6
industry is clearly in an up-cycle and we estimate ~17% CAGR in volume over
Ashok Leyland
0.5
87.3
260.3
FY2015- FY2017. Also, a better mix (higher proportion of MHCVs), reduction in
record high discounts due to volume growth, and operating leverage would result in
margin expansion, going forward. We expect operating margin to improve from 7.6% in
3 year price chart
FY2015 to 11.6% in FY2017 (in line with the margins witnessed in the previous up-cycle in
120
FY2011). We maintain our Buy on the stock with a revised price target of `111 (based on
100
80
13x FY2017 EV/EBIDTA).
60
Key financials (Standalone)
40
20
Y/E March (` cr)
FY2014
FY2015
FY2016E
FY2017E
0
Net Sales
9,943
13,562
17,995
21,544
% chg
(20.3)
36.4
32.7
19.7
Adjusted net profit
(476)
234
979
1,331
% chg
-
-
318.5
36.0
Source: Company, Angel Research
EBITDA (%)
1.7
7.6
11.4
11.6
EPS (`)
(1.8)
0.8
3.4
4.7
P/E (x)
-
107.1
25.6
18.8
P/BV (x)
5.3
4.9
4.5
4.2
RoE (%)
(10.7)
4.6
17.7
22.2
RoCE (%)
(6.0)
5.6
17.9
22.7
Bharat Gianani
EV/Sales (x)
2.7
2.0
1.5
1.2
022-3935 7800 Ext: 6817
EV/EBITDA (x)
161.5
25.8
13.0
10.4
Source: Company, Angel Research; Note: CMP as of November 7, 2015
Please refer to important disclosures at the end of this report
1
Ashok Leyland | 2QFY2016 Result Update
Exhibit 1: Quarterly financial performance (Standalone)
Y/E March (` cr)
2QFY16
2QFY15
% chg (yoy)
1QFY16
% chg (qoq)
1HFY16
1HFY15
% chg (yoy)
Net Sales
4,940
3,218
53.5
3,841
28.6
8,781
5,695
54.2
Consumption of RM
3,032
1,968
54.0
2,312
31.1
5,344
3,511
52.2
(% of sales)
61.4
61.2
60.2
60.9
61.6
Staff costs
378
291
29.8
330
14.5
709
575
23.3
(% of sales)
7.7
9.1
8.6
8.1
10.1
Purchase of traded goods
446
400
11.5
355
25.6
801
673
19.0
(% of sales)
9.0
12.4
9.2
9.1
11.8
Other expenses
490
329
48.7
455
7.6
944
607
55.5
(% of sales)
9.9
10.2
11.8
10.8
10.7
Total Expenditure
4,345
2,989
45.4
3,453
25.9
7,798
5,366
45.3
Operating Profit
594
229
159.8
389
52.9
983
329
198.5
OPM (%)
12.0
7.1
10.1
11.2
5.8
Interest
70
101
(30.3)
77
(8.3)
147
207
(29.1)
Depreciation
113
103
9.6
104
8.3
217
206
5.3
Other income
26
31
(15.4)
27
(2.3)
54
70
(23.4)
PBT (excl. Extr. Items)
438
56
235
673
(14)
Extr. income/expense
(5)
109
0
(5)
109
(104.7)
PBT (incl. Extr. Items)
433
165
161.8
235
84.2
668
95
(% of sales)
8.8
5.1
6.1
7.6
1.7
Provision for taxation
146
45
76
221
22
(% of PBT)
33.3
79.2
32.2
32.9
(155.4)
Reported PAT
287
121
137.6
159
80.0
446
73
513.3
Adj PAT
292
12
159
451
(36)
Adj. PATM
5.9
0.4
4.1
5.1
(0.6)
Equity capital (cr)
285
266
285
285
266
Adjusted EPS (`)
1.0
0.0
0.6
2
(0)
Source: Company, Angel Research
Exhibit 2: 2QFY2016 - Actual vs Angel estimates
Y/E March (` cr)
Actual
Estimates
Variation (%)
Net Sales
4,940
5,281
(6.5)
EBITDA
594
668
(11.0)
EBITDA margin (%)
12.0
12.6
(60 bp)
Adj. PAT
292
355
(17.9)
Source: Company, Angel Research
Exhibit 3: Quarterly volume performance
(units)
2QFY16
2QFY15
% chg (yoy)
1QFY16
% chg (qoq)
1HFY16
1HFY15
% chg (yoy)
MHCV passenger
7,051
5,314
32.7
5,167
36.5
12,218
9,264
31.9
MHCV goods
22,800
12,895
76.8
16,314
39.8
39,114
23,854
64.0
Total volume (ex. Dost)
29,851
18,209
63.9
21,481
39.0
51,332
33,118
55.0
LCV
7,428
7,051
5.3
6,673
11.3
14,101
12,014
17.4
Total volume (incl. Dost)
37,279
25,260
47.6
28,154
32.4
65,433
45,132
45.0
Source: Company, Angel Research
November 7, 2015
2
Ashok Leyland | 2QFY2016 Result Update
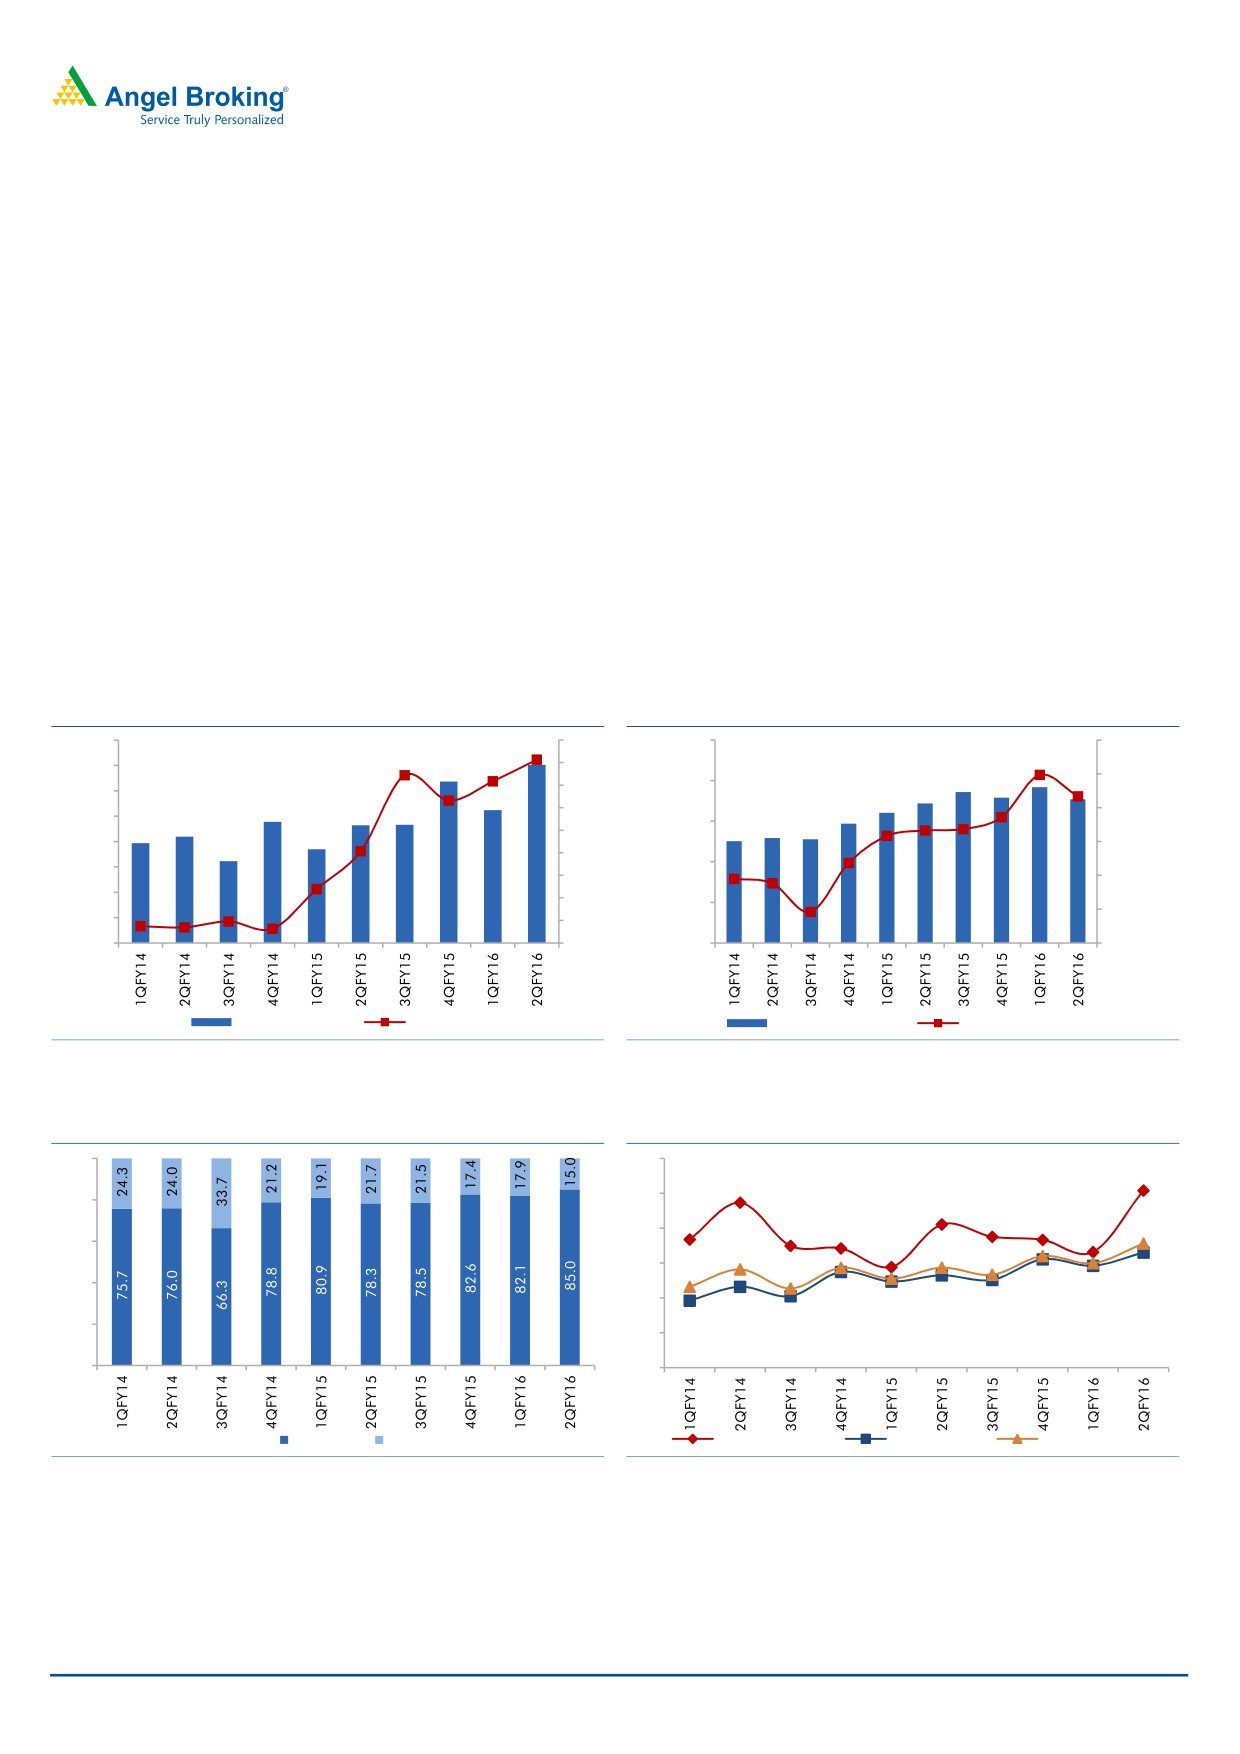
ALL’s volumes continued to improve, reporting double-digit growth for the fifth
consecutive quarter. During 2QFY2016, volumes grew by a robust 51% yoy.
The MHCV segment continued to outperform, growing by 77% yoy, helped to
an extent by pre-buying ahead of the application of new safety features from
October 2015, while LCV volumes grew by a subtle 5% yoy, reflecting the
sluggish trend in this segment.
Realisation/vehicle grew 2% yoy to `1,407,762, led by higher proportion of
MHCVs and price hikes. Contribution/vehicle grew 14% yoy to `416,738,
given the favourable product mix and soft commodity prices.
ALL continued to gain market share on back of higher proportion of the fast
growing heavy trucks and geographical expansion. ALL’s MHCV market share
improved 570bp yoy from 27.1% in 1HFY2015 to 32.8% in 1HFY2016. Its
MHCV truck market share improved 550bp yoy from 25.6% in 1HFY2015 to
31.1% in 1HFY2016. Similarly, ALL’s market share in the MHCV passenger
segment increased 700bp from 35% in 1HFY2015 yoy to 42% in 1HFY2016.
Exhibit 4: Double-digit volume growth continues
Exhibit 5: Realisation & contribution jump yoy
40,000
60
1,700,000
500,000
35,000
50
450,000
1,500,000
30,000
40
30
400,000
25,000
1,300,000
20
20,000
350,000
10
1,100,000
15,000
0
300,000
10,000
(10)
900,000
250,000
5,000
(20)
0
(30)
700,000
200,000
Overall Volumes
yoy chg %
Realisation/vehicle
Contribution/vehicle
Source: Company, Angel Research
Source: Company, Angel Research
Exhibit 6: MHCVs share in product mix rises yoy
Exhibit 7: Domestic market share trend
100
60
50
80
40
60
30
40
20
20
10
0
0
MHCV
LCV
MHCV Passenger
MHCV Goods
Overall MHCV
Source: SIAM, Angel Research
Source: SIAM, Angel Research
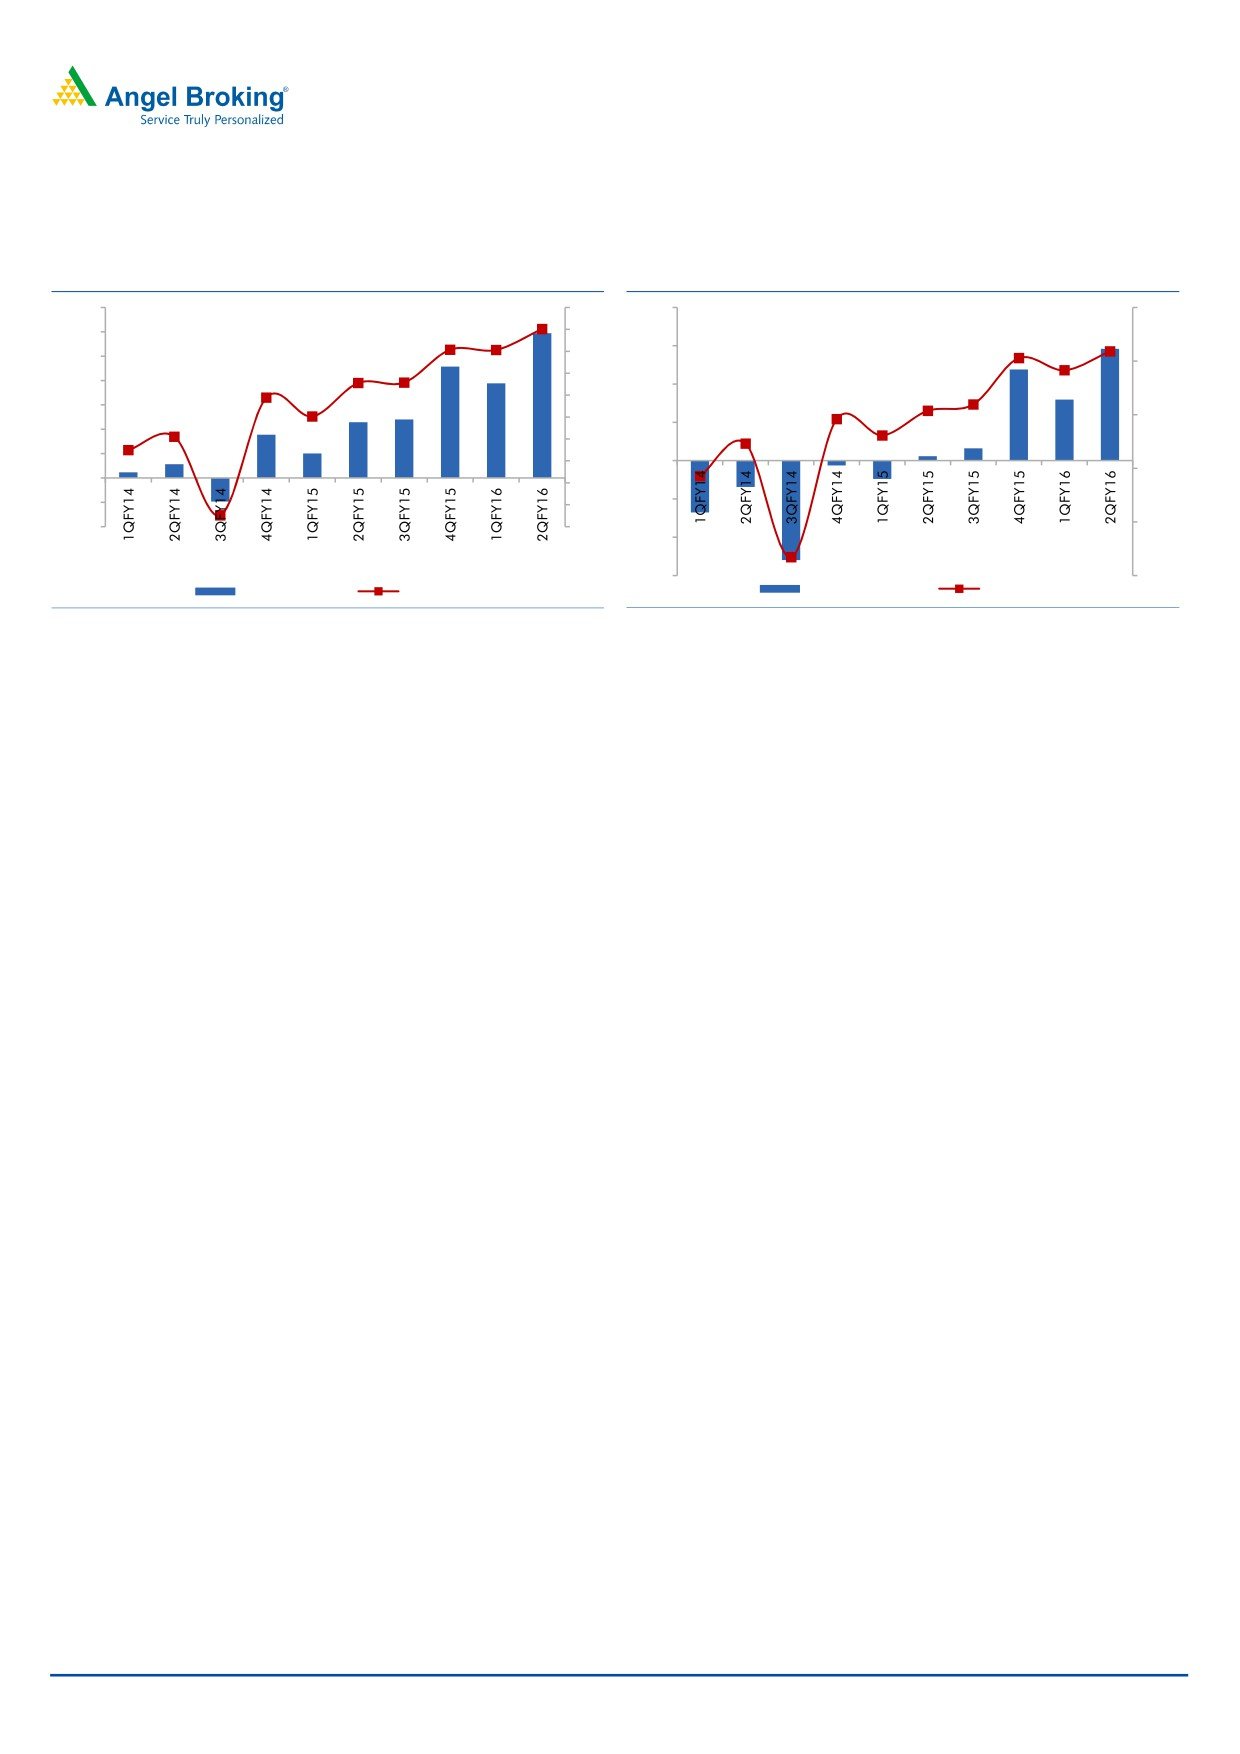
ALL maintained its double-digit margin for the third consecutive quarter,
reporting a five-year record high margin of 12% in 2QFY2016. Higher
proportion of MHCVs in the product mix and operating leverage led to the
steep improvement in margins on a yoy basis.
November 7, 2015
3
Ashok Leyland | 2QFY2016 Result Update
ALL’s profits continue to improve led by a strong operating performance.
Exhibit 8: EBITDA margin improves sharply yoy
Exhibit 9: Bottom-line continues to improve yoy
700
14
400
10
600
12
10
300
500
5
8
400
200
6
300
4
0
100
200
2
100
0
0
(5)
0
(2)
(100)
(4)
(100)
(200)
(6)
(10)
(200)
(300)
(15)
EBIDTA (` cr)
Margin %
Net Profit (` cr)
Margin %
Source: Company, Angel Research
Source: Company, Angel Research
Conference call - Key highlights
The MHCV industry continues to maintain its strong momentum, reporting a
43% yoy growth in 2QFY2016. Better freight movement on back of improved
economic growth and improvement in fleet operators’ sentiment due to firm
freight rates and decline in diesel prices are spurring demand for MHCVs. The
MHCV demand is estimated to remain robust with the Management expecting
a more than 20% industry growth for FY2016.
As per the Management, the fleet replacement demand being witnessed
currently is being driven by improvement in fleet operators’ sentiments. An
expected improvement in core industries on account of economic growth and
pick-up in mining would drive new fleet demand, which would help maintain
double-digit growth momentum in the MHCV industry.
ALL continues to gain market share in the MHCV segment with its
strengthening presence in non-South markets. ALL’s market share improved
from 28.2% in FY2015 to 32.8% in 1HFY2016.
Discounting/vehicle in the MHCV space continues to remain high at `2 lakh to
`2.25 lakh. ALL however has been taking periodic price increases to neutralize
the impact of high discounts. ALL undertook a price increase of 1% to 1.5% in
2QFY2016.
ALL expects commodity prices to remain soft in the near term as in 2QFY2016
and expects the benefits of the same to accrue in 3Q as well, as lower raw
material prices flow into the P&L with a lag of a quarter.
ALL continues to focus on the export markets, particularly the Middle East and
Africa to enable diversification and reduce cyclicality. ALL aims to increase the
export contribution from 15% currently to 33% over the next three to five years.
As per the Management, the company’s current MHCV capacity stands at 1.5
lakh units per annum which would suffice for the demand in the near term.
ALL is not contemplating any capacity addition in MHCV as of now.
November 7, 2015
4
Ashok Leyland | 2QFY2016 Result Update
ALL has guided for overall capex and subsidiary investment of `500cr in
FY2016. The capex would be towards new product development and R&D.
Further ALL would invest for meeting the funding requirements of its
subsidiaries and investment.
Investment arguments
Double-digit volume growth over medium term as ALL would be a direct
beneficiary of the improving CV cycle: ALL is a pure CV play and is poised to
report strong double digit growth (~20% over FY2015-FY2017), given the uptrend
in the CV cycle. The MHCV segment, accounting for 80% of ALL’s total volumes,
has undergone a sharp improvement in FY2015 (industry grew
16% yoy).
Improvement in fleet operators’ sentiments on back of better economic outlook,
and increase in profitability due to fall in diesel prices, would lead to continued
improvement in demand. The MHCV industry has shown improvement after a gap
of three years and we believe the industry would remain in an upcycle in the
medium term. Further we also expect improvement in the LCV segment in FY2016
on back of gradual improvement in sentiments.
EBITDA margin to improve amid volume improvement and operating leverage: We
expect ALL’s margins to improve sharply in FY2016/FY2017 and reach the pre-
down cycle levels. We estimate ALL’s margins to improve from 7.6% in FY2015
and reach ~11% in FY2017 (margin levels reported by the company in the
FY2011 up-cycle). We believe the margin improvement would be driven by: (a)
steep improvement in MHCV volumes, (b) reduction in discounting levels. Currently
the discount/vehicle, at `2 lakh, is at record levels and is expected to come down
with pick-up in demand, (c) benefits of operating leverage, given the sharp
improvement in volumes.
Outlook and valuation
ALL results were below estimates primarily due to lower realization on account of
unfavourable mix. However, we expect the mix to be favourable in 2HFY2016 due
to higher defence supplies and recovery in exports which would boost realisations.
Given the improvement in fleet operators’ sentiments due to revival in the
economy, improvement in profitabilities due to falling diesel prices, and policy
action initiated in the infrastructure and the mining space, the MHCV demand
would continue to grow in double digits. The MHCV industry is clearly in an up-
cycle and we estimate ~17% CAGR in volume over FY2015- FY2017. Also, a
better mix (higher proportion of MHCVs), reduction in record high discounts due to
volume growth, and operating leverage would result in margin expansion, going forward.
We expect operating margin to improve from 7.6% in FY2015 to 11.6% in FY2017 (in line
with the margins witnessed in the previous up-cycle in FY2011). We maintain our Buy on
the stock with a revised price target of `111 (based on 13x FY2017 EV/EBIDTA).
November 7, 2015
5
Ashok Leyland | 2QFY2016 Result Update
Exhibit 10: Key assumptions
(units)
FY2012
FY2013
FY2014
FY2015
FY2016E
FY2017E
MHCV passenger
26,312
23,472
19,328
20,722
24,866
27,602
MHCV goods
67,425
55,442
40,976
56,938
78,409
92,546
LCV
7,593
34,918
28,205
26,904
30,573
34,231
Total volume (units)
101,990
114,612
88,509
104,564
133,849
154,379
% yoy chg
8.4
12.4
(22.8)
18.1
28.0
15.3
Source: Company, Angel Research
Company background
Ashok Leyland Ltd (ALL) is the country's second largest CV manufacturer. The
company has a strong presence in the MHCV segment, with a domestic market
share of ~28% as of FY2015. ALL enjoys a dominant position in southern India,
with an ~50% market share, and is currently focusing on expanding its presence in
northern and western India by increasing its touch points in the region. The
company, through its JV with Nissan Motor and John Deere, intends to expand its
product portfolio and has launched Dost to tap the growing LCV demand, and a
backhoe loader used in the construction industry.
November 7, 2015
6
Ashok Leyland | 2QFY2016 Result Update
Profit and loss statement (Standalone)
Y/E March (` cr)
FY2012
FY2013
FY2014
FY2015
FY2016E
FY2017E
Total operating income
12,904
12,481
9,943
13,562
17,995
21,544
% chg
13.0
(3.3)
(20.3)
36.4
32.7
19.7
Total expenditure
11,807
11,650
9,777
12,536
15,948
19,035
Net raw material costs
9,464
9,123
7,603
9,965
12,605
15,240
Employee expenses
1,036
1,087
1,000
1,184
1,479
1,535
Other
1,030
1,140
925
1,386
1,864
2,260
EBITDA
1,098
831
167
1,027
2,047
2,509
% chg
(9.6)
(24.2)
(81.0)
516.4
99.4
22.6
(% of total op. income)
8.5
6.7
1.7
7.6
11.4
11.6
Depreciation & amortization
353
381
377
416
447
455
EBIT
745
451
(530)
466
1,555
2,057
% chg
(21.3)
(39.5)
NA
NA
233.8
32.3
(% of total op. income)
5.8
3.6
(5.3)
3.4
8.6
9.5
Interest and other charges
255
377
453
394
302
308
Other income
201
397
67
124
129
155
Recurring PBT
690
471
(597)
341
1,426
1,902
% chg
(13.9)
(31.8)
NA
NA
317.9
33.3
Extraordinary income/(exp.)
4
271
506
101
(5)
PBT
686
200
(91)
442
1,426
1,902
Tax
124
37
(121)
107
447
570
(% of PBT)
18.1
18.5
132.2
24.3
31.4
30.0
PAT (reported)
566
434
29
335
974
1,331
ADJ. PAT
562
163
(476)
234
979
1,331
% chg
(10.7)
(71.0)
NA
NA
318.5
36.0
(% of total op. income)
4.4
1.3
(4.8)
1.7
5.4
6.2
Basic EPS (`)
2.1
1.6
0.1
1.2
3.4
4.7
Adj. EPS (`)
2.1
0.6
(1.8)
0.8
3.4
4.7
% chg
(10.7)
(71.0)
NA
NA
318.5
36.0
November 7, 2015
7
Ashok Leyland | 2QFY2016 Result Update
Balance sheet statement (Standalone)
Y/E March (` cr)
FY2012 FY2013
FY2014
FY2015
FY2016E
FY2017E
SOURCES OF FUNDS
Equity share capital
266
266
266
285
285
285
Reserves & surplus
3,942
4,189
4,182
4,834
5,240
5,715
Shareholders’ Funds
4,208
4,455
4,448
5,119
5,525
5,999
Total loans
2,395
3,505
3,884
2,591
2,500
2,400
Deferred tax liability
490
527
407
510
510
510
Other long term liabilities
4
2
2
2
4
4
Long term provisions
77
79
68
79
126
151
Total Liabilities
7,174
8,568
8,809
8,301
8,665
9,064
APPLICATION OF FUNDS
Gross block
7,256
7,991
8,699
8,555
8,755
8,955
Less: Acc. depreciation
2,343
2,709
3,012
3,300
3,747
4,202
Net Block
4,914
5,282
5,686
5,256
5,008
4,753
Capital work-in-progress
548
689
155
120
155
155
Goodwill
-
-
-
Investments
1,534
2,338
2,790
2,649
2,990
3,340
Long term loans and adv.
608
480
673
983
990
1,185
Other noncurrent assets
7
12
33
19
60
75
Current assets
4,304
4,297
3,471
4,285
6,610
8,115
Cash
33
14
12
751
332
550
Loans & advances
810
967
801
569
1,513
1,896
Other
3,461
3,315
2,659
2,964
4,765
5,669
Current liabilities
4,741
4,529
3,999
5,011
7,149
8,559
Net current assets
(438)
(233)
(528)
(726)
(539)
(444)
Misc. exp. not written off
-
-
-
Total Assets
7,174
8,568
8,809
8,301
8,665
9,064
November 7, 2015
8
Ashok Leyland | 2QFY2016 Result Update
Cash flow statement (Standalone)
Y/E March (` cr)
FY2012 FY2013 FY2014 FY2015 FY2016E FY2017E
Profit before tax
690
471
(91)
442
1,426
1,902
Depreciation
353
381
303
287
447
455
Change in working capital
22
(47)
274
609
(607)
123
Others
407
359
(325)
146
2
(185)
Other income
(201)
(397)
-
Direct taxes paid
(124)
(37)
121
(107)
(447)
(570)
Cash Flow from Operations
1,147
730
281
1,377
821
1,724
(Inc.)/Dec. in fixed assets
(755)
(876)
(174)
178
(235)
(200)
(Inc.)/Dec. in investments
(304)
(803)
(452)
141
(342)
(350)
Other income
201
397
-
-
Cash Flow from Investing
(859)
(1,282)
(626)
319
(576)
(550)
Issue of equity
0
(1)
-
19
-
-
Inc./(Dec.) in loans
47
1,110
379
(1,293)
(91)
(100)
Dividend paid (Incl. Tax)
309
187
-
(128)
(573)
(857)
Others
(793)
(761)
(37)
446
-
-
Cash Flow from Financing
(436)
534
342
(957)
(664)
(957)
Inc./(Dec.) in cash
(148)
(18)
(2)
740
(419)
218
Opening Cash balances
180
32
14
12
751
332
Closing Cash balances
32
14
12
751
332
550
November 7, 2015
9
Ashok Leyland | 2QFY2016 Result Update
Key ratios
Y/E March
FY2012
FY2013
FY2014
FY2015
FY2016E
FY2017E
Valuation Ratio (x)
P/E (on FDEPS)
41.9
158.0
NA
107.1
25.6
18.8
P/CEPS
25.9
44.3
NA
38.5
17.6
14.0
P/BV
8.1
5.3
5.3
4.9
4.5
4.2
Dividend yield (%)
1.1
0.7
NA
NA
2.0
2.9
EV/Sales
2.0
2.1
2.7
2.0
1.5
1.2
EV/EBITDA
23.9
30.2
161.5
25.8
13.0
10.4
EV / Total Assets
3.7
3.1
3.1
3.2
3.1
2.9
Per Share Data (`)
EPS (Basic)
2.1
0.6
(1.8)
0.8
3.4
4.7
EPS (fully diluted)
2.1
0.6
(1.8)
0.8
3.4
4.7
Cash EPS
3.4
2.0
(0.4)
2.3
5.0
6.3
DPS
1.0
0.6
-
-
1.7
2.6
Book Value
10.9
16.7
16.7
18.0
19.4
21.1
Dupont Analysis
EBIT margin
5.8
2.0
(5.3)
3.4
8.6
9.5
Tax retention ratio
0.8
0.9
(0.3)
0.8
0.7
0.7
Asset turnover (x)
2.3
1.5
1.1
1.8
2.2
2.5
ROIC (Post-tax)
10.9
2.6
1.9
4.7
12.8
16.9
Cost of Debt (Post Tax)
8.8
9.9
NA
11.5
8.3
9.0
Leverage (x)
0.2
0.8
0.8
0.3
0.3
0.2
Operating ROE
11.4
(3.1)
NA
2.8
14.1
18.4
Returns (%)
ROCE (Pre-tax)
10.6
2.8
(6.0)
5.6
17.9
22.7
Angel ROIC (Pre-tax)
12.8
2.8
(6.0)
6.2
18.7
24.2
ROE
13.8
3.2
(10.7)
4.6
17.7
22.2
Turnover ratios (x)
Asset Turnover (Gross Block)
1.9
1.5
1.1
1.6
2.1
2.4
Inventory / Sales (days)
63
55
44
45
45
45
Receivables (days)
34
42
48
48
48
48
Payables (days)
108
123
144
145
145
145
WC cycle (ex-cash) (days)
(6)
(26)
(52)
(52)
(52)
(52)
Solvency ratios (x)
Net debt to equity
0.2
0.8
0.8
0.3
0.3
0.2
Net debt to EBITDA
0.8
4.0
20.9
1.4
0.8
0.5
Interest Coverage (EBIT / Int.)
2.9
0.6
(1.2)
1.2
5.2
6.7
November 7, 2015
10
Ashok Leyland | 2QFY2016 Result Update
Research Team Tel: 022 - 39357800
DISCLAIMER
Angel Broking Private Limited (hereinafter referred to as “Angel”) is a registered Member of National Stock Exchange of India Limited,
Bombay Stock Exchange Limited and Metropolitan Stock Exchange of India Limited. It is also registered as a Depository Participant with
CDSL and Portfolio Manager with SEBI. It also has registration with AMFI as a Mutual Fund Distributor. Angel Broking Private Limited is
a registered entity with SEBI for Research Analyst in terms of SEBI (Research Analyst) Regulations, 2014 vide registration number
INH000000164. Angel or its associates has not been debarred/ suspended by SEBI or any other regulatory authority for accessing
/dealing in securities Market. Angel or its associates including its relatives/analyst do not hold any financial interest/beneficial
ownership of more than 1% in the company covered by Analyst. Angel or its associates/analyst has not received any compensation /
managed or co-managed public offering of securities of the company covered by Analyst during the past twelve months. Angel/analyst
has not served as an officer, director or employee of company covered by Analyst and has not been engaged in market making activity
of the company covered by Analyst.
This document is solely for the personal information of the recipient, and must not be singularly used as the basis of any investment
decision. Nothing in this document should be construed as investment or financial advice. Each recipient of this document should
make such investigations as they deem necessary to arrive at an independent evaluation of an investment in the securities of the
companies referred to in this document (including the merits and risks involved), and should consult their own advisors to determine
the merits and risks of such an investment.
Reports based on technical and derivative analysis center on studying charts of a stock's price movement, outstanding positions and
trading volume, as opposed to focusing on a company's fundamentals and, as such, may not match with a report on a company's
fundamentals.
The information in this document has been printed on the basis of publicly available information, internal data and other reliable
sources believed to be true, but we do not represent that it is accurate or complete and it should not be relied on as such, as this
document is for general guidance only. Angel Broking Pvt. Limited or any of its affiliates/ group companies shall not be in any way
responsible for any loss or damage that may arise to any person from any inadvertent error in the information contained in this report.
Angel Broking Pvt. Limited has not independently verified all the information contained within this document. Accordingly, we cannot
testify, nor make any representation or warranty, express or implied, to the accuracy, contents or data contained within this document.
While Angel Broking Pvt. Limited endeavors to update on a reasonable basis the information discussed in this material, there may be
regulatory, compliance, or other reasons that prevent us from doing so.
This document is being supplied to you solely for your information, and its contents, information or data may not be reproduced,
redistributed or passed on, directly or indirectly.
Neither Angel Broking Pvt. Limited, nor its directors, employees or affiliates shall be liable for any loss or damage that may arise from
or in connection with the use of this information.
Note: Please refer to the important ‘Stock Holding Disclosure' report on the Angel website (Research Section). Also, please refer to the
latest update on respective stocks for the disclosure status in respect of those stocks. Angel Broking Pvt. Limited and its affiliates may
have investment positions in the stocks recommended in this report.
Disclosure of Interest Statement
Ashok Leyland
1. Analyst ownership of the stock
No
2. Angel and its Group companies ownership of the stock
No
3. Angel and its Group companies' Directors ownership of the stock
No
4. Broking relationship with company covered
No
Note: We have not considered any Exposure below ` 1 lakh for Angel, its Group companies and Directors
Ratings (Based on expected returns
Buy (> 15%)
Accumulate (5% to 15%)
Neutral (-5 to 5%)
over 12 months investment period):
Reduce (-5% to -15%)
Sell (< -15)
November 7, 2015
11