1QFY2018 Result Update | Automobile
July 25, 2017
Ashok Leyland
BUY
CMP
`105
Performance Highlights
Target Price
`124
Quarterly highlights (Standalone)
Investment Period
12 Months
Y/E March (` cr)
1QFY18 1QFY17
% chg (yoy) 4QFY17
% chg (qoq)
Net Sales
4,238
4,259
(0.5)
6,618
(36.0)
Stock Info
EBITDA
306
482
(36.5)
730
(38.2)
Sector
Automobile
EBITDA margin (%)
7
11
-410 bps
11
-381 bps
Adj. PAT
111
291
(61.7)
476
(76.6)
Market Cap (` cr)
30,699
Source: Company, Angel Research
Net Debt (` cr)
1,233
Results below estimates: ALL reported 0.5% decline in the top line to `4,238cr
Beta
1.4
while 62% yoy decline in the adj. PAT to `111cr. Though sales beat the cons.
52 Week High / Low
109/74
estimates, bottom line missed the estimates by 27% due to the higher RM costs
Avg. Daily Volume
1,403,777
and overheads. This was a one-off quarter due to GST and BSIV led disruption.
Face Value (`)
1.0
The results are not comparable due to merger of foundry business with itself.
BSE Sensex
32,228
Realizations increase due to price hike: While the sales were weak during the
Nifty
9,965
quarter (volumes declined by 8.6% yoy), per unit realization was higher by 8.8%
Reuters Code
ASOK.BO
yoy as company has taken the price hike due to the transition to the BSIV fuel
Bloomberg Code
AL@IN
norms. The MHCV volumes during the quarter were down by 17% while LCV
volumes were up 21% yoy.
Margins decline due to higher RM costs: Owing to the 10% growth in the RM
Shareholding Pattern (%)
costs/unit, gross margins declined by 80bps. EBITDA declined by 36.5% yoy to
Promoters
51.3
`306cr, while margins declined sharply to 7.2% vs. 11.3% in 1QFY17 and 11.0%
MF / Banks / Indian Fls
9.4
in 4QFY17. Company reported PAT at `126cr, adjusted for exceptional items
FII / NRIs / OCBs
22.2
(impairment of loss in a subsidiary and exchange loss), PAT is at `111cr. The
result clearly shows that slower sales growth and higher input /operating prices
Indian Public / Others
17.1
have impacted the numbers in the quarter.
Positive guidance by management: The management has guided of strong
Abs. (%)
3m 1yr 3yr
demand in the remainder of the year owing to the new technology iEGR. It also
Sensex
7.7
14.8
27.4
expects to launch new LCV every quarter. Company took 7-10% hike in April-17
Ashok Leyland
18.1
8.2
173.1
owing to the BSIV transition and has taken another hike in 1QFY18 to offset
higher input prices. Company has indicated of `500cr capex in FY18.
Valuation and outlook: We expect company to report CAGR of 11%/17% in the
3 year price chart
volumes/revenue over next two years. We maintain our Buy on the stock with a price
120
target of `124 - 20x of FY2019E EPS `6.2 (10.8x FY2019E EV/EBITDA multiple).
100
Key financials (Standalone)
80
60
Y/E March (` cr)
FY2016
FY2017
FY2018E FY2019E
40
Net Sales
18,937
20,019
23,339
27,240
20
% chg
39.6
5.7
16.6
16.7
0
Adjusted net profit
1,200
1,559
1,360
1,819
% chg
16.4
213.9
11.2
33.7
EBITDA (%)
11.9
11.0
10.1
10.8
EPS (`)
1.4
4.3
4.6
6.2
Source: Company, Angel Research
P/E (x)
76.6
24.4
22.6
16.9
P/BV (x)
5.7
5.0
4.5
4.0
RoE (%)
7.2
20.0
20.0
23.6
RoCE (%)
22.6
20.4
21.6
26.9
EV/Sales (x)
1.6
1.5
1.3
1.1
EV/EBITDA (x)
13.1
13.2
12.5
9.8
Shrikant Akolkar
Source: Company, Angel Research; Note: CMP as of July 25, 2017
022-3935 7800 Ext: 6846
Please refer to important disclosures at the end of this report
1
Ashok Leyland | 1QFY2018 Result Update
Exhibit 1: Quarterly financial performance (Standalone)
Y/E March (` cr)
1QFY18
1QFY17
% chg (yoy)
4QFY17
% chg (qoq)
Net Sales
4,238
4,259
(0.5)
6,618
(36.0)
Consumption of RM
2,942
2,925
0.6
4,760
(38.2)
(% of sales)
69.4
68.7
(0.8)
71.9
Staff costs
438
358
22.2
412
6.3
(% of sales)
10.3
8.4
6.2
Purchase of traded goods
552
494
11.7
716
(22.9)
(% of sales)
13.0
11.6
10.8
Total Expenditure
3,932
3,777
4.1
5,888
(33.2)
Operating Profit
306
482
(37)
730
(58.1)
OPM (%)
7.2
11.3
11.0
Interest
37
34
8.3
42
(13.4)
Depreciation
132
121
9.2
139
(5.3)
Other income
38
39
(0.3)
40
(4.8)
PBT (excl. Extr. Items)
176
366
588
Extr. income/expense
0
0
0
PBT (incl. Extr. Items)
176
366
(52.0)
588
(70.1)
(% of sales)
4.1
8.6
8.9
Provision for taxation
49
125
(216)
(% of PBT)
28
34
(37)
Reported PAT
126
241
(47.5)
804
(84.3)
Adj PAT
111
291
(61.7)
476
(76.6)
Adj. PATM
2.6
6.8
7.2
Equity capital (cr)
285
285
285
Adjusted EPS (`)
0.4
1.0
1.7
Source: Company, Angel Research
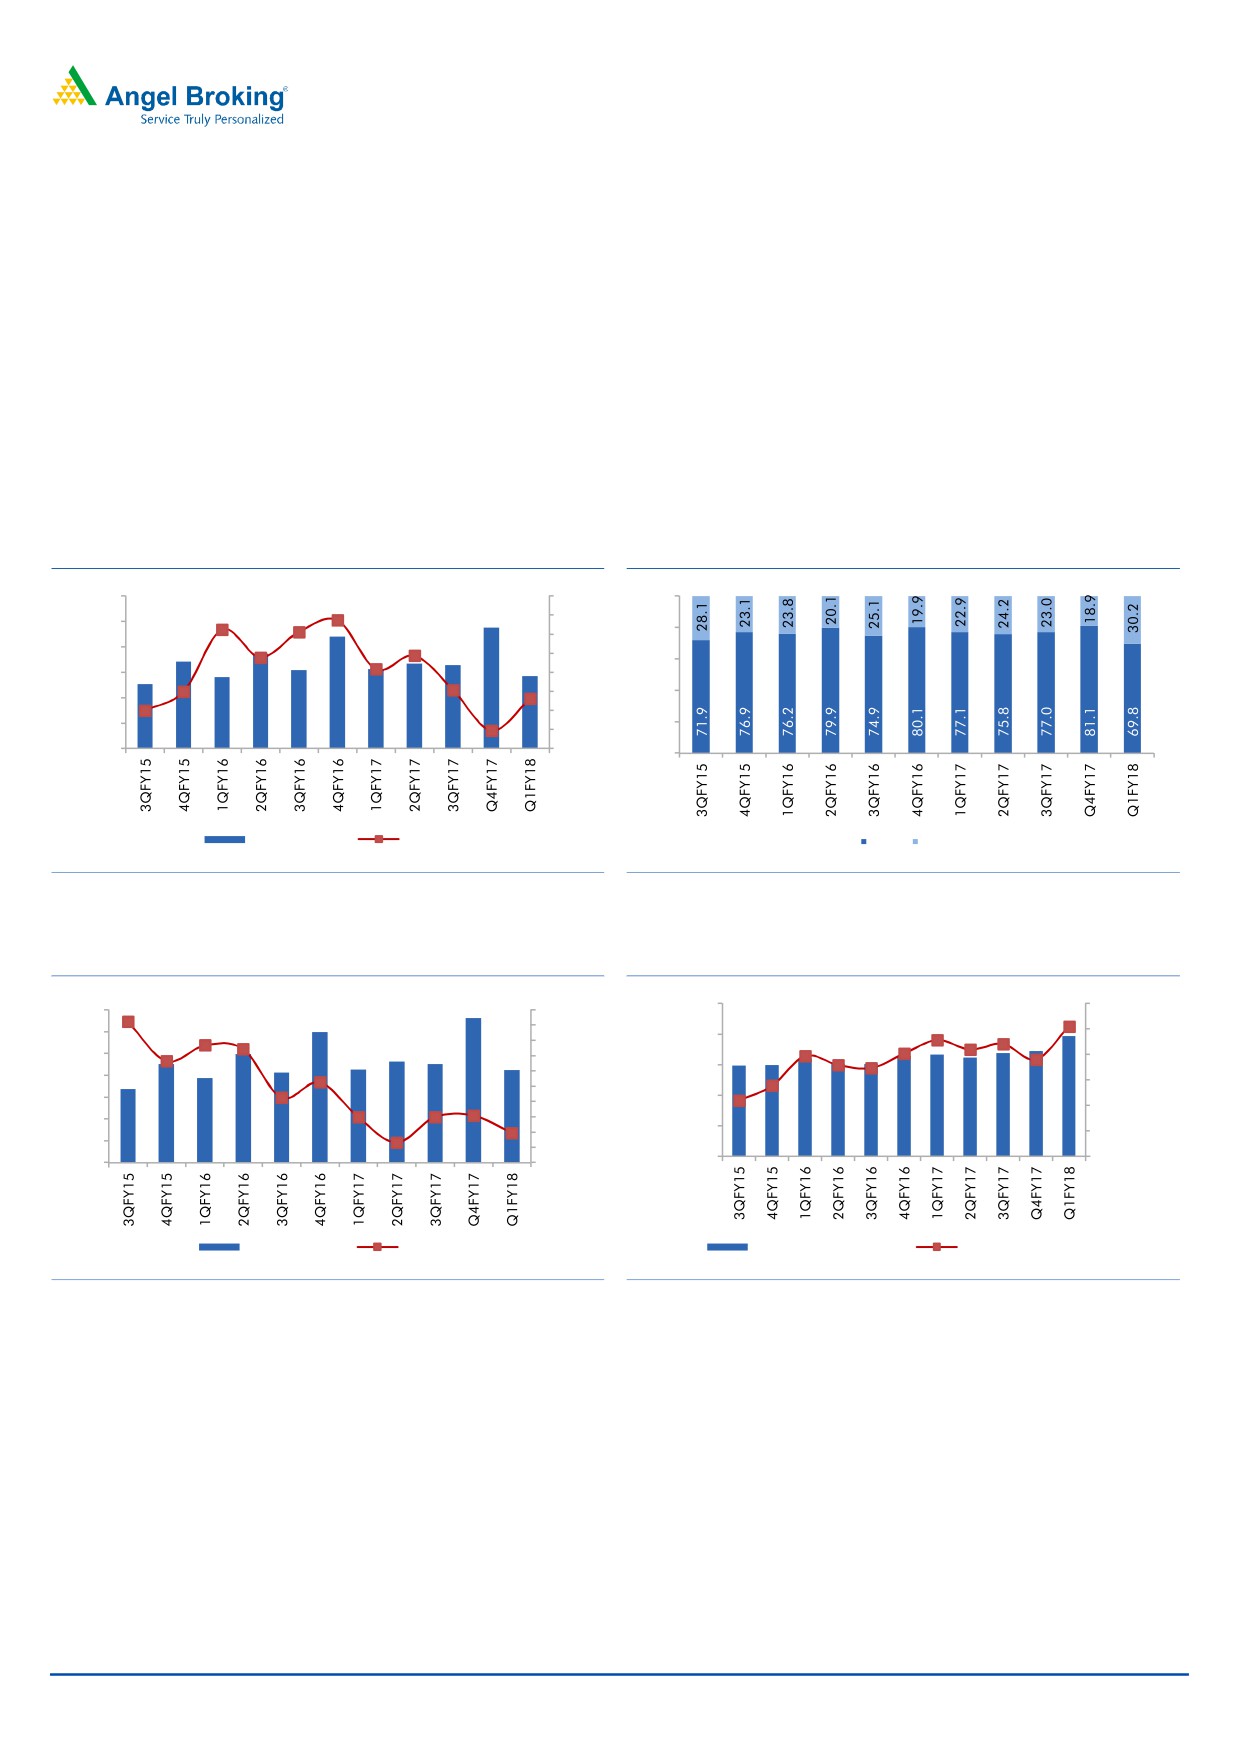
Exhibit 2: Quarterly volume performance
(units)
1QFY18
1QFY17
% chg (yoy)
4QFY17
% chg (qoq)
MH&CV
19,877
24,027
(17.3)
38,643
(48.6)
LCV
8,618
7,138
20.7
8,978
(4.0)
Total volume (ex. Dost)
28,495
31,165
(8.6)
47,621
(40.2)
Source: Company, Angel Research
July 25, 2017
2
Ashok Leyland | 1QFY2018 Result Update
ALLs MHCV volumes declined by 17% yoy during the quarter due to the BSIV
transition.
Realization/vehicle increased by
10% yoy to
`14.87 lakh, as company
increased prices on the back of roll out of BSIV vehicles.
RM cost per vehicle increased by 10% yoy to ` 10.32lakh. This was due to
increase in the raw material costs.
Market share expansion continued on the back of higher proportion of the fast
growing heavy trucks and geographical expansion. ALL’s market share
improved to 34.7% in 1QFY18.
Exhibit 3: Volume decline due to BSIV transition...
Exhibit 4: ..led to decline in MHCV share in volume mix
60,000
60
100
50
50,000
80
40
40,000
30
60
30,000
20
10
40
20,000
0
10,000
20
(10)
0
(20)
0
Overall Volumes
yoy chg %
MHCV (%) LCV (%)
Source: Company, Angel Research
Source: Company, Angel Research
Exhibit 5: Net sales declines 0.5% yoy
Exhibit 6: Realisation & contribution trend
1,700,000
500,000
7,000
80.0
70.0
450,000
1,500,000
6,000
60.0
5,000
50.0
400,000
1,300,000
4,000
40.0
350,000
30.0
3,000
1,100,000
20.0
300,000
2,000
10.0
900,000
0.0
250,000
1,000
-10.0
700,000
200,000
0
-20.0
Net sales (` cr)
Growth %
Realisation/vehicle (`)
Contribution/vehicle (`)
Source: SIAM, Angel Research
Source: SIAM, Angel Research
Company has indicated improving exports and more focus on LCV business
by launch of new product every quarter.
Aftermarket revenue during the quarter grew 34% yoy.
July 25, 2017
3
Ashok Leyland | 1QFY2018 Result Update
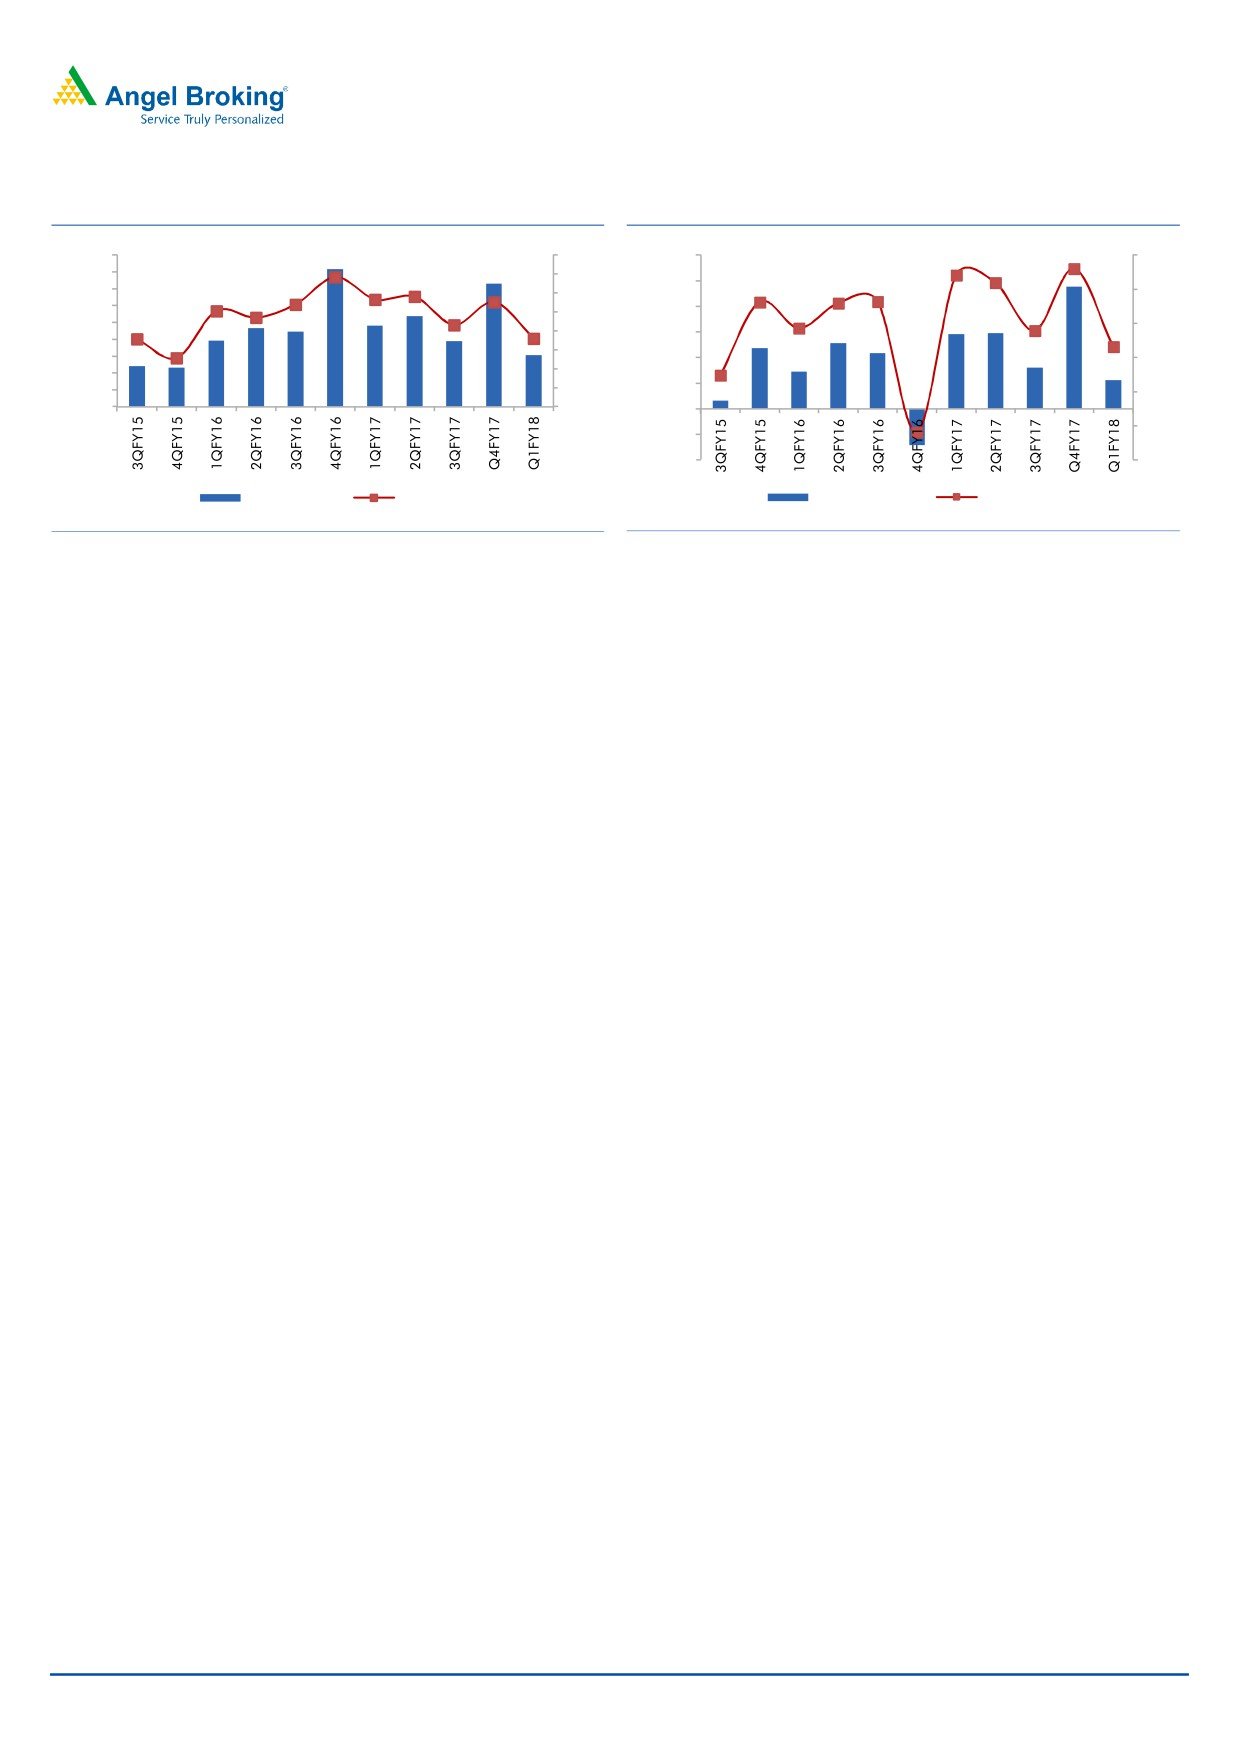
Exhibit 7: Sharp decline in margin due to higher costs
Exhibit 8: Bottom-line takes severe beating
900.0
16
600.0
8
800.0
14
500.0
700.0
12
6
600.0
400.0
10
500.0
4
8
300.0
400.0
6
300.0
200.0
2
200.0
4
2
100.0
100.0
0
0.0
0
0.0
(2)
(100.0)
(200.0)
(4)
EBIDTA (` cr)
Margin %
Net Profit (` cr)
Margin %
Source: Company, Angel Research
Source: Company, Angel Research
Conference call - Key highlights
Company expects ~10% domestic M&HCV volume growth on the back of
higher GDP growth and higher infra spending in FY18E. It also expects higher
growth in LCV business.
It has indicated that vehicles with iEGR engines have seen positive response.
The iEGR enabled vehicles are better and ~20K-30K cheaper than SCR
engine enabled vehicles.
While company took multiple price hikes in this calendar year, ALL has
indicated that it may take further price hikes to offset increase in the input
prices. It is taking another 1% hike from August-17.
FY17E Capex unchanged at `500cr
Company’s market share increased to 34.7% in 1QFY18.
Due to higher RM prices, company reported decline in the operating margins.
July 25, 2017
4
Ashok Leyland | 1QFY2018 Result Update
Investment arguments
Volumes recovery in FY18E: While ALL reported weak set of numbers in 1QFY18,
the first two months of the quarter cumulatively saw 19.4% yoy decline in the
volumes due to the BSIV transition. In the June-17, company saw 11% growth in
the revenues. ALL further expects the higher volume growth in the remainder of the
year. It also expects to launch new LCV every quarter in FY18E which will also help
in higher sales. ALL has a market share of 34.7% in the 1QFY18 and expects to do
well going ahead with its new technology iEGR.
Pure CV play: ALL is a pure CV play and is expected to benefit from government’s
push to improve infrastructure. The MHCV segment, accounts for 3/4th of ALLs total
volumes and has grown at a 3 year CAGR of 11% by FY16. We expect the
momentum to continue, in FY18E and FY19E as economic outlook improves.
Return ratio to improve: ALL has taken 4% price hike in January, 7-10% hike in
April-17 (owing to the BSIV transition) and has taken another hike in 1QFY18 to
offset higher input prices. We expect ALL’s margins to remain at the current levels
for new two years (>10%). This level of margins is significantly higher than the
margins seen during FY12-FY15 when automobile industry was going through a
period of slower growth. Owing to this, company is expected to see improvement
in RoE profile. We expect ALL’s average RoE to remain at ~21.8% over next two
years indicating strong improvement in return ratios.
Outlook and valuation
We expect company to report CAGR of 11%/17% in the volumes/revenue over next
two years. We maintain our Buy on the stock with a price target of `124 - 20x of
FY2019E EPS `6.2 (10.8x FY2019E EV/EBITDA multiple).
Exhibit 9: Key assumptions
(units)
FY2014
FY2015
FY2016
FY2017
FY2018E
FY2019E
MH&CV
60,342
77,660
109,762
113,295
118,890
133,162
LCV
28,995
27,242
30,695
31,770
38,428
46,119
Total volume (units)
89,337
104,902
140,457
145,065
157,318
179,281
% yoy chg
(22.1)
17.4
33.9
3.3
8.4
14.0
Source: Company, Angel Research
Company background
Ashok Leyland Ltd (ALL) is the country's second largest CV manufacturer. The
company has a strong presence in the MHCV segment, with a domestic market
share of ~35% as of 1QFY2018. ALL enjoys a dominant position in southern
India, and has been focusing on expanding its presence in northern and western
India by increasing its touch points in the region. The company intends to increase
its market share in trucks by launching new products under Guru and Partner
range. It also has increased focus on exports and LCV business.
July 25, 2017
5
Ashok Leyland | 1QFY2018 Result Update
Profit and loss statement (Standalone)
Y/E March (` cr)
FY2016
FY2017
2018E
2019E
Total operating income
18,937
20,019
23,339
27,240
% chg
39.6
5.7
16.6
16.7
Total Expenditure
16,683
17,816
20,972
24,287
Cost of Materials
13,195
13,957
16,530
19,602
Personnel
1,385
1,531
1,789
1,689
Others Expenses
2,103
2,328
2,653
2,996
EBITDA
2,255
2,203
2,367
2,953
% chg
119.6
(2.3)
7.5
24.8
(% of Net Sales)
11.9
11.0
10.1
10.8
Depreciation& Amortisation
488
518
519
515
EBIT
1,767
1,685
1,848
2,437
% chg
189.5
(4.6)
9.7
31.9
(% of Net Sales)
9.3
8.4
7.9
8.9
Interest & other Charges
248
155
135
106
Other Income
118
136
201
232
(% of PBT)
7.2
8.2
10.5
9.0
Share in profit of Ass.
-
-
-
-
Recurring PBT
1,637
1,666
1,914
2,563
% chg
379.6
1.8
14.9
33.9
Prior Period & Extra. Exp.
810
335
-
-
PBT (reported)
827
1,330
1,914
2,563
Tax
437
107
553
743
(% of PBT)
52.9
8.0
28.9
29.0
PAT (reported)
390
1,223
1,360
1,819
Add: Share of earnings of ass.
-
-
-
-
Less: Minority interest (MI)
-
-
-
-
PAT after MI (reported)
390
1,223
1,360
1,819
ADJ. PAT
1,200
1,559
1,360
1,819
% chg
16.4
213.9
11.2
33.7
(% of Net Sales)
6.3
7.8
5.8
6.7
Basic EPS (`)
1.4
4.3
4.6
6.2
Fully Diluted EPS (`)
1.4
4.3
4.6
6.2
% chg
16.4
213.9
11.2
33.7
July 25, 2017
6
Ashok Leyland | 1QFY2018 Result Update
Balance sheet statement (Standalone)
Y/E March (` cr)
FY2016
FY2017
2018E
2019E
SOURCES OF FUNDS
Equity Share Capital
285
285
293
293
Reserves& Surplus
5,123
5,842
6,522
7,431
Shareholders Funds
5,407
6,126
6,814
7,724
Minority Interest
Total Loans
2,415
2,145
1,745
1,345
Other liabilities
326
219
163
191
Deferred Tax Liability
753
741
741
741
Total Liabilities
8,901
9,231
9,464
10,001
APPLICATION OF FUNDS
Gross Block
5,279
5,858
6,441
7,122
Less: Acc. Depreciation
487
887
1,402
1,972
Net Block
4,792
4,971
5,039
5,150
Capital Work-in-Progress
76
206
40
40
Investments
1,980
2,879
2,100
2,200
Current Assets
5,925
5,744
7,214
8,460
Inventories
1,625
2,501
2,686
3,134
Sundry Debtors
1,251
860
1,599
1,866
Cash
1,593
912
736
899
Loans & Advances
712
709
910
1,062
Other Assets
745
762
1,284
1,498
Current liabilities
4,296
5,183
5,543
6,464
Net Current Assets
1,629
561
1,671
1,996
Deferred Tax Asset
424
614
614
614
Mis. Exp. not written off
-
-
-
-
Total Assets
8,901
9,231
9,464
10,001
July 25, 2017
7
Ashok Leyland | 1QFY2018 Result Update
Cash flow statement (Standalone)
Y/E March (` cr)
FY2016
FY2017
2018E
2019E
Profit before tax
390
1,223
1,914
2,563
Depreciation
488
518
515
570
Change in Working Capital
(179)
190
(763)
52
Interest / Dividend (Net)
203
88
135
106
Direct taxes paid
(441)
(348)
(553)
(743)
Others
1,223
484
-
-
Cash Flow from Operations
1,683
2,155
1,248
2,548
(Inc.)/ Dec. in Fixed Assets
(170)
(378)
(418)
(681)
(Inc.)/ Dec. in Investments
534
(1,099)
257
(315)
Cash Flow from Investing
364
(1,477)
(161)
(996)
Issue of Equity
-
-
-
-
Inc./(Dec.) in loans
(783)
(870)
(448)
(373)
Dividend Paid (Incl. Tax)
(154)
(325)
(680)
(910)
Interest / Dividend (Net)
(268)
(164)
(135)
(106)
Cash Flow from Financing
(1,205)
(1,359)
(1,263)
(1,389)
Inc./(Dec.) in Cash
842
(681)
(176)
164
Opening Cash balances
751
1,593
912
736
Closing Cash balances
1,593
912
736
899
July 25, 2017
8
Ashok Leyland | 1QFY2018 Result Update
Key ratios
Y/E March
FY2016
FY2017
2018E
2019E
Valuation Ratio (x)
P/E (on FDEPS)
76.6
24.4
22.6
16.9
P/CEPS
34.0
17.1
16.3
13.1
P/BV
5.7
5.0
4.5
4.0
Dividend yield (%)
0.9
1.5
2.2
3.0
EV/Sales
1.6
1.5
1.3
1.1
EV/EBITDA
13.1
13.2
12.5
9.8
EV / Total Assets
2.2
2.0
2.0
1.8
Per Share Data (`)
EPS (Basic)
1.4
4.3
4.6
6.2
EPS (fully diluted)
1.4
4.3
4.6
6.2
Cash EPS
3.1
6.1
6.4
8.0
DPS
1.0
1.6
2.3
3.1
Book Value
18.5
20.9
23.3
26.4
Returns (%)
ROCE
22.6
20.4
21.6
26.9
Angel ROIC (Pre-tax)
41.6
37.6
32.3
40.8
ROE
7.2
20.0
20.0
23.6
Turnover ratios (x)
Asset Turnover (Gross Block)
3.6
3.4
3.6
3.8
Inventory / Sales (days)
31
46
42
42
Receivables (days)
24
16
25
25
Payables (days)
50
56
50
50
WC cycle (ex-cash) (days)
6
5
17
17
July 25, 2017
9
Ashok Leyland | 1QFY2018 Result Update
Research Team Tel: 022 - 39357800
DISCLAIMER
Angel Broking Private Limited (hereinafter referred to as “Angel”) is a registered Member of National Stock Exchange of India Limited,
Bombay Stock Exchange Limited and Metropolitan Stock Exchange of India Limited. It is also registered as a Depository Participant with
CDSL and Portfolio Manager with SEBI. It also has registration with AMFI as a Mutual Fund Distributor. Angel Broking Private Limited is
a registered entity with SEBI for Research Analyst in terms of SEBI (Research Analyst) Regulations, 2014 vide registration number
INH000000164. Angel or its associates has not been debarred/ suspended by SEBI or any other regulatory authority for accessing
/dealing in securities Market. Angel or its associates including its relatives/analyst do not hold any financial interest/beneficial
ownership of more than 1% in the company covered by Analyst. Angel or its associates/analyst has not received any compensation /
managed or co-managed public offering of securities of the company covered by Analyst during the past twelve months. Angel/analyst
has not served as an officer, director or employee of company covered by Analyst and has not been engaged in market making activity
of the company covered by Analyst.
This document is solely for the personal information of the recipient, and must not be singularly used as the basis of any investment
decision. Nothing in this document should be construed as investment or financial advice. Each recipient of this document should
make such investigations as they deem necessary to arrive at an independent evaluation of an investment in the securities of the
companies referred to in this document (including the merits and risks involved), and should consult their own advisors to determine
the merits and risks of such an investment.
Reports based on technical and derivative analysis center on studying charts of a stock's price movement, outstanding positions and
trading volume, as opposed to focusing on a company's fundamentals and, as such, may not match with a report on a company's
fundamentals.
The information in this document has been printed on the basis of publicly available information, internal data and other reliable
sources believed to be true, but we do not represent that it is accurate or complete and it should not be relied on as such, as this
document is for general guidance only. Angel Broking Pvt. Limited or any of its affiliates/ group companies shall not be in any way
responsible for any loss or damage that may arise to any person from any inadvertent error in the information contained in this report.
Angel Broking Pvt. Limited has not independently verified all the information contained within this document. Accordingly, we cannot
testify, nor make any representation or warranty, express or implied, to the accuracy, contents or data contained within this document.
While Angel Broking Pvt. Limited endeavors to update on a reasonable basis the information discussed in this material, there may be
regulatory, compliance, or other reasons that prevent us from doing so.
This document is being supplied to you solely for your information, and its contents, information or data may not be reproduced,
redistributed or passed on, directly or indirectly.
Neither Angel Broking Pvt. Limited, nor its directors, employees or affiliates shall be liable for any loss or damage that may arise from
or in connection with the use of this information.
Note: Please refer to the important ‘Stock Holding Disclosure' report on the Angel website (Research Section). Also, please refer to the
latest update on respective stocks for the disclosure status in respect of those stocks. Angel Broking Pvt. Limited and its affiliates may
have investment positions in the stocks recommended in this report.
Disclosure of Interest Statement
Ashok Leyland
1. Analyst ownership of the stock
No
2. Angel and its Group companies ownership of the stock
No
3. Angel and its Group companies' Directors ownership of the stock
No
4. Broking relationship with company covered
No
Note: We have not considered any Exposure below ` 1 lakh for Angel, its Group companies and Directors
Ratings (Based on expected returns
Buy (> 15%)
Accumulate (5% to 15%)
Neutral (-5 to 5%)
over 12 months investment period):
Reduce (-5% to -15%)
Sell (< -15)
July 25, 2017
10