Angel Top Picks - September 2017
After the geopolitical tensions have cooled off, Indian markets have regained
Top Picks
the growth momentum with the both Sensex and Nifty trading near its peak
Company
CMP (`)
TP (`)
levels. Macros have continued to improve while foreign trade is showing
Banking/NBFC
signs of recovery. Indian markets are currently trading slightly at premium to
Dewan Housing
549
610
its 10 year average, however with double digit corporate earnings growth
GIC Housing Finance
534
655
and surging domestic equity inflows, market is expected continue its upward
Karur Vysa Bank
147
180
trajectory.
Consumption
Domestic inflows continue to remain strong: With another cut in the repo rate,
Asian Granito
448
493
fixed income has continued to lose sheen compared to the equities. The domestic
Blue Star
792
850
mutual fund inflows for August-17 were at `20,935cr while the same for the April-
Siyaram Silk Mills
2,267
2,500
August 2017 period is at `61,421cr vs. `18,490cr during same period last fiscal.
Media/Automobiles
The domestic inflows have continued to rise faster than the foreign inflows in FY18
Maruti Suzuki
8,145
8,658
too. With the inflation remaining soft, repo rates could get slashed further meaning
Music Broadcast
385
434
that equities are expected to remain an attractive asset class and hence domestic
TV Today
271
344
MF inflows are expected to rise higher.
Real Estate/Infra/Logistics/Power
KEI Industries
325
371
Foreign trade shows signs of recovery: India’s exports remained sluggish for the
Navkar Corp.
194
265
period of FY13-FY16; however since FY17, exports are showing signs of recovery.
Pharma
In FY17, our exports grew by 5.2% YoY to $276bn while for 4MFY18; exports grew
Alkem Labs
1,808
2,161
by 7.9% YoY to $94.6bn indicating that growth in exports has been sustainable.
Source: Angel Research;
Due to the rupee depreciation, this growth is 4.8% YoY in rupee terms. Imports too
Note: CMP as of September 11, 2017
had been sluggish for last many years however there are signs of recovery with
imports, in dollar terms, going up by 28.3% YoY in 4MFY18 and by 23.4% in
rupee terms. We believe this is a sign of recovery in the foreign trade with imports
indicating resilience in the consumption sector and exports indicating the
improving global demand.
Nifty scales 10000 level again: Indian equities have continued to remain buoyant
in FY18 with 8% returns so far. In August -17, markets turned slightly volatile due
to local and global geopolitical issues, however with the tensions easing, the
markets have come out of the hangover and have regained the peaks established
a few days back (Sensex 32,000 and Nifty 10,000). Domestic equities are now
valued at 18.5x its 1year forward earnings which is about 7% premium to its ten
year average. However double digit earnings growth and higher domestic
inflows aided by lower interest rate regime continue to support the valuations.
We believe that upward trajectory of the domestic markets will be maintained. We
like stocks like Maruti Suzuki, Asian Granito and Blue Star from consumption
sector as well as Music Broadcast (Media), Karur Vysa Bank (Banking),
Navkar Corp, KEI Industries and Siyaram Silk Mills from other sectors. We
add GIC Housing Finance in the Top Picks Portfolio over its strong earning
visibility and NIM improvement.
Please refer to important disclosures at the end of this report
1
Top Picks Report | September 2017
Top Picks
September 12, 2017
2
Top Picks Report | September 2017
Stock Info
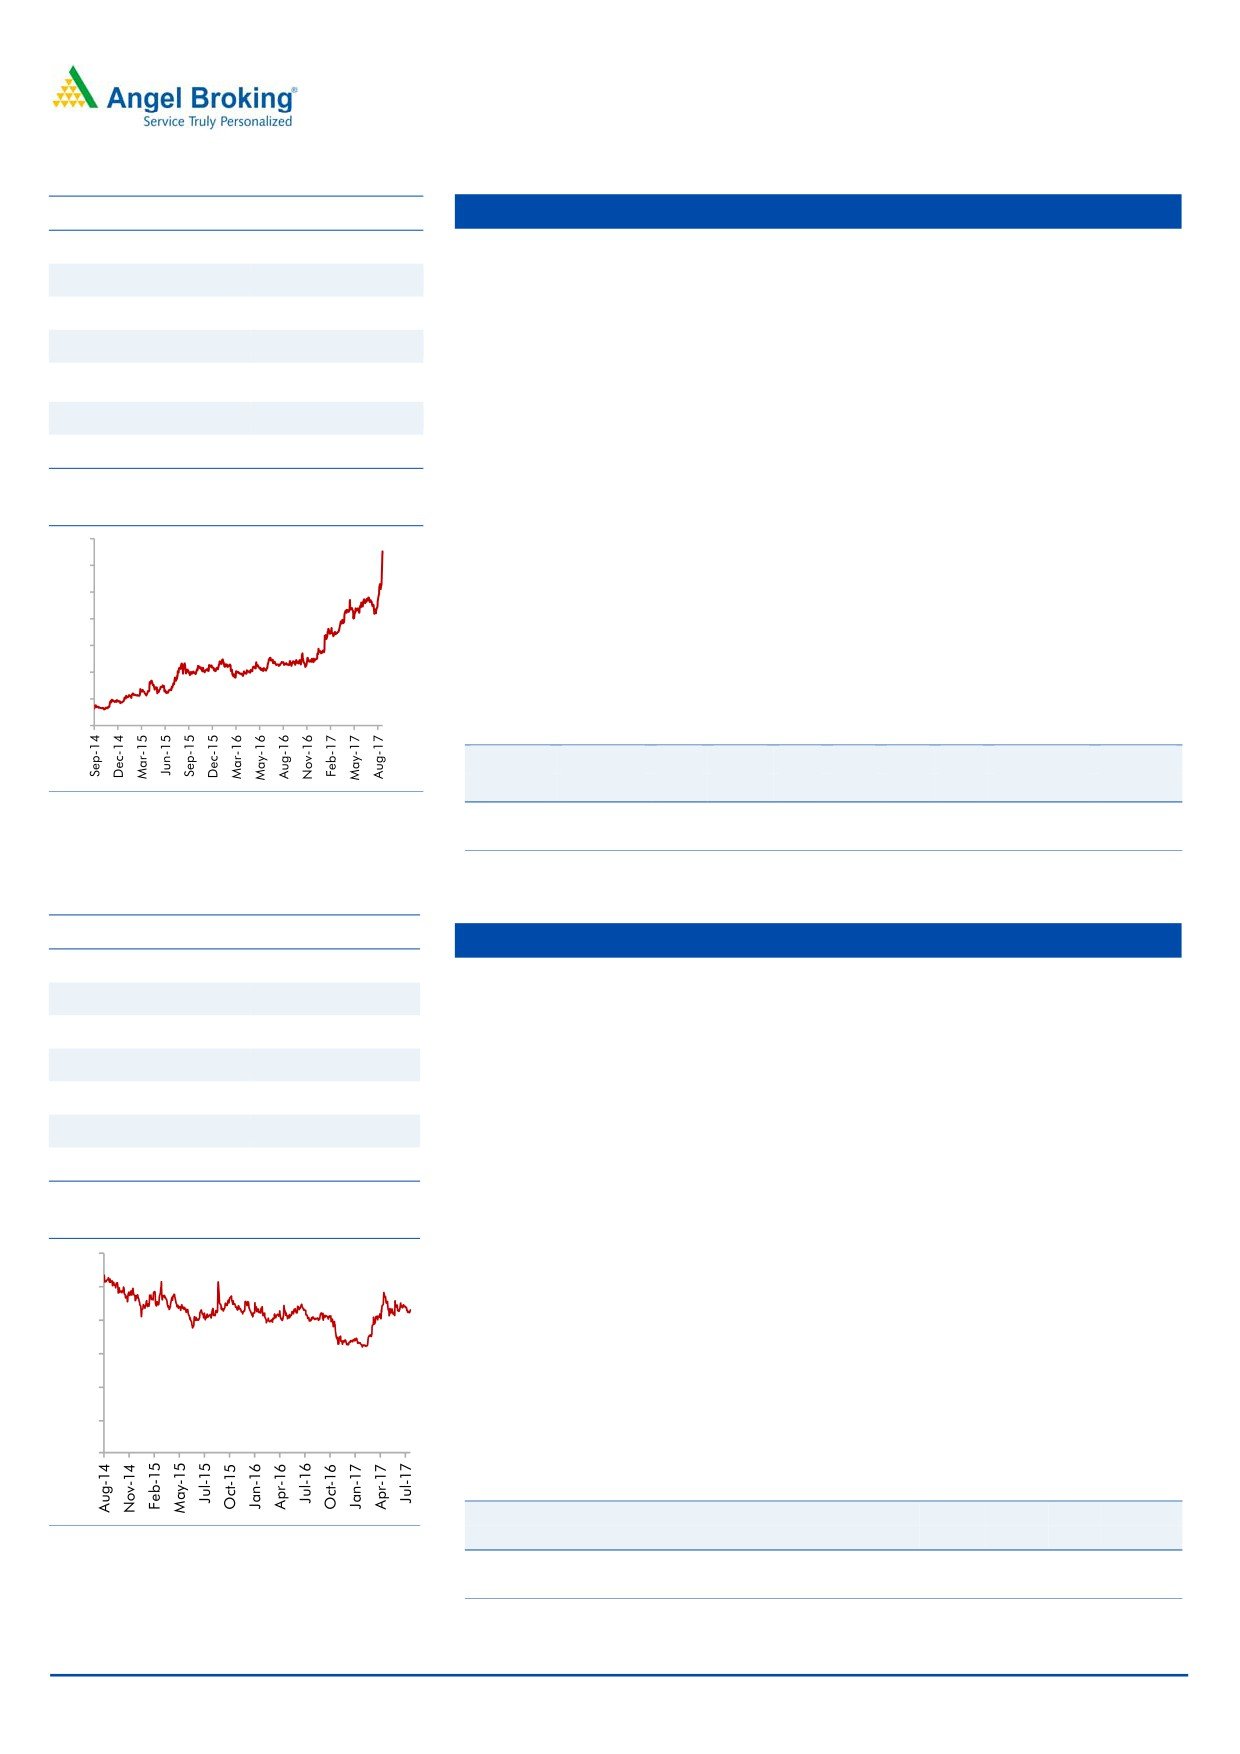
Dewan Housing
CMP
549
Loan growth to remain strong going ahead: Backed by healthy capital
TP
610
adequacy and increasing demand for home loans DHFL’s loan book is
Upside
10.9%
expected to report 23% loan growth over next two three years.
Sector
Financials
Strong Capital adequacy lends visibility for growth: DHFL sold 50% stake held
Market Cap (` cr)
17,498
by it in DFHFL Pramerica Life Insurance Co Ltd which added `1,969 cr to its
Beta
1.9
net worth and increases its CAR by 400 bps, to 19.3% which should fuel
52 Week High / Low
563 / 214
growth for next 2-3 years.
Asset quality has been strong: Strong NIM on the back of lower cost of funds
3 year-Chart
and lower credit cost will ensure healthy return ratios for the company. Despite
600
strong growth the company has maintained stable asset quality and we expect
500
the trend to continue.
400
Outlook: We expect the company’s loan growth to remain 23% over next two
300
years and earnings growth is likely to be more than 28%.The stock currently
trades at 1.8x FY2018E ABV. We maintain an Accumulate rating on the stock,
200
with a target price of `610.
100
-
Key Financials
Y/E
Op. Inc NIM
PAT
EPS
ABV ROA ROE P/E P/ABV
March
(` cr)
(%)
(` cr)
(`)
(`)
(%)
(%)
(x)
(x)
Source: Company, Angel Research
FY2018E
2,279
2.4
1,171
37.4
268
1.3
13.8
12.2
2.1
FY2019E
2,927
2.7
1,556
49.7
305
1.5
16.2
9.2
1.8
Source: Company, Angel Research
Stock Info
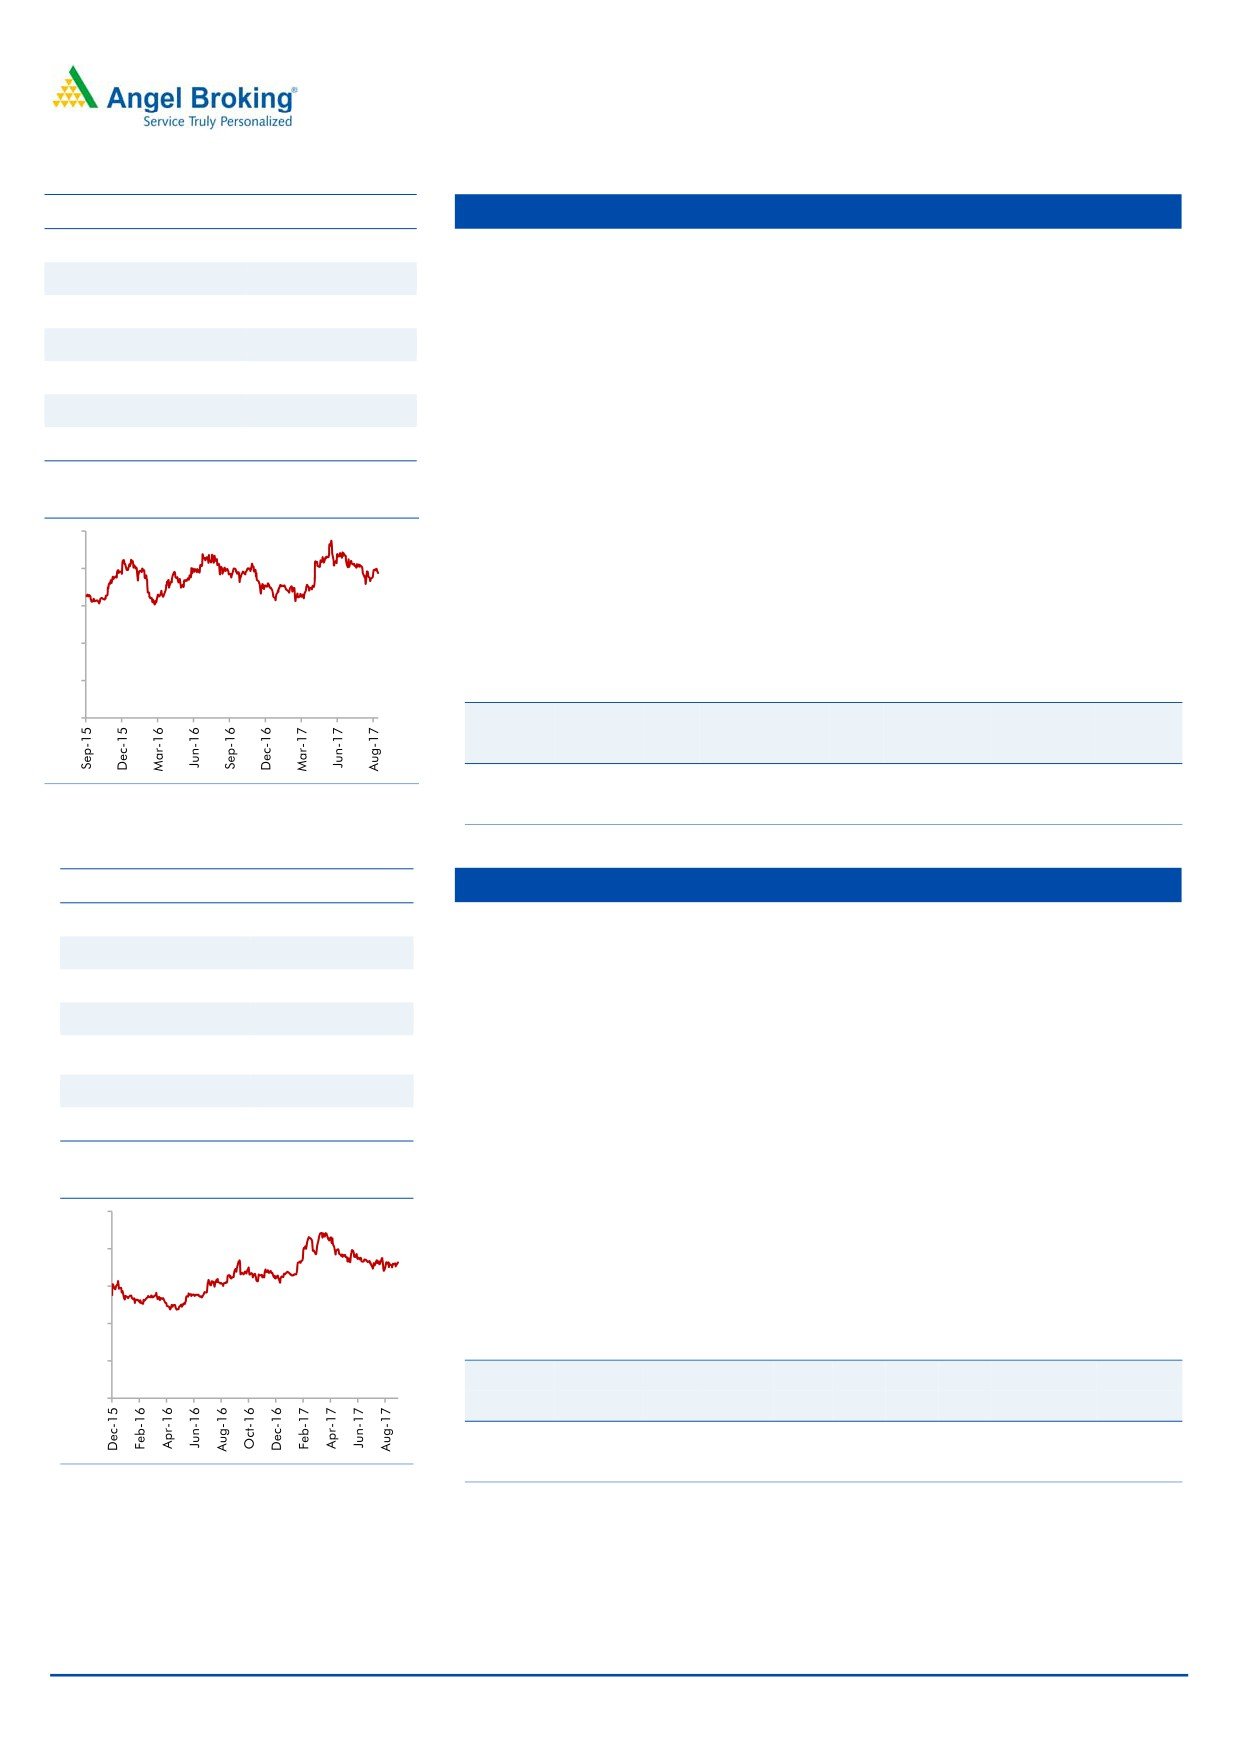
Karur Vysa Bank
CMP
147
Loan growth to pick up from FY18 onwards: KVB had a fairly strong loan
TP
180
CAGR of 14.9% over FY11-17.However, FY17 was year of consolidation and
Upside
22.4%
loan book grew by only 4.7%. We expect loan growth to pick up to 11%
Sector
Banking
over FY17-19. Deposit growth is expected at 9% during the period.
Market Cap (` cr)
8,256
Asset quality likely to stabilize going ahead: KVB’s slippages remained high
during FY17 and hence GNPAs % went up to 3.58% vs 1.3%. However, large
Beta
1.4
part of the troubled accounts has been classified as NPAs and hence gradually
52 Week High / Low
153 / 80
we expect the asset quality to improve. While in Q1FY18 we saw some
pressure on asset quality, it still remained fairly under control.
3 year-Chart
NIM likely to see further improvement: There were 25 bps improvements in
160
NIM during FY17, with share of CASA growing and cost of fund coming
140
down NIM is expected to improve further going ahead.
120
100
Outlook: We expect KVB to post a strong loan book & earnings CAGR of
80
11%& 22% over FY2017-19E. The stock currently trades at 1.7x FY2019E ABV.
60
We have a BUY rating on the stock, with a target price of `180.
40
20
Key Financials
-
Y/E
Op. Inc NIM
PAT
EPS
ABV ROA ROE P/E P/ABV
March
(` cr)
(%)
(` cr)
(`)
(`)
(%)
(%)
(x)
(x)
FY2018E
3,289
3.7
660
10.8
75.0
1.0
12.5
12.9
2.0
Source: Company, Angel Research
FY2019E
3,630
3.9
858
14.1
85.7
1.2
14.7
9.9
1.7
Source: Company, Angel Research
September 12, 2017
3
Top Picks Report | September 2017
Asian Granito
Stock Info
CMP
448
AGIL’s current, vitrified sales (35%) are lower as compared to its peers like
Somany Ceramics (47%) and Kajaria Ceramics (61%). Recently, AGIL has
TP
493
launched various products in premium segment. Going forward, we expect
Upside
10%
AGIL’s profit margin to improve due to increase in focus for higher vitrified
Sector
Cons. Durable
product sales, which is a high margin business.
Market Cap (` cr)
1,368
AGIL is continuously putting efforts to increase the B2C sales from the current
Beta
1.9
level (35-36% in FY17). It is expected to reach up to 50% in next 2-3 years on
52 Week High / Low
471 / 175
the back of various initiatives taken by AGIL to increase direct interaction with
customers like strengthening distribution network, participation in key trade
exhibition, etc.
3 year-Chart
In July FY2016, AGIL acquired Artistique Ceramic which has a better margin
500
profile. Going forward, we expect the company to improve its operating
400
margin from 7.5% in FY16 (excluding merger) to 12-12.5% in coming
300
financial year. Artisique Ceramics has a contract with RAS GAS to supply
200
quality natural gas at a discounted rate of 50% to current market rate, which
would reduce the overall power & fuel cost of the company.
100
We expect AGIL to report a net revenue CAGR of ~8.5% to ~`1,286cr and
-
net profit CAGR of ~23% to `59cr over FY2017-19E. We have an accumulate
rating on the stock.
Key Financials
Source: Company, Angel Research
Y/E
Sales OPM PAT EPS ROE P/E P/BV EV/EBITDA EV/Sales
March
(` cr)
(%)
(` cr)
(`)
(%)
(x)
(x)
(x)
(x)
FY2018E
1,169
12.5
48
16.0
10.7
28.0
3.0
11.1
1.4
FY2019E
1,286
12.5
59
19.7
10.7
22.7
2.7
9.8
1.2
Source: Company, Angel Research
Blue Star
Stock Info
BSL is one of the largest air-conditioning companies in India. With a mere
CMP
792
3% penetration level of ACs vs 25% in China, the overall outlook for the room
TP
850
air-conditioner (RAC) market in India is favourable.
Upside
8%
BSL’s RAC business has been outgrowing the industry by ~10% points over the
Sector
Cons. Durable
last few quarters, resulting in the company consistently increasing its market
share (~7% in FY2014 to 10.5% at present). This has resulted in the Cooling
Market Cap (` cr)
7,588
Products Division (CPD)'s share in overall revenues increasing from~23% in
Beta
0.8
FY2010 to ~42% in FY2016 (expected to improve to ~47% in FY2018E). With
52 Week High / Low
813 / 435
strong brand equity and higher share in split ACs, we expect the CPD to
continue to drive growth.
3 year-Chart
Aided by increasing contribution from the CPD, we expect the overall top-line
900
to post a revenue CAGR of ~16% over FY2016-18E and margins to improve
800
from 5.3% in FY2015 to 7.3% in FY2018E. We recommend an accumulate
700
rating on the stock.
600
500
Key Financials
400
300
Y/E
Sales OPM PAT EPS ROE P/E P/BV EV/EBITDA EV/Sales
200
March
(` cr)
(%)
(` cr)
(`)
(%)
(x)
(x)
(x)
(x)
100
-
FY2017
4,283
5.9
141
14.9
20.4
44.3
9.4
26.3
1.5
FY2018E
5,077
7.3
211
22.1
26.4
29.8
8.6
19.9
1.3
Source: Company, Angel Research
Source: Company, Angel Research
September 12, 2017
4
Top Picks Report | September 2017
Stock Info
Siyaram Silk Mills
CMP
2,267
SSML has strong brands which cater to premium as well as popular mass
TP
2,500
segments of the market. Further, SSML entered the ladies' salwar kameez and
Upside
10%
ethnic wear segment. Going forward, we believe that the company would be able to
Sector
Textile
leverage its brand equity and continue to post strong performance.
Market Cap (` cr)
2,210
The company has a nationwide network of about 1,600 dealers and business
partners. It has a retail network of 160 stores and plans to add another
Beta
0.9
300-350 stores going forward. Further, the company's brands are sold across
52 Week High / Low
2,499/1,135
3,00,000 multi brand outlets in the country.
Going forward, we expect SSML to report a net sales CAGR of ~12% to
3 year-Chart
~`1,981cr and adj.net profit CAGR of ~16% to `123cr over FY2017-19E on
3,000
back of market leadership in blended fabrics, strong brand building, wide
2,500
distribution channel, strong presence in tier II and tier III cities and emphasis
2,000
on latest designs and affordable pricing points. At the current market price,
1,500
SSML trades at an inexpensive valuation. We have an accumulate rating on
the stock.
1,000
500
Key Financials
-
Y/E
Sales
OPM PAT EPS ROE P/E P/BV EV/EBITDA EV/Sales
March
(` cr)
(%)
(` cr)
(`)
(%)
(x)
(x)
(x)
(x)
FY2018E
1,769
12.7
106
113.1
15.4
20.1
3.1
10.8
1.4
Source: Company, Angel Research
FY2019E
1,981
12.7
123
131.1
15.5
17.3
2.7
9.4
1.2
Source: Company, Angel Research
Stock Info
Maruti Suzuki
CMP
8,145
The Automobile sector is expected to benefit from the GST implementation.
TP
8,658
The sector has seen a pick up in the volumes in FY17 as there were several
Upside
6.3 %
positive factors like normal monsoon and lower interest rates.
Sector
Automobiles
Maruti Suzuki continues to hold ~50% market share in the passenger vehicles.
Market Cap (` cr)
2,46,044
The launch of exciting models has helped the company to ride on the
premiumization wave that is happening in the country. In the last two years,
Beta
1.3
company has seen improvement in the business mix with the pie of the utility
52 Week High / Low
8,200/4,769
vehicles growing from ~4% to current 15%. With the 3-4 months of waiting
period on these models, strong demand and GST led price decrease; we
3 year-Chart
believe that this pie is expected to grow to ~20% in FY19E.
9,000
Due to the favorable business mix, company has also been seeing
8,000
7,000
improvement in the margins. Company has already moved from ~11-12%
6,000
EBITDA margin range to current ~14-15% margin ranges. Together with
5,000
higher operating leverage at Gujarat plant and improving business mix, we
4,000
3,000
believe that company has further room to improve its margins. We have an
2,000
accumulate rating on the stock.
1,000
-
Key Financials
Y/E
Sales
OPM PAT EPS ROE P/E P/BV EV/EBITDA EV/Sales
March
(` cr)
(%)
(` cr)
(`)
(%)
(x)
(x)
(x)
(x)
Source: Company, Angel Research
FY2018E
81,888
15.2
8,653
286.5
22.0
28.4
6.3
17.6
2.7
FY2019E
101,345
15.2
10,895 360.8
22.6
22.6
5.1
13.6
2.1
Source: Company, Angel Research
September 12, 2017
5
Top Picks Report | September 2017
Stock Info
TV Today Network
CMP
271
TTNL enjoys a strong viewership ranking in the Hindi and English news
TP
344
channel categories. The company’s Hindi news channel - Aaj Tak has
Upside
27%
maintained its market leadership position occupying the No.1 rank for several
Sector
Media
consecutive years in terms of viewership. Its English news channel - India
Today too has been continuously gaining viewership; it has now captured the
Market Cap (` cr)
1,615
No. 2 ranking from No. 4 earlier. Its other channels like Dilli Aaj Tak and Tez
Beta
0.7
are also popular among viewers.
52 Week High / Low
360 /248
Out of the 7 radio stations, TTNL has sold off 4 (Jodhpur, Amritsar, Patiala
and Shimla) for `4cr. The remaining 3 stations are in the process of getting
3 year-Chart
sold off to ENIL but the sale will have to wait until concerns raised by the MIB
400
are resolved. Going forward, we expect them to be sold off and this would
350
prop up the company’s profitability.
300
250
We expect TTNL to report a net revenue CAGR of ~9% to ~`727cr and net
200
profit CAGR of
~13% to
`121cr over FY2017-19E. We have a Buy
150
recommendation on the stock and target price of `344.
100
50
Key Financials
-
Y/E
Sales
OPM PAT EPS ROE P/E P/BV EV/EBITDA EV/Sales
March
(` cr)
(%)
(` cr)
(`)
(%)
(x)
(x)
(x)
(x)
FY2018E
667
23.1
111
18.6
15.6
14.6
2.3
6.9
2.0
Source: Company, Angel Research
FY2019E
727
23.2
121
20.1
17.3
13.5
2.3
5.9
1.8
Source: Company, Angel Research
Stock Info
Music Broadcast
CMP
385
Radio Industry is protected by licenses for 15 years, thereby restricting the entry
TP
434
of new players. This would support the existing companies to strengthen their
Upside
12.7%
position and maintain a healthy growth rate.
Sector
Media
It has grabbed the Number 1 position in Mumbai, Bengaluru and Delhi in
Market Cap (` cr)
2,200
terms of number of listener. This is helping MBL to charge premium rate,
which resulting into higher EBITDA margin (33.6%) compare to 22% of ENIL.
Beta
0.4
52 Week High / Low
420/332.9
MBL outperformed its closest peer with 18.4% CAGR in revenue over FY2013-
17 (ENIL reported 13.2% CAGR in revenue). On the profitability front too,
MBL, with 32.3% CAGR in PAT over FY2013-17, has performed much better
3 year-Chart
than ENIL (-5.2% CAGR in PAT). Moreover, Radio City posted a six year CAGR
390
380
of 12.1% v/s. 9.1% of industry owing to higher advertising volumes.
370
Capex for 39 licenses have been done for the next 15 years, hence no heavy
360
incremental Capex requirement would emerge. Moreover, the maintenance
350
340
Capex would be as low as `5-10cr. This would leave sufficient cash flow to
330
distribute as dividend. We have a Buy recommendation on the stock and
320
target price of `434.
310
Key Financials
Y/E
Sales
OPM PAT EPS ROE P/E P/BV EV/EBITDA EV/Sales
March
(` cr)
(%)
(` cr)
(`)
(%)
(x)
(x)
(x)
(x)
Source: Company, Angel Research
FY2018E
317
34.4
56
9.8
9.3
39.3
3.6
18.4
6.3
FY2019E
372
34.9
80
14.0
12.0
27.6
3.3
15.0
5.2
Source: Company, Angel Research
September 12, 2017
6
Top Picks Report | September 2017
Stock Info
KEI Industries
CMP
325
KEI’s current order book (OB) stands at `3,233cr (segmental break-up:
TP
371
`2,154cr in EPC, `667cr in Cable, `200cr in EHV, `49cr in Substation, rest in
Upside
14%
EPC L1 business). Its OB grew by ~28% in the last 3 years due to strong order
inflows from State Electricity Boards, Power grid, etc.
Sector
Real Estate
Market Cap (` cr)
2,473
KEI’s consistent effort to increase its retail business from 30-32% of revenue in
FY17 to 40-45% of revenue in the next 2-3 years on the back of strengthening
Beta
0.9
distribution network (currently 926 which is expect to increase `1,500 by FY19)
52 Week High / Low
338 / 99
and higher ad spend (increased from `2cr in FY13 to `7cr in FY16 and
expected to spend).
3 year-Chart
KEI’s export (FY17 - 8-10% of revenue) is expected to reach a level of ~14-
350
15% in next two years with higher order execution from current OB of
300
~`180cr and participation in various international tenders worth `500cr. We
250
expect a strong ~26% growth CAGR over FY2017-19 in exports. We expect
200
KEI to report net revenue CAGR of ~14% to ~`3,392cr and net profit CAGR
150
of ~13% to `125cr over FY2017-19E. Hence we have a Buy rating on the
100
stock.
50
-
Key Financials
Y/E
Sales
OPM PAT EPS ROE P/E P/BV EV/EBITDA EV/Sales
March
(` cr)
(%)
(` cr)
(`)
(%)
(x)
(x)
(x)
(x)
Source: Company, Angel Research
FY2018E
3,001
10.0
100
13.0
18.2
25.0
4.5
10.1
1.0
FY2018E
3,392
10.0
125
16.1
18.7
20.2
3.8
8.9
0.9
Source: Company, Angel Research
Stock Info
GIC Housing Finance Ltd
CMP
534
Backed by the new management, GICHF is aiming for 2.0x growth in the loan
TP
655
book over the period of FY16-FY19E to `16,000cr. GICHF has healthy capital
Upside
23%
adequacy, and is seeing an increase in demand for home loans. GICHF’s
Sector
Financials
loan book is expected to report 24.3% loan growth over next two years.
Market Cap (` cr)
2,871
GICHF is consistently decreasing bank borrowing and increasing high yield
Beta
1.7
loan book which is expected to boost its Net Interest Margin. The share of
bank borrowing was 75% in FY15, which fell to 55% in FY17. In our opinion,
52 Week High / Low
623 /251
the impetus on lower bank borrowings and increasing high yield loan book is
likely to result in 17bps NIM over FY16-FY19E.
3 year-Chart
GICHF’s asset quality is on the higher side compared to other HFCs (As on
600
FY17 GNPA-2.3% and NPA-0.3%). This is primarily due to GICHF has not
500
written off any bad asset and has not sold any bad assets to ARC. New
400
Management is expediting asset quality improvement.
300
We expect the GICHF’s loan growth to grow at a CAGR of 24.3% over next
200
two years and RoA/RoE to improve from 1.7%/19.0% in FY17 to 2.0%/23.0%
100
in FY19E.The stock is currently trading at 2.4x FY2019E ABV. We have a Buy
rating on the stock, with a target price of `655.
-
Key Financials
Y/E
Op. Inc NIM
PAT EPS ABV ROA ROE P/E P/ABV
Source: Company, Angel Research
March
(` cr)
(%)
(` cr)
(`)
(`)
(%)
(%)
(x)
(x)
FY2018E
376
3.6
180
33
184
1.7
20
16
2.9
FY2019E
477
3.7
214
40
218
1.9
23
13
2.4
Source: Company, Angel Research
September 12, 2017
7
Top Picks Report | September 2017
Stock Info
Navkar Corp.
CMP
194
NCL is one of the largest and one of the three CFS at JNPT with rail
TP
265
connectivity, helping it garner high market share at the port. NCL is in a massive
Upside
37%
expansion mode where it is increasing its capacity by 234% to 1,036,889 TEUs
Sector
Logistics
at JNPT and coming up with an ICD at Vapi (with Logistics Park).
Market Cap (` cr)
2,774
The ICD with rail link should benefit from first mover advantage in a region
Beta
0.8
that has huge market potential and accounts for ~27% of volumes at JNPT.
52 Week High / Low
247 / 155
The ICD should be able to capture the EXIM volumes from the region through
rail link that till now was being custom cleared at JNPT (Import) or being
transported via road and consolidated at JNPT (Export). South Gujarat
3 year-Chart
250
volumes will now head straight to the Vapi ICD; thus the company can now
cater to bulk commodities and domestic traffic that it had been rejecting owing
200
to capacity constraints at CFS.
150
We expect NCL to successfully use its rail advantage and scale up its
100
utilizations at both JNPT and Vapi ICD. We have a Buy rating on the stock.
50
Key Financials
-
Y/E
Sales
OPM PAT EPS ROE P/E P/BV EV/EBITDA EV/Sales
March
(` cr)
(%)
(` cr)
(`)
(%)
(x)
(x)
(x)
(x)
FY2018E
561
42.3
164
11.5
10.5
16.9
1.8
13.5
5.6
Source: Company, Angel Research
FY2019E
617
42.3
181
12.7
10.4
15.3
1.6
11.7
4.9
Source: Company, Angel Research
Stock Info
Alkem Leboratories
CMP
1,808
Alkem is 5th largest pharma company is the domestic market and also has
TP
2,161
presence in US. It derives 73% of its revenues come from the Indian markets
Upside
19.5%
while rest come from the other countries. Alkem has leadership position in the
domestic anti infective segment and it is ranked #3 in Gastro-Intestinal and
Sector
Pharmaceutical
Pain/Analgesics segments. Company holds ~3.6% and ~7.9% market share
Market Cap (` cr)
21,621
in the formulations and overall prescriptions in the country.
Beta
0.9
In the domestic market, company operates in acute and chronic segments. It is
52 Week High / Low
2,238 /1,400
a prominent player in acute segment has forayed in chronic segment from
which it expects faster growth. Alkem has been outperforming the domestic
3 year-Chart
industry growth which is likely to continue. Company is focusing on
2,500
monetization of its pipeline (91 ANDAs) in the US with annually ~7-8 ANDAs
launches growing the US revenues by ~26% growth rate from FY17-FY19E.
2,000
Overall outlook remains strong with 15.8% CAGR in the topline and 15.4%
1,500
CAGR in the bottom-line. We have Buy rating on the stock.
1,000
Key Financials
500
Y/E
Sales OPM
PAT EPS ROE P/E P/BV EV/EBITDA EV/Sales
-
March
(` cr)
(%)
(` cr)
(`)
(%)
(x)
(x)
(x)
(x)
FY2018E
6,901
18.4
1,016
85.0
20.2
21.3
4.3
17.0
3.1
FY2019E
7,850
19.1
1,202
100.5
20.1
18.0
3.6
14.3
2.7
Source: Company, Angel Research
Source: Company, Angel Research
September 12, 2017
8
Top Picks Report | September 2017
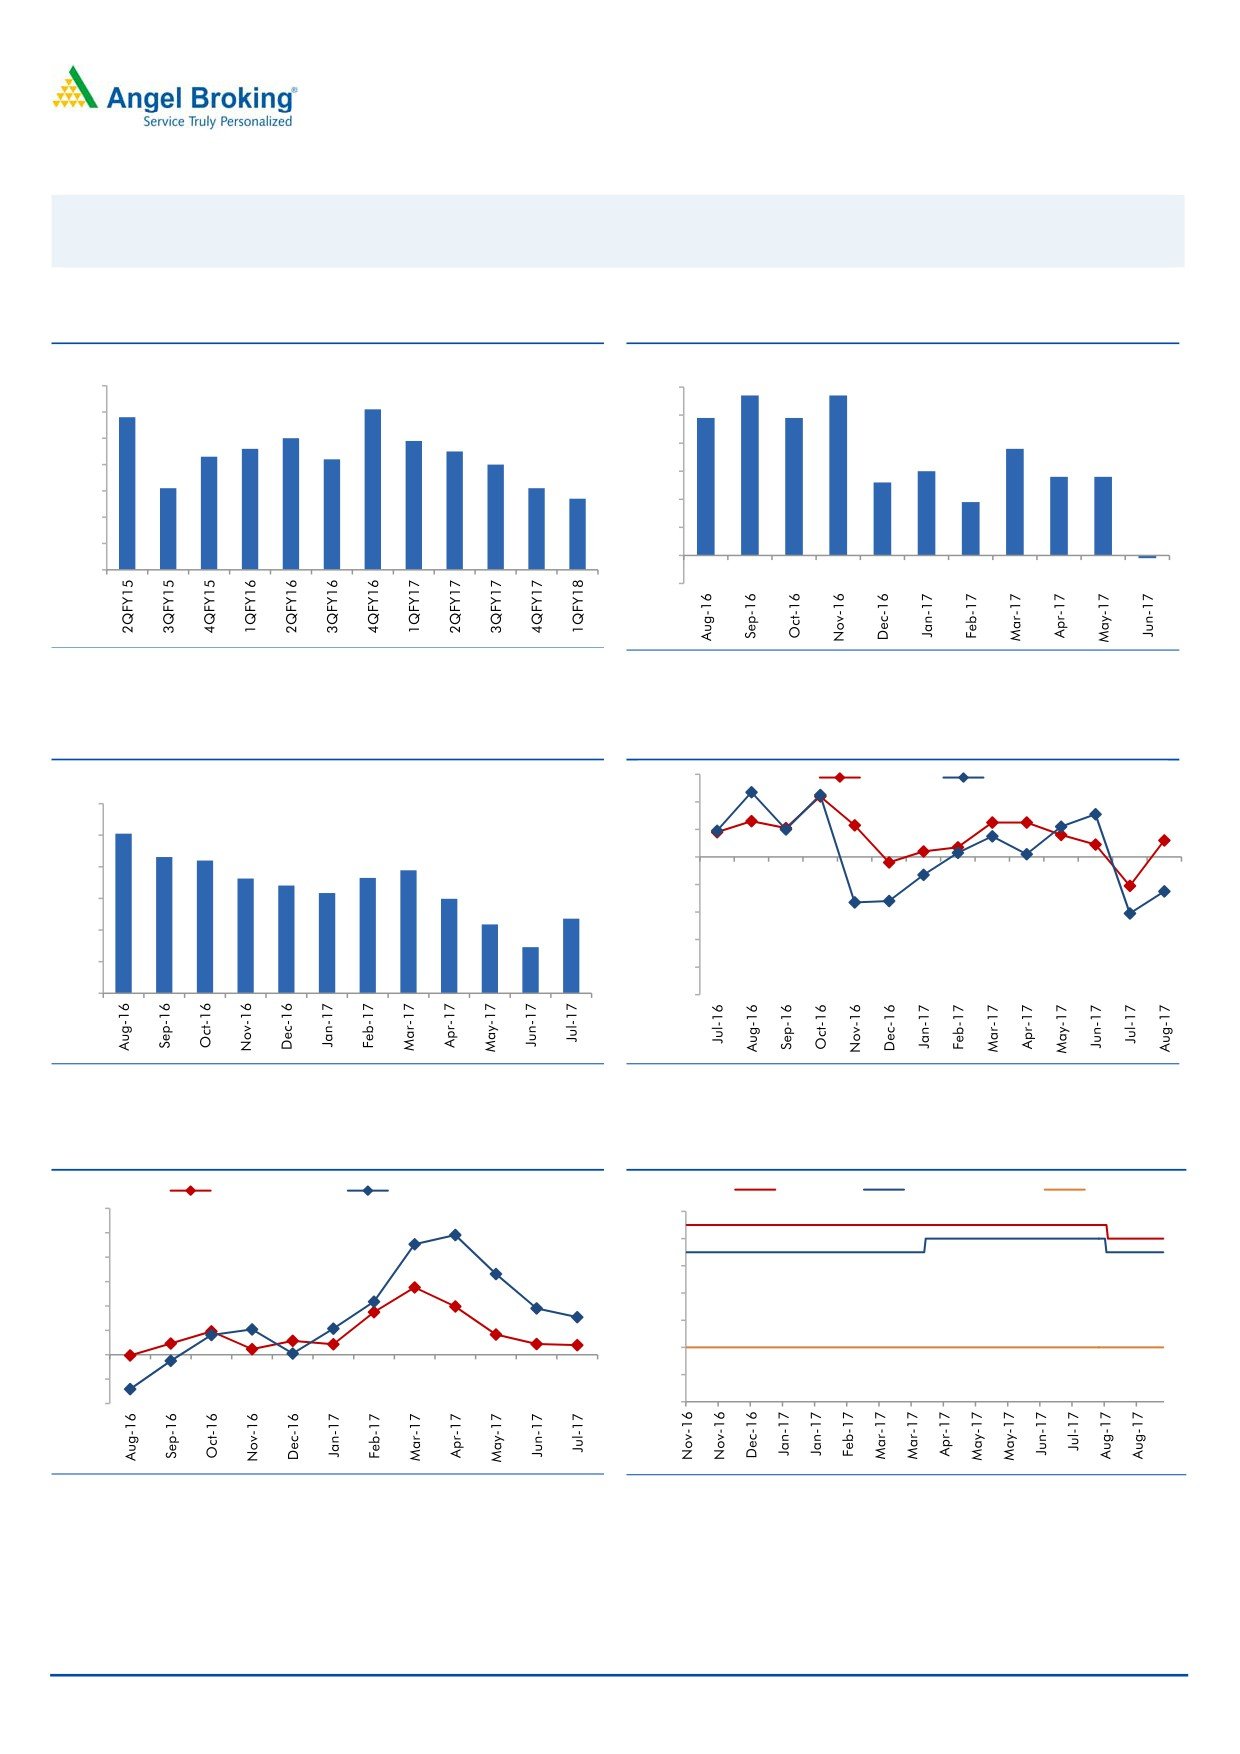
Macro watch
Exhibit 1: Quarterly GDP trends
Exhibit 2: IIP trends
(%)
(%)
5.7
5.7
10.0
6.0
9.1
8.8
4.9
4.9
9.0
5.0
8.0
7.9
7.6
7.5
3.8
8.0
7.3
7.2
4.0
7.0
3.0
2.8
2.8
7.0
2.6
6.1
6.1
3.0
5.7
1.9
6.0
2.0
5.0
1.0
4.0
-
3.0
(0.1)
(1.0)
Source: CSO, Angel Research
Source: MOSPI, Angel Research
Exhibit 3: Monthly CPI inflation trends
Exhibit 4: Manufacturing and services PMI
56.0
Mfg. PMI
Services PMI
(%)
6.0
54.0
5.1
52.0
5.0
4.3
4.2
3.9
50.0
3.6
3.7
4.0
3.4
3.2
3.0
48.0
3.0
2.4
2.2
46.0
2.0
1.5
44.0
1.0
42.0
-
40.0
Source: MOSPI, Angel Research
Source: Market, Angel Research; Note: Level above 50 indicates expansion
Exhibit 5: Exports and imports growth trends
Exhibit 6: Key policy rates
(%)
Exports yoy growth
Imports yoy growth
(%)
Repo rate
Reverse Repo rate
CRR
60.0
6.50
50.0
6.00
40.0
5.50
30.0
5.00
20.0
4.50
10.0
4.00
0.0
(10.0)
3.50
(20.0)
3.00
Source: Bloomberg, Angel Research
Source: RBI, Angel Research
September 12, 2017
9
Top Picks Report | September 2017
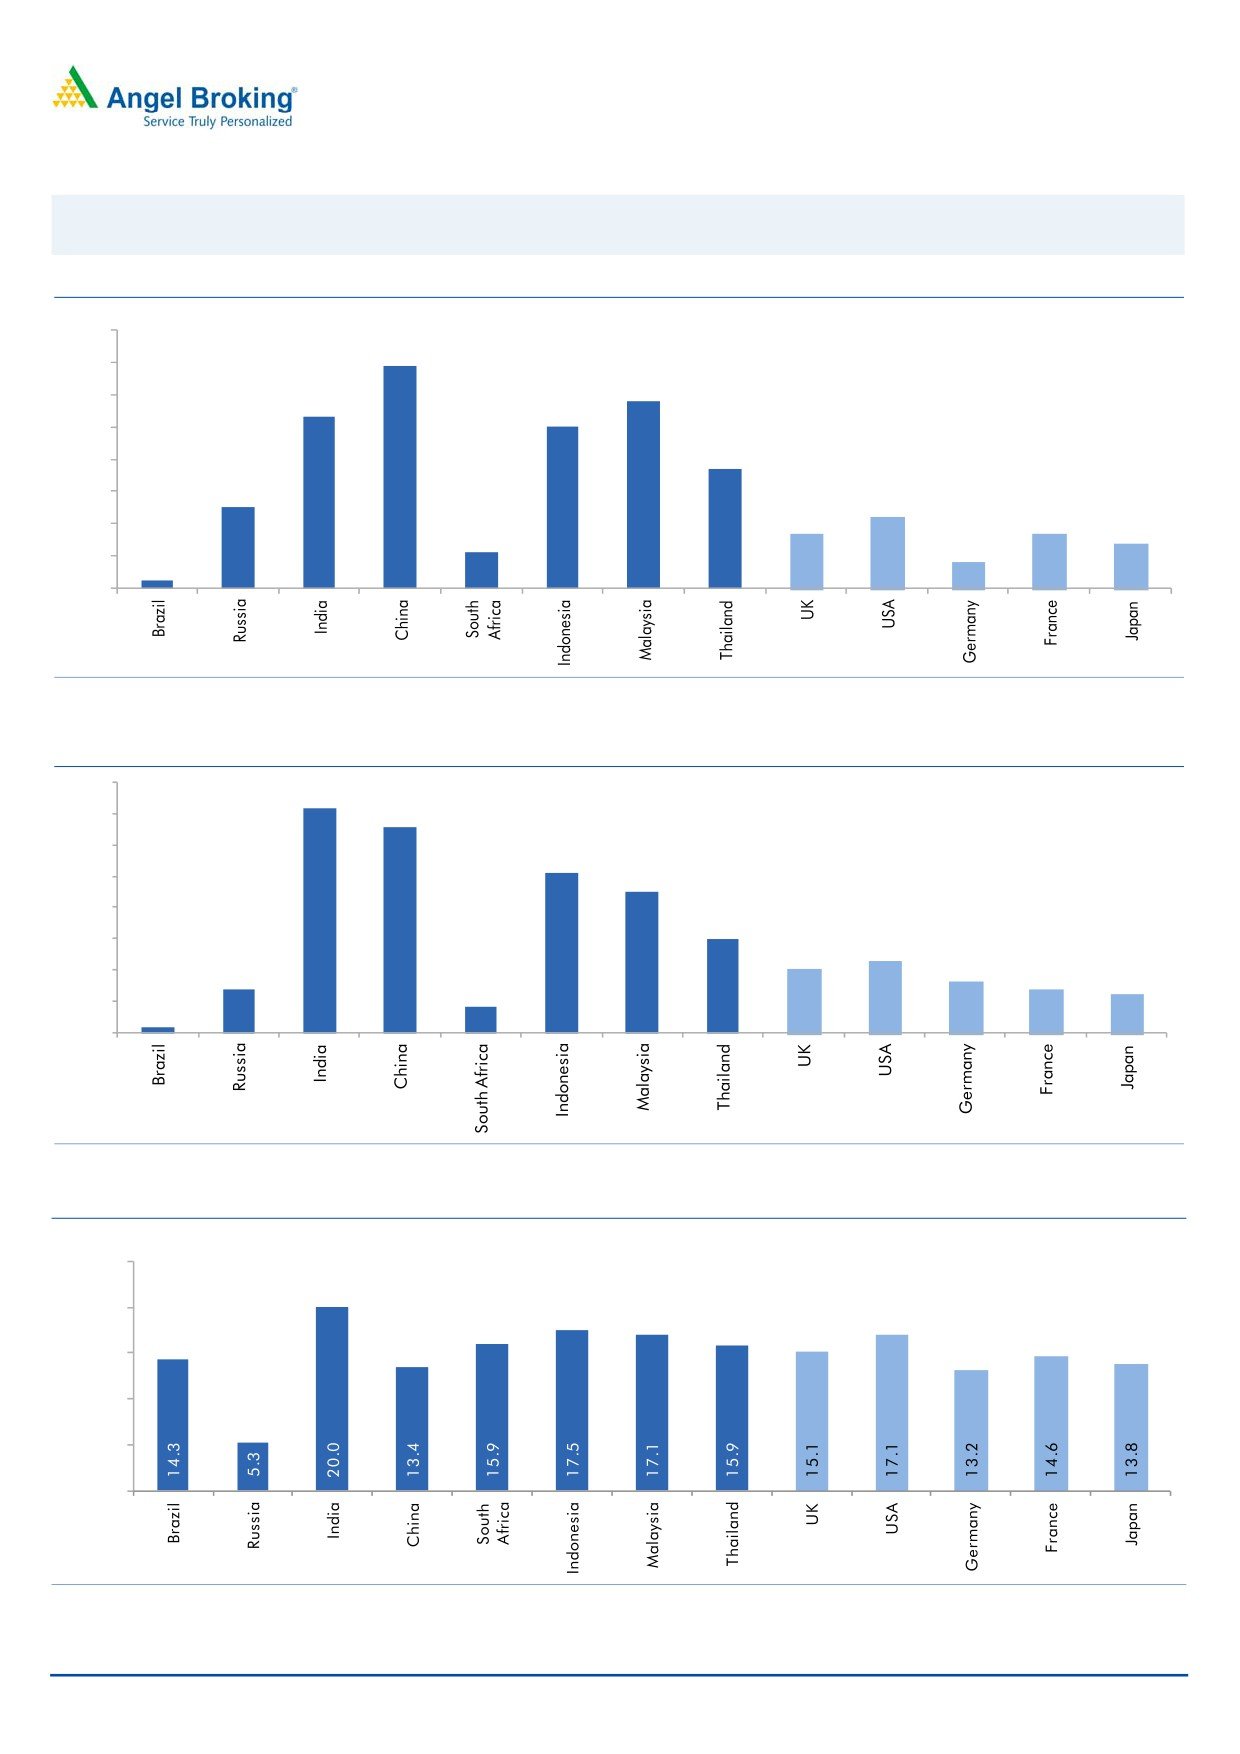
Global watch
Exhibit 8: Latest quarterly GDP Growth (%, yoy) across select developing and developed countries
8%0 ()
6.9
7.0
5.8
6.0
5.3
5.0
5.0
1.1
3.7
4.0
2.5
3.0
2.2
1.7
1.7
2.0
1.4
0.8
1.0
0.3
-
Source: Bloomberg, Angel Research
Exhibit 9: 2017 GDP Growth projection by IMF (%, yoy) across select developing and developed countries
(%)
7.2
6.6
7.0
6.0
5.1
5.0
4.5
4.0
3.0
3.0
2.3
2.0
1.4
1.6
2.0
1.4
1.2
0.2
0.8
1.0
-
Source: IMF, Angel Research
Exhibit 10: One year forward P-E ratio across select developing and developed countries
(x)
25.0
20.0
15.0
10.0
5.0
-
Source: IMF, Angel Research
September 12, 2017
10
Top Picks Report | September 2017
Exhibit 11: Relative performance of indices across globe
Returns (%)
Country
Name of index
Closing price
1M
3M
1YR
Brazil
Bovespa
73,079
7.6
16.4
22.7
Russia
Micex
2,033
2.9
7.9
0.6
India
Nifty
9,935
(1.2)
2.8
12.8
China
Shanghai Composite
3,365
3.6
7.2
10.0
South Africa
Top 40
49,274
(0.6)
7.7
5.3
Mexico
Mexbol
50,084
(2.3)
1.9
7.8
Indonesia
LQ45
976
1.0
2.0
3.8
Malaysia
KLCI
1,780
0.3
0.2
5.8
Thailand
SET 50
1,046
4.4
5.9
8.5
USA
Dow Jones
21,798
(1.3)
2.9
20.5
UK
FTSE
7,378
(2.2)
(2.0)
10.1
Japan
Nikkei
19,275
(3.6)
(3.2)
13.9
Germany
DAX
12,304
1.2
(3.0)
18.6
France
CAC
5,113
(0.6)
(2.4)
18.0
Source: Bloomberg, Angel Research
September 12, 2017
11
Top Picks Report | September 2017
Stock Watch
September 12, 2017
12
Top Picks Report
September 12, 2017
Company Name
Reco
CMP
Target
Mkt Cap
Sales ( Čcr )
OPM(%)
EPS (Č)
PER(x)
P/BV(x)
RoE(%)
EV/Sales(x)
(Č)
Price ( Č)
( Č cr )
FY18E FY19E
FY18E
FY19E
FY18E
FY19E
FY18E
FY19E
FY18E
FY19E
FY18E
FY19E
FY18E
FY19E
Agri / Agri Chemical
Rallis
Reduce
222
209
4,308
1,873
2,099
15.0
15.0
9.5
10.5
23.3
21.1
3.5
3.2
15.8
16.0
2.2
2.0
United Phosphorus
Neutral
812
-
41,248
18,922
21,949
18.0
18.5
36.2
45.6
22.4
17.8
4.7
3.9
22.7
23.8
2.3
2.0
Auto & Auto Ancillary
Ashok Leyland
Accumulate
116
127
34,036
23,339
27,240
10.1
10.8
4.7
6.2
25.0
18.7
5.0
4.4
20.0
23.6
1.4
1.2
Bajaj Auto
Accumulate
2,930
3,151
84,793
23,936
27,955
19.5
20.1
142.7
167.3
20.5
17.5
4.5
4.0
21.8
22.8
3.1
2.6
Bharat Forge
Neutral
1,178
-
27,413
7,637
8,755
21.7
23.2
36.1
47.3
32.6
24.9
5.9
5.0
18.5
20.8
3.4
2.9
Eicher Motors
Neutral
32,467
-
88,383
19,043
22,837
19.5
19.9
835.4
1,019.0
38.9
31.9
14.5
11.2
40.9
37.8
4.5
3.7
Gabriel India
Neutral
209
-
3,003
1,782
2,033
9.7
10.2
7.1
8.9
29.4
23.6
5.9
5.0
21.0
22.2
1.6
1.4
Hero Motocorp
Neutral
3,946
-
78,797
32,239
36,878
16.0
15.6
184.4
206.5
21.4
19.1
6.7
5.9
31.3
30.7
2.2
1.9
Jamna Auto Industries Neutral
252
-
2,009
1,441
1,662
14.4
14.8
13.9
17.6
18.1
14.3
5.0
4.0
30.0
31.0
1.4
1.2
Mahindra and Mahindra Neutral
1,281
-
79,531
46,971
53,816
13.6
14.0
67.7
79.8
18.9
16.1
2.7
2.4
15.0
15.9
1.6
1.3
Maruti
Accumulate
8,145
8658
246,044
81,825
101,245
15.0
15.0
283.5
356.0
28.7
22.9
6.3
5.1
21.9
22.4
2.7
2.1
Minda Industries
Neutral
885
-
7,649
4,328
5,084
11.0
11.9
27.3
36.4
32.5
24.3
6.9
5.4
23.1
25.6
1.8
1.6
Motherson Sumi
Neutral
333
-
70,071
55,937
64,445
10.8
11.4
16.9
21.1
19.7
15.8
4.4
4.5
25.2
25.4
1.3
1.1
Tata Motors
Neutral
375
-
108,391
303,167
343,649
11.8
13.8
33.1
54.7
11.3
6.9
1.9
1.5
16.9
23.0
0.4
0.3
TVS Motor
Neutral
639
-
30,372
13,992
16,216
9.0
9.4
17.1
20.3
37.5
31.5
10.0
7.7
29.7
27.7
2.1
1.8
Amara Raja Batteries
Accumulate
785
858
13,402
6,140
7,122
14.3
15.6
29.3
39.0
26.8
20.1
4.6
3.8
17.1
19.0
2.2
1.9
Exide Industries
Neutral
221
-
18,819
8,689
9,854
15.1
15.2
9.7
11.0
22.9
20.1
4.1
3.6
15.7
16.1
1.9
1.7
Apollo Tyres
Neutral
256
-
13,046
15,739
17,326
13.3
14.6
20.4
26.7
12.6
9.6
1.5
1.3
20.4
26.7
1.1
1.0
Ceat
Neutral
1,751
-
7,083
6,661
7,717
11.1
14.2
116.2
178.2
15.1
9.8
2.6
2.2
15.2
21.3
1.2
1.0
JK Tyres
Neutral
148
-
3,346
8,318
9,239
16.2
16.4
21.0
27.5
7.0
5.4
1.4
1.1
19.1
20.4
0.9
0.7
Swaraj Engines
Neutral
1,996
-
2,479
788
889
16.4
16.5
71.6
81.0
27.9
24.7
8.0
7.5
29.6
31.0
2.8
2.4
Subros
Neutral
244
-
1,461
1,855
2,135
11.6
11.8
10.3
14.7
23.8
16.6
3.6
3.1
15.8
19.1
1.0
0.9
Capital Goods
BEML
Neutral
1,869
-
7,782
4,286
5,194
7.1
8.2
42.9
58.1
43.6
32.2
3.6
3.2
7.6
8.7
1.9
1.5
Bharat Electronics
Neutral
192
-
42,841
10,258
12,470
19.6
19.5
7.3
8.6
26.3
22.3
0.5
0.5
20.4
21.9
3.7
3.0
Voltas
Neutral
535
-
17,709
6,778
8,004
9.6
11.0
17.1
22.4
31.3
23.9
7.5
6.5
17.7
19.8
2.3
1.9
BHEL
Neutral
131
-
31,953
33,200
39,167
6.8
9.5
6.2
11.2
21.1
11.7
1.0
0.9
4.6
8.0
0.5
0.4
Blue Star
Neutral
792
-
7,584
5,101
5,997
6.0
7.0
17.9
26.6
44.3
29.8
9.4
8.6
21.9
29.0
1.5
1.3
CG Power and Industrial
Neutral
87
-
5,462
6,555
7,292
7.5
7.5
-
0.8
8,715.0
108.9
1.4
1.4
0.1
1.2
0.9
0.8
Solutions
Greaves Cotton
Neutral
148
-
3,620
1,778
1,993
14.7
15.1
8.1
9.1
18.3
16.3
4.1
3.8
21.8
23.6
1.8
1.6
Top Picks Report
September 12, 2017
Company Name
Reco
CMP
Target
Mkt Cap
Sales ( Čcr )
OPM(%)
EPS (Č)
PER(x)
P/BV(x)
RoE(%)
EV/Sales(x)
(Č)
Price ( Č)
( Č cr )
FY18E FY19E
FY18E
FY19E
FY18E
FY19E
FY18E
FY19E
FY18E
FY19E
FY18E
FY19E
FY18E
FY19E
Capital Goods
KEC International
Neutral
315
-
8,109
9,779
11,113
9.4
9.8
14.2
18.2
22.2
17.3
4.3
3.5
21.1
22.1
1.1
1.0
KEI Industries
Buy
326
371
2,537
3,001
3,391
10.0
10.0
13.0
16.1
25.1
20.2
4.6
3.8
18.2
18.7
1.0
0.9
Thermax
Neutral
880
-
10,480
4,125
4,747
10.3
10.8
26.7
31.5
32.9
27.9
3.7
3.4
11.2
12.0
2.3
2.0
VATech Wabag
Accumulate
616
681
3,365
3,867
4,126
9.6
10.0
34.9
39.8
17.7
15.5
2.9
2.5
17.7
17.5
0.9
0.8
Cement
ACC
Neutral
1,796
-
33,733
12,255
13,350
13.5
14.3
58.0
66.2
31.0
27.1
3.7
3.4
11.5
12.2
2.7
2.5
Ambuja Cements
Neutral
285
-
56,611
10,250
11,450
17.5
19.0
7.2
8.3
39.6
34.4
2.8
2.7
7.0
7.8
5.3
4.7
India Cements
Neutral
185
-
5,693
6,135
6,750
14.8
15.2
8.5
11.5
21.7
16.1
1.1
1.0
4.8
6.2
1.3
1.1
JK Cement
Neutral
1,024
-
7,157
4,150
4,775
19.2
20.0
49.0
63.5
20.9
16.1
3.3
2.8
17.0
18.5
2.2
1.8
J K Lakshmi Cement
Neutral
419
-
4,930
3,422
3,757
15.5
17.0
13.5
23.2
31.0
18.1
3.2
2.8
10.8
15.5
1.8
1.6
Orient Cement
Neutral
163
-
3,335
2,215
3,233
16.8
17.0
5.9
6.9
27.6
23.6
2.1
2.0
10.8
10.1
2.5
1.7
UltraTech Cement
Neutral
4,166
-
114,360
28,250
35,150
20.2
23.5
77.5
122.2
53.8
34.1
4.5
4.1
9.6
14.8
4.5
3.6
Construction
KNR Constructions
Neutral
201
-
2,821
1,846
2,203
14.5
14.5
12.1
13.7
16.6
14.7
0.9
0.8
17.5
16.7
1.6
1.3
Larsen & Toubro
Neutral
1,217
-
170,432
95,787
109,476
10.2
11.6
44.5
50.8
27.4
24.0
3.4
3.2
12.9
13.1
2.3
2.1
Gujarat Pipavav Port
Neutral
141
-
6,821
739
842
61.6
62.7
5.1
6.2
27.7
22.9
3.5
3.4
12.7
14.9
8.7
7.5
PNC Infratech
Accumulate
134
143
3,429
2,040
2,935
13.0
13.0
6.4
9.0
20.9
14.9
0.5
0.5
9.7
12.2
1.7
1.2
Simplex Infra
Neutral
437
-
2,164
6,012
6,619
11.6
11.7
21.1
31.0
20.8
14.1
1.4
1.3
6.5
8.6
0.9
0.8
Sadbhav Engineering
Neutral
284
-
4,880
3,823
4,426
10.7
10.8
10.3
11.8
27.6
24.1
3.3
2.9
10.1
10.5
1.6
1.4
NBCC
Neutral
208
-
18,761
9,099
12,706
6.4
6.4
7.3
9.6
28.6
21.8
1.3
1.0
27.5
30.5
1.9
1.4
MEP Infra
Neutral
104
-
1,697
2,403
2,910
18.3
16.8
2.4
6.1
44.4
17.2
16.8
11.4
35.2
55.8
1.9
1.5
SIPL
Neutral
99
-
3,473
2,060
2,390
46.8
47.7
(5.8)
(3.1)
3.7
4.2
(14.2)
(2.3)
6.4
6.0
Engineers India
Neutral
159
-
10,701
1,795
2,611
21.1
22.4
5.9
8.1
26.9
19.6
1.9
1.9
12.9
16.1
4.3
2.8
Financials
Axis Bank
Buy
493
580
118,249
32,558
35,843
3.5
3.2
27.8
41.0
17.7
12.0
1.9
1.7
11.4
14.9
-
-
Bank of Baroda
Neutral
138
-
31,705
22,533
26,079
2.4
2.4
12.0
20.9
11.5
6.6
0.7
0.7
6.6
11.0
-
-
Canara Bank
Neutral
334
-
19,941
17,925
20,235
2.0
2.1
18.5
36.5
18.1
9.2
0.7
0.6
3.4
6.2
-
-
Can Fin Homes
Neutral
2,842
-
7,565
586
741
3.5
3.5
107.8
141.0
26.4
20.2
5.8
4.7
24.1
25.6
-
-
Cholamandalam Inv. &
Neutral
1,178
-
18,405
2,826
3,307
6.3
6.3
53.7
64.6
22.0
18.2
3.7
3.2
18.3
18.9
-
-
Fin. Co.
Dewan Housing Finance Accumulate
548
610
17,192
2,676
3,383
2.4
2.7
37.4
49.7
14.7
11.0
1.9
1.7
13.8
16.2
-
-
Equitas Holdings
Buy
172
235
5,832
1,125
1,380
9.6
9.8
1.5
6.0
114.8
28.7
2.6
2.4
2.4
8.2
-
-
Federal Bank
Accumulate
113
125
21,947
4,896
5,930
2.8
3.1
5.4
7.6
21.0
14.9
1.8
1.6
8.5
11.0
-
-
Top Picks Report
September 12, 2017
Company Name
Reco
CMP
Target
Mkt Cap
Sales ( Čcr )
OPM(%)
EPS (Č)
PER(x)
P/BV(x)
RoE(%)
EV/Sales(x)
(Č)
Price ( Č)
( Č cr )
FY18E FY19E
FY18E
FY19E
FY18E
FY19E
FY18E
FY19E
FY18E
FY19E
FY18E
FY19E
FY18E
FY19E
Financials
HDFC Bank
Neutral
1,823
-
470,562
55,236
63,253
4.5
4.4
68.9
82.4
26.5
22.1
4.6
3.8
18.7
18.5
-
-
ICICI Bank
Accumulate
291
315
186,685
42,361
51,378
3.6
3.9
18.4
25.7
15.8
11.3
1.7
1.7
11.3
15.0
-
-
Karur Vysya Bank
Accumulate
147
160
8,865
3,289
3,630
3.7
3.9
10.8
14.1
13.5
10.4
1.6
1.5
12.5
14.7
-
-
LIC Housing Finance
Neutral
656
-
33,103
4,895
6,332
3.4
3.7
50.7
66.8
12.9
9.8
2.6
2.1
21.7
23.8
-
-
Punjab Natl.Bank
Neutral
138
-
29,409
23,708
25,758
2.1
2.1
5.9
16.4
23.5
8.4
0.7
0.7
3.0
8.3
-
-
RBL Bank
Neutral
536
-
20,321
2,309
2,888
2.6
2.5
16.4
19.1
32.7
28.1
4.1
3.7
13.3
13.8
-
-
Repco Home Finance
Buy
670
825
4,192
496
597
4.4
4.2
38.5
48.7
17.4
13.8
3.1
2.6
19.6
20.6
-
-
South Ind.Bank
Neutral
29
-
5,215
3,195
3,567
3.0
3.1
3.0
3.8
9.6
7.5
1.0
0.9
10.5
11.9
-
-
St Bk of India
Neutral
271
-
233,799
105,827
121,056
2.4
2.5
16.1
25.6
16.8
10.6
1.3
1.2
6.6
9.9
-
-
Union Bank
Neutral
133
-
9,672
14,650
16,225
2.3
2.3
23.1
32.5
5.8
4.1
0.4
0.4
7.1
9.2
-
-
Yes Bank
Neutral
1,842
-
84,314
11,088
13,138
3.0
2.9
84.0
99.3
21.9
18.5
3.4
2.9
16.3
16.8
-
-
FMCG
Akzo Nobel India
Neutral
1,824
-
8,748
3,164
3,607
13.8
13.7
58.6
67.9
31.1
26.9
7.6
6.7
24.5
25.1
2.6
2.3
Asian Paints
Neutral
1,237
-
118,638
17,603
20,615
18.6
18.6
2,128.9
2,543.3
0.6
0.5
12.3
10.3
28.0
28.9
6.5
5.5
Britannia
Neutral
4,299
-
51,619
9,690
11,278
14.8
15.4
84.0
101.0
51.2
42.6
18.7
14.8
40.6
39.0
5.3
4.5
Colgate
Neutral
1,149
-
31,250
4,420
5,074
24.9
25.3
28.6
32.8
40.2
35.0
15.9
12.8
43.8
40.5
6.8
5.9
Dabur India
Neutral
310
-
54,598
8,346
9,344
19.6
19.9
7.8
9.0
39.7
34.4
8.0
7.2
25.2
24.8
6.1
5.4
GlaxoSmith Con*
Neutral
5,106
-
21,473
5,072
5,760
18.2
18.4
176.3
199.2
29.0
25.6
6.1
5.6
21.2
21.7
3.6
3.1
Godrej Consumer
Neutral
929
-
63,323
10,171
11,682
20.8
21.5
21.7
27.1
42.8
34.3
9.6
8.3
22.3
23.4
6.3
5.5
HUL
Neutral
1,219
-
263,861
37,077
41,508
20.3
21.8
5,189.9
6,318.5
0.2
0.2
37.2
31.8
74.8
82.0
7.0
6.2
ITC
Neutral
274
-
333,497
44,588
49,853
37.0
37.3
9.6
11.0
28.5
24.9
7.0
6.7
25.1
27.3
7.0
6.2
Marico
Neutral
324
-
41,798
6,788
7,766
18.5
19.2
7.1
8.5
45.6
38.1
16.0
13.7
36.9
38.0
6.0
5.2
Nestle*
Neutral
7,294
-
70,322
10,083
11,182
20.0
20.9
119.7
141.3
60.9
51.6
214.8
196.3
36.7
39.8
6.7
5.9
Tata Global
Neutral
209
-
13,206
7,121
7,641
11.9
12.3
6.9
8.0
30.3
26.2
2.0
1.9
6.8
7.2
1.7
1.5
Procter & Gamble
Neutral
8,327
-
27,029
3,034
3,579
27.1
27.7
167.7
198.8
49.7
41.9
13.3
11.5
28.8
29.5
8.3
7.0
Hygiene
IT
HCL Tech^
Buy
861
1,014
122,906
52,342
57,053
20.9
20.9
62.8
67.6
13.7
12.7
3.1
2.6
22.4
20.6
2.0
1.7
Infosys
Buy
879
1,179
201,800
73,963
80,619
26.0
26.0
64.4
69.3
13.6
12.7
2.7
2.5
19.7
19.6
2.2
1.9
TCS
Accumulate
2,464
2,651
485,425
127,403
138,870
27.6
27.6
144.5
156.0
17.1
15.8
5.1
4.7
29.7
29.8
3.5
3.1
Tech Mahindra
Buy
440
533
42,964
31,015
33,496
15.0
15.0
35.6
38.1
12.4
11.6
2.1
2.0
17.0
16.3
1.2
1.0
Wipro
Neutral
301
-
146,609
58,536
61,858
20.3
20.3
18.2
19.1
16.6
15.8
2.6
2.2
14.6
13.4
2.4
2.3
Top Picks Report
September 12, 2017
Company Name
Reco
CMP
Target
Mkt Cap
Sales ( Čcr )
OPM(%)
EPS (Č)
PER(x)
P/BV(x)
RoE(%)
EV/Sales(x)
(Č)
Price ( Č)
( Č cr )
FY18E FY19E
FY18E
FY19E
FY18E
FY19E
FY18E
FY19E
FY18E
FY19E
FY18E
FY19E
FY18E
FY19E
Media
D B Corp
Neutral
376
-
6,913
2,404
2,625
30.5
31.5
23.7
26.9
15.9
14.0
3.7
3.2
23.5
22.8
2.7
2.5
HT Media
Neutral
101
-
2,347
2,589
2,830
15.1
15.4
8.3
10.9
12.2
9.3
1.0
0.9
8.4
10.4
0.5
0.3
Jagran Prakashan
Buy
177
225
5,778
2,541
2,835
28.5
28.7
12.7
14.1
13.9
12.5
2.9
2.5
21.3
21.4
2.1
1.8
Sun TV Network
Neutral
828
-
32,642
3,238
3,789
51.9
55.1
30.9
38.0
26.8
21.8
7.6
6.7
30.0
31.0
9.6
8.1
Hindustan Media
Neutral
263
-
1,927
1,002
1,074
23.3
23.5
29.2
33.8
9.0
7.8
1.4
1.2
15.6
15.4
0.9
0.7
Ventures
TV Today Network
Buy
271
344
1,615
667
727
27.7
27.7
18.6
20.1
14.6
13.5
2.3
2.3
15.6
17.3
2.0
1.8
Music Broadcast Limited Accumulate
386
434
2,202
271
317
91.0
109.0
6.0
10.0
64.3
38.6
4.0
3.6
6.5
9.3
7.7
6.4
Metals & Mining
Coal India
Neutral
257
-
159,499
82,301
91,235
17.0
18.0
17.1
20.5
15.0
12.5
2.8
2.7
45.0
55.0
1.6
1.4
Hind. Zinc
Neutral
309
-
130,393
22,108
24,555
57.0
58.0
22.1
26.3
14.0
11.7
4.5
3.7
32.0
35.0
4.9
4.1
Hindalco
Neutral
250
-
56,079
102,350
105,355
13.5
14.5
21.5
24.5
11.6
10.2
1.6
1.4
15.0
15.2
1.1
1.1
JSW Steel
Neutral
266
-
64,298
64,500
68,245
21.1
21.5
20.1
21.2
13.2
12.6
2.4
2.1
-
-
1.7
1.7
NMDC
Neutral
135
-
42,697
10,209
11,450
47.0
48.0
11.1
12.1
12.2
11.2
1.7
1.6
-
-
3.7
3.3
SAIL
Neutral
63
-
26,061
54,100
63,555
3.0
10.0
(10.0)
1.5
42.1
0.8
0.8
-
-
1.5
1.3
Vedanta
Neutral
330
-
122,556
81,206
87,345
28.0
29.0
26.5
33.5
12.4
9.8
2.8
2.4
-
-
2.3
1.9
Tata Steel
Neutral
661
-
64,227
121,445
126,500
16.2
17.2
65.4
81.3
10.1
8.1
1.6
1.4
-
-
1.1
0.9
Oil & Gas
GAIL
Neutral
394
-
66,697
53,115
52,344
14.2
15.3
30.0
31.1
13.2
12.7
1.6
1.5
-
-
1.0
1.0
ONGC
Neutral
163
-
209,695
83,111
84,934
44.2
44.9
16.4
16.9
10.0
9.7
1.2
1.1
-
-
2.4
2.4
Indian Oil Corp
Neutral
429
-
208,343
396,116
432,560
8.5
8.8
40.1
42.2
10.7
10.2
1.9
1.7
-
-
0.7
0.6
Reliance Industries
Neutral
818
-
532,076
257,711
267,438
17.0
18.2
89.1
89.5
9.2
9.1
0.9
0.8
-
-
1.7
1.6
Pharmaceuticals
Alembic Pharma
Buy
501
600
9,435
3,903
4,584
18.2
19.2
21.8
27.2
23.0
18.4
4.2
3.5
19.8
20.6
2.4
2.1
Alkem Laboratories Ltd
Buy
1,817
2,161
21,724
6,901
7,850
18.4
19.1
85.0
100.5
21.4
18.1
4.3
3.6
20.2
20.1
3.1
2.7
Aurobindo Pharma
Accumulate
741
823
43,417
17,086
19,478
22.1
22.0
44.7
51.4
16.6
14.4
3.7
3.0
24.7
22.7
2.7
2.3
Aventis*
Neutral
4,006
-
9,226
2,508
2,862
16.8
16.8
139.9
153.8
28.6
26.1
4.2
3.4
23.5
25.8
3.3
2.7
Cadila Healthcare
Reduce
477
426
48,858
11,584
13,228
20.3
20.4
18.7
21.3
25.5
22.4
5.7
4.7
24.6
22.9
4.0
3.5
Cipla
Sell
552
458
44,407
16,619
19,437
15.4
16.2
19.7
24.3
28.0
22.7
3.2
2.8
12.0
13.2
2.8
2.4
Dr Reddy's
Neutral
2,159
-
35,799
15,844
17,973
17.6
18.2
91.7
111.0
23.6
19.5
2.7
2.4
11.9
13.0
2.5
2.2
GSK Pharma*
Neutral
2,434
-
20,618
3,260
3,651
15.0
18.0
46.1
58.6
52.8
41.5
10.8
11.2
20.0
26.5
6.2
5.7
Indoco Remedies
Sell
195
153
1,798
1,154
1,310
14.9
14.9
11.3
12.7
17.3
15.4
2.5
2.2
15.0
15.0
1.7
1.4
Ipca labs
Accumulate
471
540
5,941
3,593
4,022
14.5
15.5
19.4
25.2
24.3
18.7
2.2
2.0
9.5
11.2
1.7
1.5
Top Picks Report
September 12, 2017
Company Name
Reco
CMP
Target
Mkt Cap
Sales ( Čcr )
OPM(%)
EPS (Č)
PER(x)
P/BV(x)
RoE(%)
EV/Sales(x)
(Č)
Price ( Č)
( Č cr )
FY18E FY19E
FY18E
FY19E
FY18E
FY19E
FY18E
FY19E
FY18E
FY19E
FY18E
FY19E
FY18E
FY19E
Pharmaceuticals
Lupin
Buy
978
1,467
44,170
18,657
21,289
21.3
23.3
52.8
66.7
18.5
14.7
2.8
2.4
16.3
17.5
2.4
2.0
Natco Pharma
Accumulate
735
796
12,804
1,836
1,946
31.8
28.9
22.1
20.6
33.2
35.6
6.7
6.0
20.1
16.7
6.8
6.4
Sun Pharma
Buy
469
558
112,441
32,899
36,451
26.9
25.4
31.6
32.3
14.8
14.5
2.6
2.3
18.7
18.8
3.0
2.6
Syngene International
Buy
476
557
9,524
1,402
1,823
32.8
36.0
15.9
20.7
30.0
23.1
5.6
4.6
18.7
20.0
6.8
5.2
Power
Tata Power
Neutral
81
-
21,800
32,547
33,806
20.5
20.5
4.7
5.4
17.2
15.1
1.6
1.4
10.5
10.5
1.7
1.6
NTPC
Neutral
170
-
140,503
86,070
101,246
28.3
30.7
12.9
16.2
13.2
10.5
1.4
1.3
10.6
12.4
3.0
2.7
Power Grid
Neutral
216
-
112,741
29,183
32,946
89.7
90.0
18.0
20.8
12.0
10.4
2.0
1.8
17.7
18.2
7.8
7.2
Real Estate
Prestige Estate
Neutral
258
-
9,660
4,607
5,146
21.0
22.2
7.9
9.8
32.6
26.3
2.0
1.9
10.3
12.0
3.3
3.0
MLIFE
Buy
439
522
2,255
487
590
12.3
17.8
21.0
31.2
20.9
14.1
1.1
1.0
5.2
7.4
3.3
2.7
Telecom
Bharti Airtel
Neutral
402
-
160,656
97,903
105,233
36.0
36.3
9.3
11.1
43.2
36.4
2.1
2.0
5.0
5.6
2.6
2.3
Idea Cellular
Neutral
79
-
28,368
35,012
37,689
27.1
27.7
(4.4)
(2.7)
1.2
1.3
(6.8)
(4.6)
2.1
1.9
zOthers
Abbott India
Neutral
4,153
-
8,824
3,244
3,723
14.9
16.1
167.5
209.4
24.8
19.8
5.5
4.6
23.7
24.8
2.4
2.0
Asian Granito
Accumulate
448
490
1,347
1,169
1,286
12.5
12.5
16.0
19.7
28.0
22.7
3.0
2.6
10.7
11.6
1.4
1.2
Bajaj Electricals
Accumulate
366
395
3,719
4,646
5,301
6.7
7.6
16.1
22.3
22.8
16.4
3.7
3.2
16.4
19.2
0.8
0.7
Banco Products (India)
Neutral
218
-
1,562
1,530
1,695
13.2
12.7
19.0
20.0
11.5
10.9
1.8
1.6
0.2
0.2
0.9
103.4
Coffee Day Enterprises
Neutral
246
-
5,069
3,494
3,913
17.4
18.0
4.8
5.7
-
43.2
2.2
2.1
-
0.1
1.9
1.7
Ltd
Elecon Engineering
Neutral
52
-
580
171
201
15.0
16.2
36.0
43.0
1.4
1.2
0.1
0.1
0.1
0.1
2.8
2.3
Garware Wall Ropes
Neutral
910
-
1,991
928
1,003
15.2
15.2
39.4
43.2
23.1
21.1
3.8
3.3
16.5
15.4
2.0
1.8
Goodyear India*
Neutral
820
-
1,891
1,717
1,866
11.8
12.3
47.9
49.8
17.1
16.5
2.6
2.3
15.6
15.7
0.8
114.1
Hitachi
Neutral
1,910
-
5,193
2,355
2,715
10.3
10.8
49.0
60.9
39.0
31.4
9.1
7.2
0.2
0.2
2.2
1.9
HSIL
Neutral
382
-
2,763
2,240
2,670
14.6
15.0
17.0
22.0
22.5
17.4
1.9
1.8
0.1
0.1
1.5
1.2
Interglobe Aviation
Neutral
1,216
-
43,979
22,570
27,955
14.2
15.0
63.6
81.8
19.1
14.9
10.1
8.5
0.5
0.6
1.6
1.2
Jyothy Laboratories
Neutral
415
-
7,545
1,781
2,044
14.1
15.0
9.4
10.5
44.4
39.6
9.5
8.9
0.2
0.2
4.5
3.8
Linc Pen & Plastics
Neutral
235
-
347
420
462
9.3
9.3
15.3
17.1
15.4
13.7
2.6
2.7
16.9
19.5
0.9
0.8
M M Forgings
Neutral
623
-
752
542
642
20.1
21.0
41.6
56.8
15.0
11.0
2.1
1.8
0.1
0.2
1.8
1.6
Mirza International
Neutral
176
-
2,114
1,148
1,285
18.0
18.0
8.0
9.4
21.9
18.8
3.6
3.1
16.3
16.1
2.0
1.7
Navkar Corporation
Buy
194
265
2,764
561
617
41.5
41.5
11.5
12.7
16.8
15.3
1.8
1.6
10.5
10.4
5.6
4.9
Nilkamal
Neutral
1,613
-
2,406
2,317
2,525
11.4
11.1
96.0
105.0
16.8
15.4
2.9
2.5
0.2
0.2
1.0
0.9
Parag Milk Foods
Neutral
247
-
2,079
1,987
2,379
7.6
9.0
12.4
18.3
19.9
13.5
2.8
2.5
8.2
13.2
1.2
1.0
Top Picks Report
September 12, 2017
Company Name
Reco
CMP
Target Mkt Cap
Sales ( Čcr )
OPM(%)
EPS (Č)
PER(x)
P/BV(x)
RoE(%)
EV/Sales(x)
(Č)
Price ( Č)
( Č cr )
FY18E FY19E FY18E FY19E FY18E FY19E FY18E FY19E FY18E FY19E FY18E FY19E FY18E FY19E
zOthers
Radico Khaitan
Neutral
179
-
2,379
1,811
1,992
13.2
13.2
8.1
8.8
22.1
20.3
2.2
2.4
10.1
12.0
1.6
1.5
Relaxo Footwears
Neutral
516
-
6,204
1,981
2,310
13.7
14.5
12.0
15.5
43.0
33.3
8.4
6.8
0.2
0.2
3.2
2.7
Siyaram Silk Mills
Accumulate
2,267
2,500
2,125
1,769
1,981
12.7
12.7
113.1
131.1
20.0
17.3
3.1
2.7
15.5
15.5
1.4
1.2
Styrolution ABS India* Neutral
907
-
1,596
1,800
1,980
8.0
8.1
42.0
46.2
21.6
19.6
2.4
2.2
0.1
0.1
1.0
0.9
Surya Roshni
Neutral
305
-
1,338
4,870
5,320
7.7
7.8
22.8
28.1
13.4
10.9
1.8
1.5
0.1
0.1
0.5
0.4
TVS Srichakra
Neutral
3,210
-
2,458
2,729
2,893
12.7
12.5
248.5
265.0
12.9
12.1
3.7
3.0
0.3
0.3
0.9
0.8
Visaka Industries
Neutral
649
-
1,031
1,104
1,214
12.1
12.6
31.0
37.9
20.9
17.2
2.6
2.3
0.1
0.1
1.2
1.0
VIP Industries
Accumulate
228
250
3,224
1,450
1,693
10.4
10.5
6.5
7.8
34.9
29.2
7.4
6.4
21.1
22.1
2.2
1.9
Navin Fluorine
Accumulate
667
730
3,286
945
1,154
22.4
22.6
28.7
34.8
23.2
19.2
3.8
3.3
-
-
3.0
2.3
Source: Company, Angel Research; Note: *December year end; #September year end; &October year end; Price as on September 11, 2017
Top Picks Report | September 2017
Research Team Tel: 022 - 39357800
DISCLAIMER
Angel Broking Private Limited (hereinafter referred to as “Angel”) is a registered Member of National Stock Exchange of India Limited,
Bombay Stock Exchange Limited and Metropolitan Stock Exchange Limited. It is also registered as a Depository Participant with CDSL
and Portfolio Manager with SEBI. It also has registration with AMFI as a Mutual Fund Distributor. Angel Broking Private Limited is a
registered entity with SEBI for Research Analyst in terms of SEBI (Research Analyst) Regulations, 2014 vide registration number
INH000000164. Angel or its associates has not been debarred/ suspended by SEBI or any other regulatory authority for accessing
/dealing in securities Market. Angel or its associates/analyst has not received any compensation / managed or co-managed public
offering of securities of the company covered by Analyst during the past twelve months.
This document is solely for the personal information of the recipient, and must not be singularly used as the basis of any investment
decision. Nothing in this document should be construed as investment or financial advice. Each recipient of this document should
make such investigations as they deem necessary to arrive at an independent evaluation of an investment in the securities of the
companies referred to in this document (including the merits and risks involved), and should consult their own advisors to determine
the merits and risks of such an investment.
Reports based on technical and derivative analysis center on studying charts of a stock's price movement, outstanding positions and
trading volume, as opposed to focusing on a company's fundamentals and, as such, may not match with a report on a company's
fundamentals. Investors are advised to refer the Fundamental and Technical Research Reports available on our website to evaluate the
contrary view, if any.
The information in this document has been printed on the basis of publicly available information, internal data and other reliable
sources believed to be true, but we do not represent that it is accurate or complete and it should not be relied on as such, as this
document is for general guidance only. Angel Broking Pvt. Limited or any of its affiliates/ group companies shall not be in any way
responsible for any loss or damage that may arise to any person from any inadvertent error in the information contained in this report.
Angel Broking Pvt. Limited has not independently verified all the information contained within this document. Accordingly, we cannot
testify, nor make any representation or warranty, express or implied, to the accuracy, contents or data contained within this document.
While Angel Broking Pvt. Limited endeavors to update on a reasonable basis the information discussed in this material, there may be
regulatory, compliance, or other reasons that prevent us from doing so.
This document is being supplied to you solely for your information, and its contents, information or data may not be reproduced,
redistributed or passed on, directly or indirectly.
Neither Angel Broking Pvt. Limited, nor its directors, employees or affiliates shall be liable for any loss or damage that may arise from
or in connection with the use of this information.
Ratings (Based on expected returns
Buy (> 15%)
Accumulate (5% to 15%)
Neutral (-5 to 5%)
over 12 months investment period):
Reduce (-5% to -15%)
Sell (< -15)