Angel Top Picks - September 2016
Angel Top Picks - September 2016
Top Picks
We have been highlighting over the past few months as to how some pockets of the
Company
CMP (`)
TP (`)
economy are showing signs of relatively higher traction despite the overall economy
Amara Raja
1,018
1,174
recovering only gradually. While investment demand in India has remained
BEL
1,213
1,414
subdued, consumption patterns show a healthy picture.
HCL Tech
787
1,000
Two wheelers & Passenger cars continued to accelerate
: If we go by the latest
Infosys
1,055
1,370
numbers, two-wheeler sales for the month of August 2016 have grown by 25%
Bajaj Electricals
272
306
month on month (YTD 8%), while passenger car sales commensurately reported a
Blue Star
514
578
12% growth (YTD 9%). After two years of drought-like situation, a favourable
Dewan Housing
298
325
monsoon this year has revived tractors sales, which grew by 22% month on month
Equitas Holdings
182
235
during the same period (YTD 19%). Also, Royal Enfield representing the premium
Goodyear India
601
684
bike segment continued to report a strong 32% month on month growth (YTD 35%).
IL&FS Transport.
76
93
White goods & other consumer products saw further pickup in growth: Harsh
Jagran Prakashan
195
225
summers across the country led to a strong increase in 1QFY2017 AC sales for
Mahindra Lifespace
431
522
Voltas (29% yoy) and Bluestar (34% yoy). If we extend the consumption trend and
Navkar Corp.
191
265
look into Appliance (Refrigerators, Washing Machine, ACs, Kitchenware) sales, then
Radico Khaitan
102
125
Whirlpool and IFB reported 16%/20% yoy increase in their 1QFY2017 sales.
Siyaram Silk Mills
1,281
1,469
Further, within the Electric Consumer Durable space, Crompton Greaves
TV Today
300
363
Electrical/V-Guard reported 23%/15% yoy increase in their 1QFY2017 sales. The
Source: Angel Research;
Building Products segment of HSIL has grown 17% yoy in 1QFY2017. Paint
Note: CMP as of Sept. 7, 2016
companies like Asian Paints, Berger, Kansai Nerolac reported 11-12% yoy volume
growth in 1QFY2017. The consumption story can be better ratified by the growing
Two wheelers sales accelerated backed
retail loan books of private sector banks and housing finance companies, which
by good monsoon
have grown by 20%+ and 15%+ yoy in 1QFY2017, respectively.
Service sector was again the start performer in GDP: We sense that a part of this
growth is fuelled by government spending, which should also spur a revival in the
corporate capex cycle. The 1QFY2017 GVA data shows that the economy has
Service sector continues to drive the
grown by 7.3%, with industry growing by 6% and services growing by 9.6%. Better
economic growth
than expected growth in services segment reinforces our view that the growth in the
economy is now being led by consumption.
Retail inflation to see moderation post monsoon: With retail inflation at 6.07% for
July 2016, it seems the RBI may not resort to rate cuts any time soon in the next few
months. CPI inflation above RBI’s comfort zone of 5% is a concern; however a large
art of the rise in inflation has been due to escalating food articles. However, the
p
good news is that food prices are likely to undergo moderation post monsoon. The
Weather Department as of September 02, 2016 has maintained its forecast of a
Expect moderation in retail inflation
above normal monsoon for this year. On the back of good monsoon season, we
expect softening in food prices, going forward. Our view gets substantiated from the
point that area under Kharif pulses cultivation for the year has gone up by 33% to
14.2mn hectares and total acreage under various crops cultivation has gone up by
3.7% to 103.4mn hectares.
We expect the Indian economy to see a relief from rising inflation in the near term,
courtesy good monsoon season. Further, we believe that consumption which is
growing better than rest of the economy can get further boost if the RBI initiates rate
cuts, provided inflation remains under control.
Please refer to important disclosures at the end of this report
1
Top Picks Report | September 2016
Higher disposable income, backed by 7th pay commission: We are of the view that
implementation of the 7th Pay Commission will further boost consumption. The
government is likely to release arrears of the same for Jan-Aug 2016 period and
cash-in-hand could flow in the month of September. Higher disposable income in
the hands of consumers in the festive season would be an icing on the cake.
Green shoots visible for capex cycle
Capex cycle has been delayed, but green shoots visible: The government on the
revival
other hand, has taken the lead initiative to revive capex spending. This can be
seen from high budgetary allocation and higher spending. Some of the key
pockets, where we see increased government thrust, include Roads, Defence, Rural
Electrification and Housing.
To start with, in case of Roads, of the total 25,000kms of awarding guidance for
FY2017, 1,840kms have been awarded during Apr-Jul 2016 (MoRTH-1,070kms
and NHAI-770kms). This is healthy considering that majority of this awarding is
back-ended to the financial year. Currently, bids are being filed for tenders
covering ~4,500kms (valued at over `65,000cr).
The government’s emphasis on the Indian Defence sector has led India to emerge
as the fourth highest spender (vs sixth highest largest last year) as per a recent IHS
report. India is expected to finalise `2.8tn of Defence projects in FY2017, with 40%
of the project being indigenised. Surge in defence spending can be seen from the
fact that one of the largest listed defence players, BEL has reported 53% yoy
growth in its 1QFY2017 order book.
The government has set an ambitious target of electrifying 18,452 un-electrified
villages by May 1, 2018. To-date 10,079 villages have been electrified. Notably,
8,425 of villages were electrified during 15th August, 2015 and 21st August, 2016.
Affordable and mid end housing demand seems picking up: Another push area
Housing data too has been
has been “Housing for All by 2022” scheme, which has led to surge in MIG/LIG
encoraging,which is again supported by
housing. A recent report by Cushman Wakefield substantiates our view that
uptick in cement demand
affordable housing has seen massive surge of close to 100% (double) in new
launches in 1HFY2016 as against the same time last year. Also from volume point
of view, mid-ranged housing (`70lakh-`2cr for Mumbai and Delhi; `50-`1.2cr for
Rest of India) saw the maximum launches of 36,267 units in Top 8 cities, recording
10% yoy increase in 1HFY2016.
Higher government spending has led to increase in cement demand, which
validates our point that revival in Infra spending is gradually picking-up. Cement
volumes of top
18 companies cumulatively reported
8.7% yoy increase to
48.2mntn in 1QFY2017.
In addition to above-mentioned verticals, Railways, Power, Irrigation and Water
Treatment Ministries have taken baby steps to clear the deck for big awarding to
be made going forward. Already some of the state governments have gone ahead
with the awarding of large ticket projects in the Irrigation and Water Treatment
space. We expect broader Infra segment spending to be seen going forward.
September 7, 2016
2
Top Picks Report | September 2016
RBI’s view reinforces our thesis that consumption will continue to be the growth
driver: In its annual report, the RBI reiterated that “while a durable pick up in
investment activity remains elusive, consumption will continue to provide main
support to aggregate demand and may receive boost from revival of rural demand
in response to the above normal monsoon”. In FY2016, India received the highest
ever FDI to the tune of US$35bn, reflecting at it being a preferred investment
destination. This has brought in a lot of stability to the INR.
On the whole, we sense that while investment demand will gradually pick up with
a lag effect, the Indian economy is likely to see improvement on the back of
increasing consumerism.
We have been vocal about consumption and infrastructure based themes playing
out well and the recent favourable developments and cues mentioned above add
to our conviction. We continue to like consumption based companies like Blue Star,
Bajaj Electricals, Siyaram Silk Mills and Radico Khaitan. We have already seen
revival in tractor demand and to play the monsoon theme we believe Goodyear
India is the right candidate as it is among the leaders in terms of market share in
tractor tyres. To play on government’s infrastructure spending and in anticipation
of a lower interest rates regime, we believe ITNL, Mahindra Life Space, Equitas
Holding are good picks.
September 7, 2016
3
Top Picks Report | September 2016
Exhibit 1: Cross section of recent growth trends in various pockets of the economy
Sector
Description
Data/ Growth
Period
Source
Auto sales numbers showed improvement in 5MFY17
Automobile
compared to previous year’s disappointing numbers. 2W
25%
Aug-16
Auto companies
segment has reported ~25% yoy growth in August.
PVs too have reported good growth of 12%
12%
Auto companies
Aug-16
Tractor sales (key players like M&M & Escort) have grown
by ~22% in August partially due to lower base and also
22%
Aug-16
Auto companies
led by favorable monsoon
Smartphone shipments in India rose by 15% in 2QCY2016
Smartphone
15%
Mint
and are expected to increase further
Voltas/ Bluestar reported impressive yoy AC sales growth.
AC sales
Daikin, Panasonic, Blue Star expect Industry to grow 18-
29/34%
1QFY2017
Industry
20% in FY2017E
Real Estate
Affordable Housing Launches surge across Top 8 cities
100%
1HFY2017
Cushman Wakefield
MoRTH has guided awarding target (from 10,000kms in
Roads & High.
150%
FY2016
Pib.nic.in
FY2016 to 25,000kms in FY2017E)
NHAI tendering pipeline stood at ~`65,000cr
19%
Aug-16
NHAI, Angel
New Initiative: Bharatmala Project to lead to strong
17,200kms
FY2016
Pib.nic.in
awarding
Expect finalization of `2.8tn of (Capital) Defence projects in
Defence
Multi-fold growth
CY2016
IHS Inc.
CY2016
New Initiative: 100 Smart Cities to create huge
Urban Infra
~`6 lakh cr
4QFY2016
Pib.nic.in
opportunities
New Initiative: Build 2cr Urban Houses, under the 'Housing
~`11 lakh cr
4QFY2016
Pib.nic.in
for All'
Combined retail loans of the top five pvt banks and three
Retail loan
housing finance companies reported a healthy growth of
19%
1QFY2017
company
growth
19% to `10.7 lac cr vs `9 lac cr in Q1FY16 indicating pick
up in consumption demand.
The organised dairy industry in India is estimated to have
Dairy
grown ~20% in FY2015 and as per industry reports will
20%
FY2015
IMARC
maintain the growth over next 5 years
Domestic passenger traffic has grown at 23% YoY (for the
Directorate General of
Aviation
23%
1HCY2016
first seven months of CY2016).
Civil Aviation
Foreign tourist arrivals increased 17.1% YoY for July 2016,
which improved hotel occupancy rates (6.4%). Further,
Pib.nic.in,
Hotels
6-7%
Jul-16
Revenue per average room increased by 9.6% for the same
STR
period
LED lighting market in India is projected to register a CAGR
LED Lighting
30%
TechSci Research report
of over 30%, during 2016-2021
Source: Company, Angel Research
September 7, 2016
4
Top Picks Report | September 2016
Exhibit 2: Historical Sensex EPS chart
Exhibit 3: One year forward sensex PE Chart
30.0
Sensex 1 year forward P/E
10 year Avg
1800
1600
25.4
25.0
1400
1200
18.7
20.0
1000
800
15.0
600
400
10.0
9.8
200
0
5.0
Source: Company, Angel Research
Source: Company, Angel Research
Exhibit 4: Top Picks
EPS
PER
EV/Sales
ROE
Company
Sector
Rating
CMP (`) Target (`) Upside (%) FY17E FY18E FY17E FY18E FY17E FY18E FY17E FY18E
Amara Raja
Auto Ancill.
Buy
1,018
1,174
15.3
35.3
43.5
28.8
23.4
3.1
2.5
25.9
26.0
BEL
Capital Goods
Buy
1,210
1,414
16.9
58.7
62.5
20.6
19.4
2.6
2.3
44.6
46.3
HCL Tech
IT
Buy
787
1,000
27.4
55.7
64.1
14.1
12.3
2.1
1.7
20.3
17.9
Infosys
IT
Buy
1,055
1,370
29.9
64.8
72.0
16.3
14.7
2.9
2.5
22.0
22.3
Bajaj Electricals
Cons. Durable Accumulate
272
306
12.5
11.4
14.6
23.9
18.6
0.5
0.5
13.4
15.1
Blue Star
Cons. Durable Accumulate
514
578
12.5
14.9
22.1
34.2
23.0
1.1
1.0
23.1
24.1
Dewan Housing
Financials
Buy
298
325
9.1
29.7
34.6
10.0
8.6
-
-
16.1
16.8
Equitas Holdings
Financials
Buy
182
235
29.5
5.8
8.2
31.4
22.2
-
-
10.9
11.5
Goodyear India
Tyre
Accumulate
601
684
13.8
49.4
52.6
12.2
11.4
0.5
0.5
18.2
17.0
IL&FS Transport.
Infra
Buy
76
93
22.4
8.1
9.1
9.4
8.3
3.6
3.3
4.2
5.0
Jagran Prakashan
Media
Buy
195
225
15.0
10.8
12.5
18.1
15.6
2.7
2.4
21.7
21.7
Mahindra Lifespace Real Estate
Buy
431
522
21.1
29.9
35.8
14.4
12.1
2.2
1.9
7.6
8.6
Navkar Corp.
Logistics
Buy
191
265
38.7
6.8
11.5
28.2
16.6
7.6
5.1
6.9
10.5
Radico Khaitan
Breweries & Dist.
Buy
102
125
22.0
6.3
7.4
16.1
13.8
1.3
1.2
8.6
9.3
Siyaram Silk Mills
Textile
Buy
1,281
1,469
15.0
104.9 122.4
12.2
10.5
0.9
0.8
16.4
16.4
TV Today
Media
Buy
300
363
21.0
18.4
21.4
16.3
14.0
2.5
2.0
17.4
17.2
Source: Angel Research
September 7, 2016
5
Top Picks Report | September 2016
Top Picks
September 7, 2016
6
Top Picks Report | September 2016
Stock Info
Amara Raja Batteries
CMP
1,018
Amara Raja Batteries Ltd (ARBL) is the second largest lead acid storage battery
TP
1,174
manufacturer in the country. It has been outpacing market leader Exide (ARBL
Upside
15.3%
grew at a 24% CAGR over FY2010-15 as compared to Exide's growth of 13%),
leading to its market share improving from 25% in FY10 to about 35%
Sector
Auto Ancillary
currently. ARBL's outperformance has been mainly on back of its association
Market Cap (` cr)
17,387
with global battery leader Johnson Controls Inc (which also holds 26% stake in
Beta
0.8
ARBL) for manufacturing ducts.
52 Week High / Low
1,077 / 773
With the automotive OEMs following a policy of having multiple vendors and
with ARBL’s products enjoying a strong brand recall in the replacement
segment, the company is well poised to gain further market share. Given the
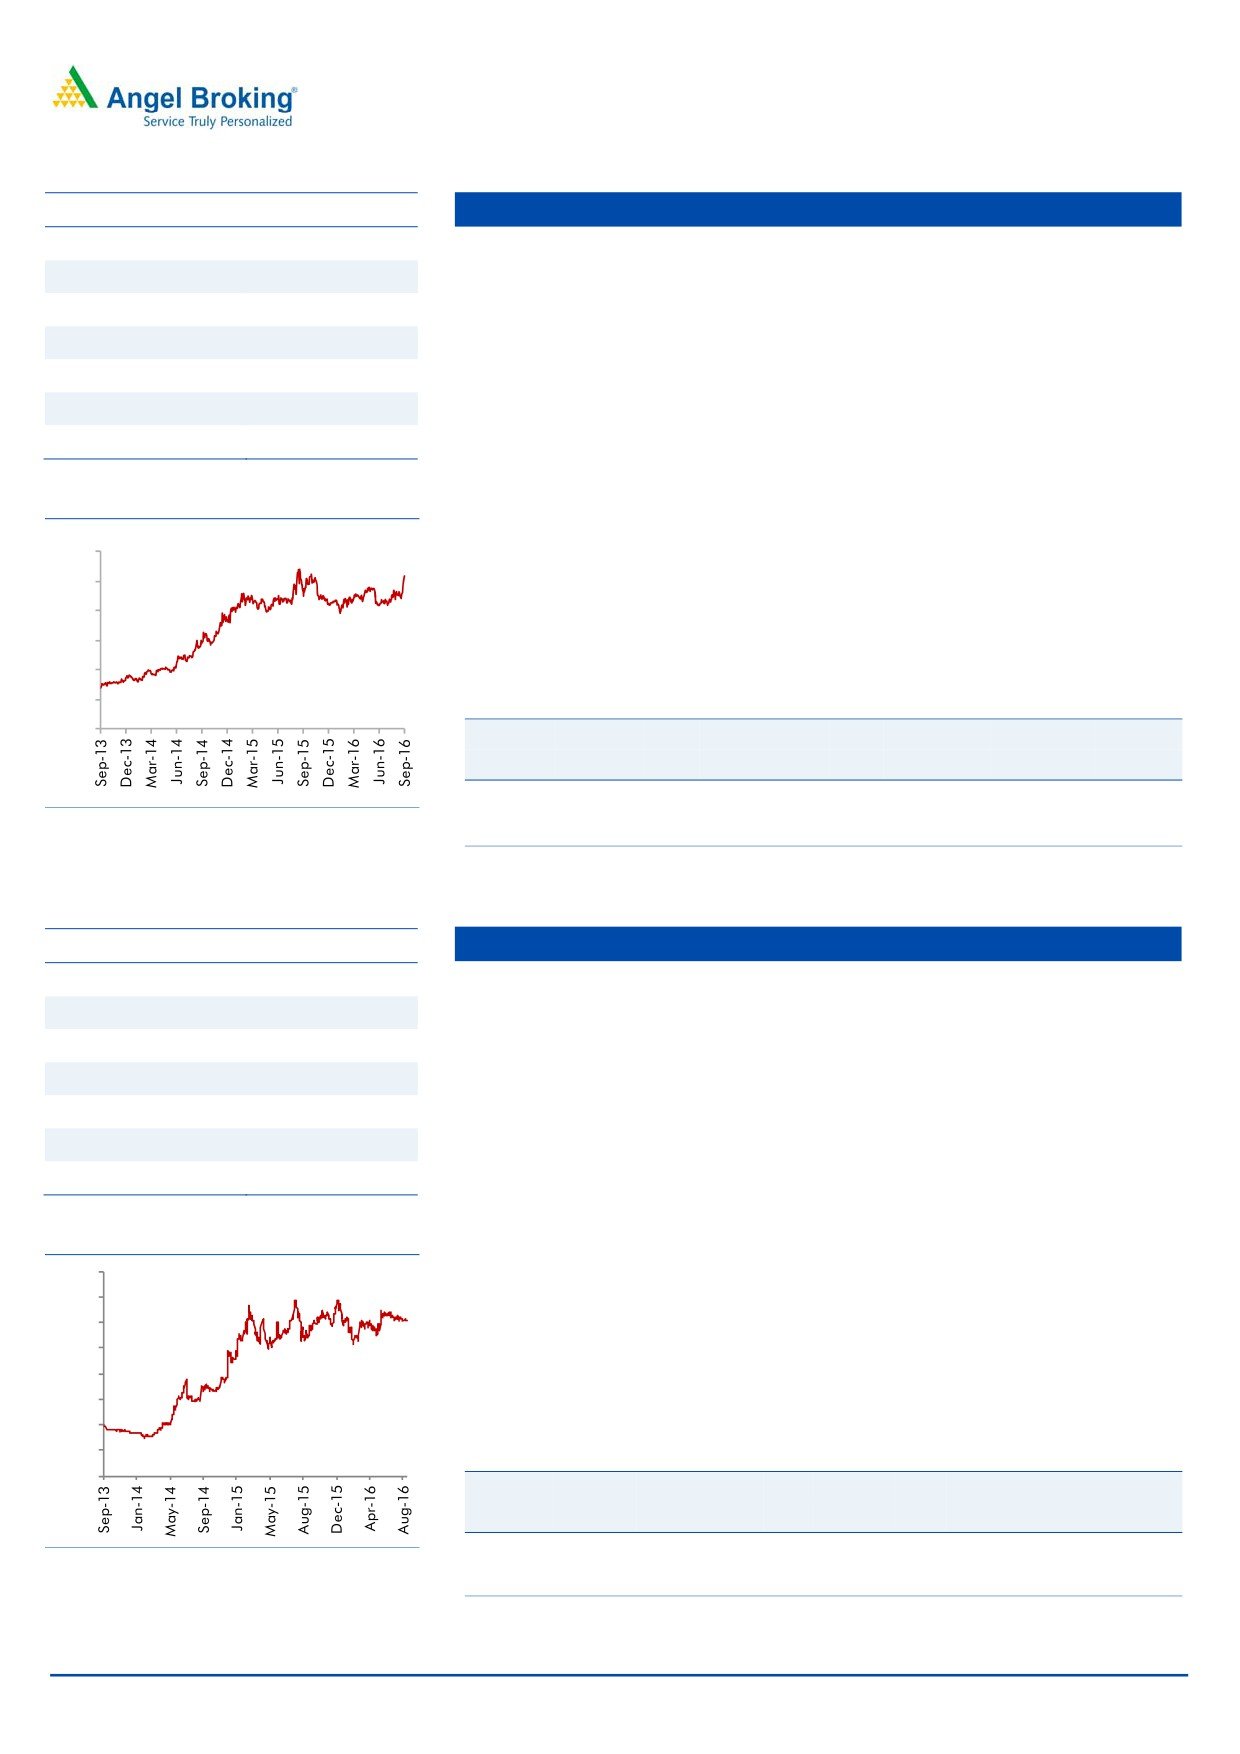
3 year-Chart
economic recovery and market share gains, the company is expected to grow at
a CAGR of 18% over the next two years as against industry growth of 10-12%.
1200
1000
ARBL is a well diversified auto ancillary player having presence across the
800
automotive and the industrial segment. It has a broad OEM as well as
replacement customer base. We believe ARBL is a high quality stock to play
600
the auto sector revival. We maintain our Buy rating on the stock.
400
200
Key Financials
0
Y/E
Sales
OPM PAT EPS ROE P/E P/BV EV/EBITDA EV/Sales
March
(` cr)
(%)
(` cr)
(`)
(%)
(x)
(x)
(x)
(x)
FY2017E
5,429
17.5
604
35.3
25.9
28.8
6.6
15.8
3.1
Source: Company, Angel Research
FY2018E
6,471
17.6
742
43.5
26.0
23.4
5.4
13.0
2.5
Source: Company, Angel Research
Stock Info
Bharat Electronics (BEL)
CMP
1,210
High priority to the defense sector in the government’s ‘Make in India’
TP
1,414
campaign, with (1) emphasis on indigenization, (2) increase in FDI limits from
26% to 49%, and (3) over $50bn worth of projects cleared by Defense
Upside
16.9%
Acquisition Council (DAC) in the last 26 months, indicate at the sector being at
Sector
Capital Goods
an inflexion point where Indian defense capex cycle is entering a new era of
Market Cap (` cr)
29,039
growth. The current bid pipeline could lead to strong award activity for the
next few years and BEL could emerge as a beneficiary.
Beta
1.1
BEL in FY2016 had ~35% market share in the defense electronics space.
52 Week High / Low
1,417 / 983
Considering (1) bid-pipeline of Indian Air Force and Navy’s platform projects,
which have high defense electronic component, (2) BEL’s in-house R&D
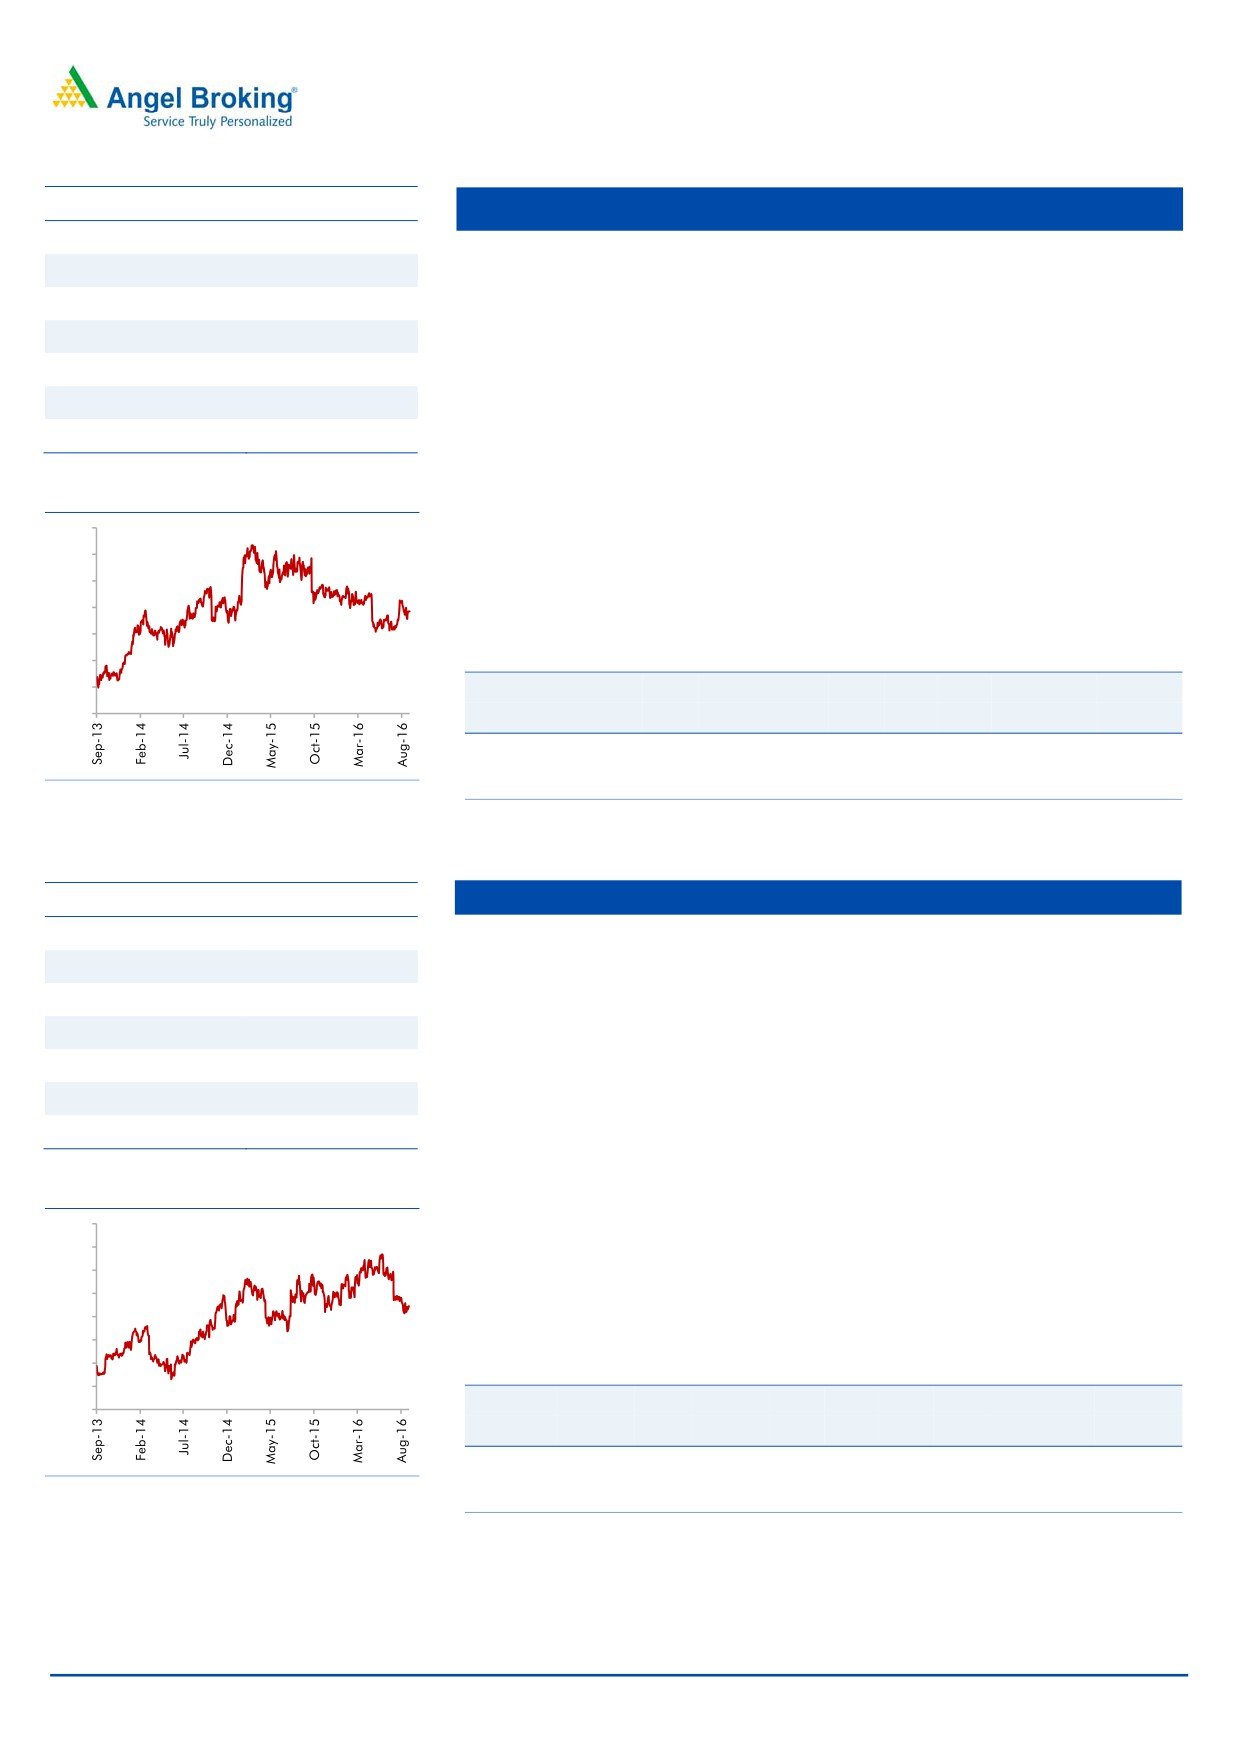
3 year-Chart
capabilities, and (3) its zero debt status, we believe that BEL would maintain its
1,600
strong market positioning in the defense electronics space.
1,400
We expect BEL to trade at a premium to its historical valuations on account of
1,200
uptick in investment cycle. Current low competitive intensity which should
1,000
enable BEL to justifiably command scarcity premium, coupled with the fact that
800
the company is the largest listed defense player, makes the stock more
600
attractive. We maintain BUY rating on the stock with price target of `1,414.
400
200
Key Financials
0
Y/E
Sales
OPM PAT EPS Adj. ROE P/E P/BV EV/EBITDA EV/Sales
March
(` cr)
(%)
(` cr)
(`)
(%)
(x)
(x)
(x)
(x)
FY2017E
8,137
16.8
1,410
58.7
44.6
20.6
3.2
15.7
2.6
Source: Company, Angel Research
FY2018E
9,169
17.2
1,499
62.5
46.3
19.4
2.8
13.7
2.3
Source: Company, Angel Research
September 7, 2016
7
Top Picks Report | September 2016
Stock Info
HCL Technologies
CMP
787
Healthy pipeline: The company’s engineering services has been seeing lumpy
TP
1,000
growth over the last few quarters. This is however largely a function of the
Upside
27%
timing of large transformational deals. 6-8 of the large deals signed a few
Sector
IT
quarters ago will aid the company to continue to post industry leading growth.
We expect HCL Tech to post a USD and INR revenue CAGR of 16.3% and
Market Cap (` cr)
111,012
18.0%, respectively, over FY2016-18E (inclusive of the acquisition of
Beta
0.8
Geometric Software and the Volvo deal).
52 Week High / Low
986 / 707
Robust outlook: For FY2017 revenues are expected to grow between 12.0-
14.0% in CC. Revenue guidance is based on FY2016 (April to March’2016)
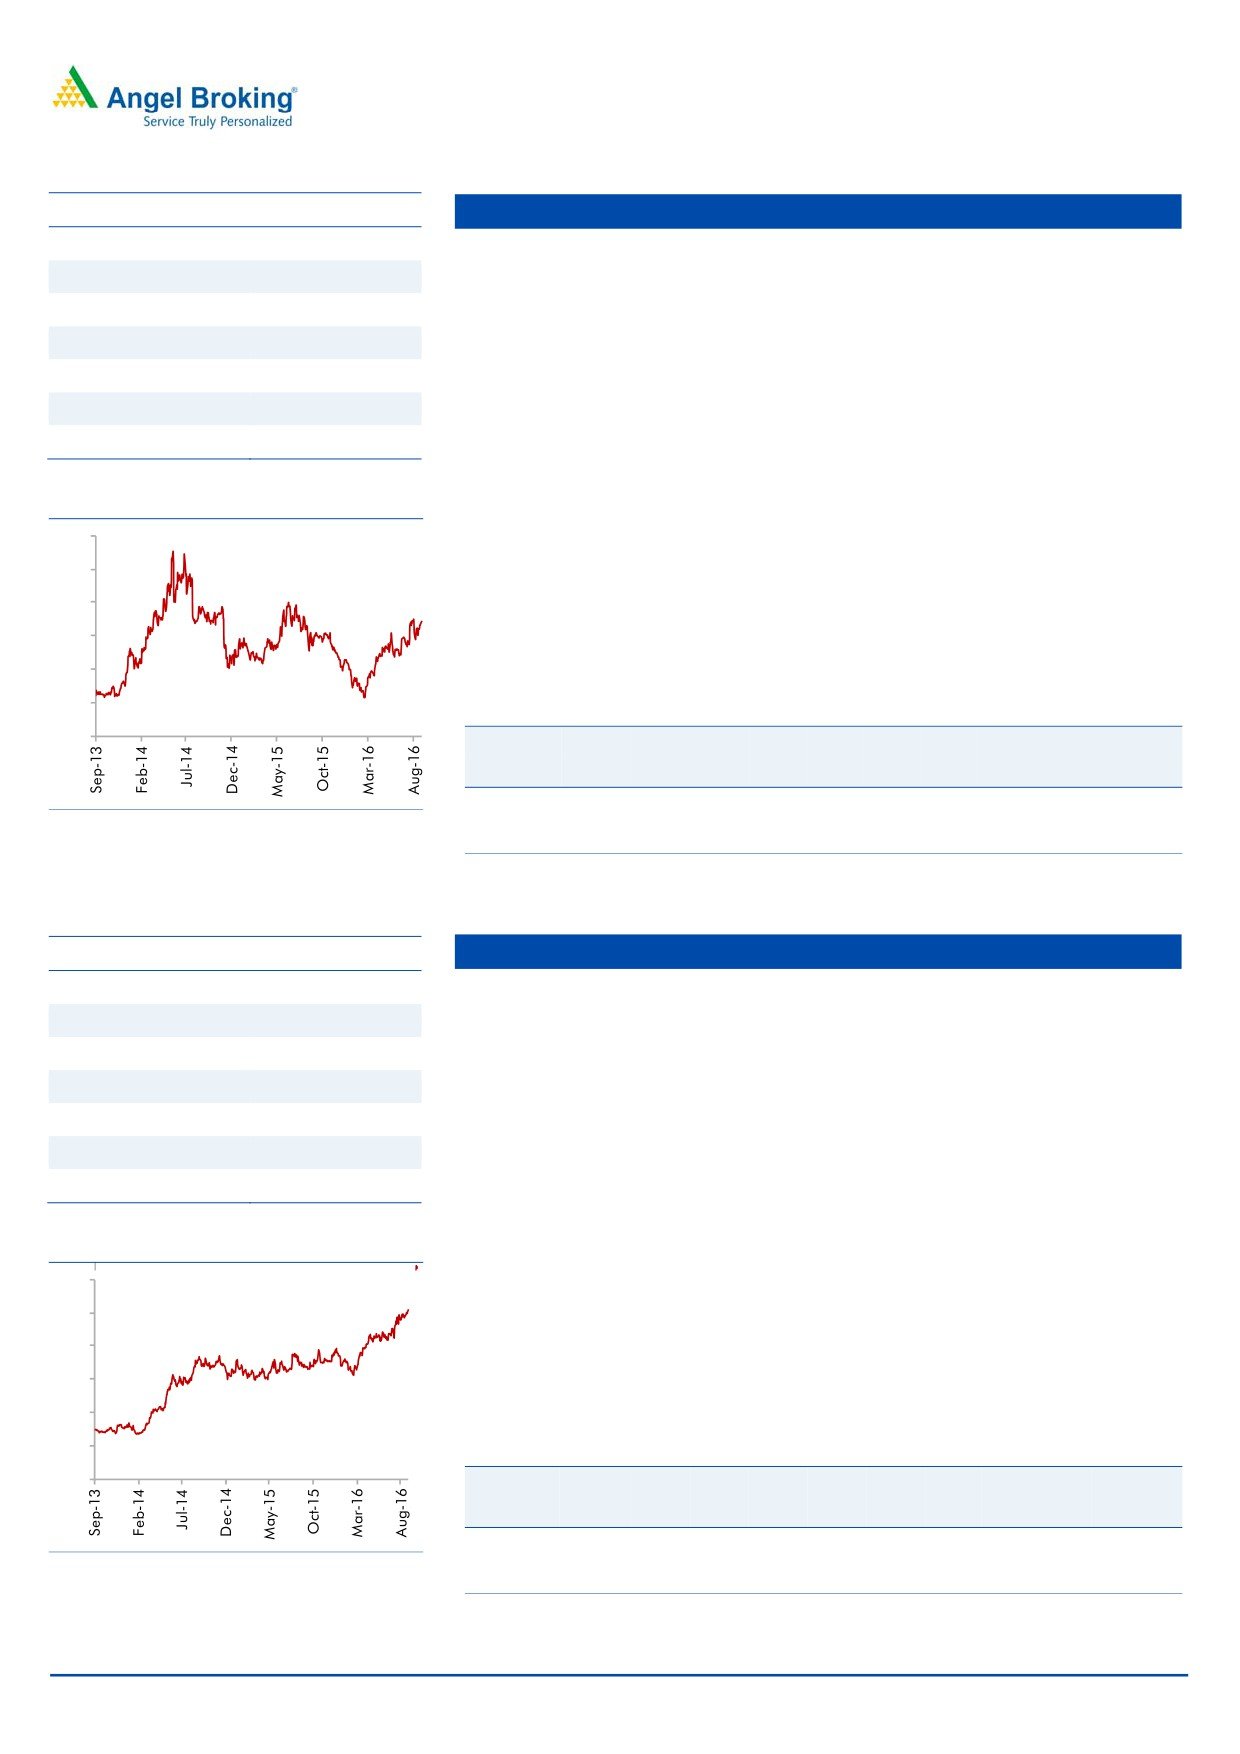
3 year-Chart
average exchange rates. The above constant currency guidance translates to
1,100
11.2% to 13.2% growth in US$ terms.
1,000
900
Outlook and Valuations: The stock is attractively valued at the current market
800
price and hence we maintain our Buy with a price target of `1,000.
700
600
Key Financials
500
Y/E
Sales
OPM PAT EPS ROE P/E P/BV EV/EBITDA EV/Sales
400
June
(`cr)
(%)
(`cr)
(`)
(%)
(x)
(x)
(x)
(x)
FY2017E
49,242
20.5
7,862
55.7
20.3
14.1
2.9
7.6
2.1
FY2018E
57,168
20.5
9,037
64.1
17.9
12.3
2.2
5.6
1.7
Source: Company, Angel Research
Source: Company, Angel Research
Stock Info
Infosys
CMP
1,055
Strong revenue guidance for FY17: The Management has guided towards
TP
1,370
higher revenue growth for FY2017, ie of 11.5-13.5% in CC terms and 12.7-
Upside
30%
14.7% in INR terms (exchange rate as on March 31, 2016). For FY2016, the
company posted a 13.3% growth in CC terms V/s a guidance of 12.8-13.2%
Sector
IT
growth (in CC). We expect the company to post ~13.0% USD revenue growth
Market Cap (` cr)
242,328
in FY2017.
Beta
0.8
Aims to be US$20bn company by FY20: The company expects its revenue to
52 Week High / Low
1,278 / 1,009
rise to US$20bn by FY2020, up from US$8.7bn in FY2015, as it focuses on
acquisitions and winning more new technology services, implying a
14%
3 year-Chart
CAGR over the period. Over the near term, we expect Infosys to post a 13.0%
1,400
USD revenue growth in FY2017. Over FY2016-18E, we expect USD and INR
1,300
revenue to grow at a CAGR of 13.0% and 13.0%, respectively.
1,200
1,100
Outlook and Valuations: The stock trades at a valuation of 15.1x FY2018E
1,000
earnings. We recommend Buy on the stock with a price target of `1,370.
900
800
Key Financials
700
Y/E
Sales
OPM PAT EPS ROE P/E P/BV EV/EBITDA EV/Sales
600
March
(` cr)
(%)
(` cr)
(`)
(%)
(x)
(x)
(x)
(x)
FY2017E
69,934
27.5
14,886
64.8
22.2
16.3
3.6
10.8
2.9
Source: Company, Angel Research
FY2018E
79,025
27.5
16,529
72.0
22.3
14.7
3.3
9.3
2.5
Source: Company, Angel Research
September 7, 2016
8
Top Picks Report | September 2016
Stock Info
Bajaj Electricals
CMP
272
The company is among the top 4 players in the consumer durables space
TP
306
across all its product categories (leader in small appliances; number-4 in fans
Upside
12.5%
and lighting). It has a strong distribution reach with 4,000 distributors
Sector
Cons. Durable
reaching out to 400,000 retailers.
Market Cap (` cr)
2,747
In the 3 years preceding FY2016, the company’s E&P segment had been
Beta
0.9
underperforming owing to cost overruns and delays in project executions.
However, the segment has turned around in FY2016 on the profitability front
52 Week High / Low
280 / 155
and delivered a healthy EBIT margin of ~6% for the year. Currently the
segment’s order book stands at `2,480cr.
3 year-Chart
With expectation of timely execution of new projects in the E&P segment and
400
with the Lighting and Consumer Durables segments expected to benefit from
350
an improvement in consumer sentiments going forward, we expect the
300
company’s top-line to grow at a CAGR of ~12% to `5,805cr and bottom-line
250
to grow at a CAGR of 24% to `147cr over FY2016-FY2018E. We recommend
200
a Buy rating on the stock.
150
Key Financials
100
Y/E
Sales OPM PAT EPS ROE P/E P/BV EV/EBITDA EV/Sales
March
(` cr)
(%)
(` cr)
(`)
(%)
(x)
(x)
(x)
(x)
FY2017E
5,099
5.6
115
11.4
13.4
23.9
3.2
9.8
0.5
Source: Company, Angel Research
FY2018E
5,805
5.9
147
14.6
15.1
18.6
2.8
8.2
0.5
Source: Company, Angel Research
Stock Info
Blue Star
CMP
514
BSL is one of the largest air-conditioning companies in India. With a mere
TP
578
3% penetration level of ACs vs 25% in China, the overall outlook for the room
Upside
12%
air-conditioner (RAC) market in India is favourable.
Sector
Cons. Durable
BSL’s RAC business has been outgrowing the industry by ~10% points over the
Market Cap (` cr)
4,898
last few quarters, resulting in the company consistently increasing its market
share (~7% in FY2014 to 10.5% at present). This has resulted in the Cooling
Beta
0.6
Products Division (CPD)'s share in overall revenues increasing from~23% in
52 Week High / Low
517 / 306
FY2010 to ~42% in FY2016 (expected to improve to ~47% in FY2018E). With
strong brand equity and higher share in split ACs, we expect the CPD to
3 year-Chart
continue to drive growth.
600
Aided by increasing contribution from the CPD, we expect the overall top-line
500
to post a revenue CAGR of ~15% over FY2016-18E and margins to improve
400
from 5.7% in FY2015 to 7.1% in FY2018E. Moreover, the merger of Blue Star
300
Infotech has infused cash and strengthened the balance sheet. We have an
Accumulate recommendation on the stock.
200
100
Key Financials
0
Y/E
Sales OPM PAT EPS ROE P/E P/BV EV/EBITDA EV/Sales
March
(` cr)
(%)
(` cr)
(`)
(%)
(x)
(x)
(x)
(x)
FY2017E
4,283
5.9
142
14.9
23.1
34.2
6.8
20.1
1.1
Source: Company, Angel Research
FY2018E
5,077
7.3
211
22.1
24.1
23.0
5.8
13.6
1.0
Source: Company, Angel Research
September 7, 2016
9
Top Picks Report | September 2016
Stock Info
Dewan Housing
CMP
298
3rd largest private sector housing finance company: We expect DHFL’s AUM to
TP
325
grow at a CAGR of 21% over FY2016-18, as demand for housing in the middle
Upside
9.1%
and low income group picks up, while PAT CAGR is expected to be 22%.
Sector
Financials
Seasoned and granular loan book with stable asset quality: Individual
borrowers account for 72%, while the high yielding loan against property (LAP)
Market Cap (` cr)
8,662
+SME and projects loans account for 19% and 9% of advances respectively. Despite
Beta
1.6
strong loan growth, the GNPAs and NNPAs are likely to be at ~1.17% and 0.82%,
52 Week High / Low
299 / 141
respectively, for FY2017. We don’t expect any major deterioration in the asset
quality going ahead.
3 year-Chart
Lower cost of funds will help maintain NIM: Nearly 70% of the bank
350
borrowings are due for maturity over the next three years and swapping a part
300
of that with non-convertible debentures (NCDs), where it has ~100bp cost
250
benefit, will help DHFL in maintaining its NIM at ~2.9%.
Outlook: We expect the company to post a healthy loan book CAGR of 21%
200
over FY2015-18E, which is likely to translate in an earnings CAGR of 22%,
150
over the same period. The stock currently trades at 1.4x FY2018E ABV. We
100
maintain Buy on the stock, with a target price of `325.
50
-
Key Financials
Y/E
Op. Inc NIM
PAT
EPS
ABV ROA ROE P/E P/ABV
March
(` cr)
(%)
(` cr)
(`)
(`)
(%)
(%)
(x)
(x)
FY2017E
2,225
2.9
866
29.7
184.0
1.1
16.1
10.0
1.6
Source: Company, Angel Research
FY2018E
2,688
2.9
1,084
34.6
215.3
1.2
16.8
8.6
1.4
Source: Company, Angel Research
Equitas Holdings
Stock Info
CMP
182
Early mover advantage in the SFB category: Equitas was one of the ten NBFCs
TP
235
to get the license to start a small finance bank (SFB). As the entire book of
Upside
29.1%
Equitas qualifies for PSL, meeting the 75% PSL target will not be a challenge.
Sizeable and diversified loan book will keep it ahead of other upcoming SFBs.
Sector
Financials
Asset quality and return ratios are likely to remain stable: Equitas will have to
Market Cap (` cr)
6,123
maintain CRR & SLR going ahead; hence yield on total assets is likely to come
Beta
0.9
down. However, as a bank it will be able to raise deposits and hence there will
52 Week High / Low
206 / 134
be reduction in cost of funds. As a result, spreads may not decline much which
in turn will help in maintaining the ROE & ROA which although could undergo
a marginal decline. Also we don’t expect any major deterioration in the asset
3 year-Chart
quality going ahead.
220
210
NIM likely to remain healthy: Equitas will be able to take deposits after it
200
formally starts banking operations leading to ~250bp reduction in cost of
190
funds. Hence we expect the NIM to remain strong at ~11%, going ahead.
180
Outlook: We expect the company to post a strong loan book & earnings
170
160
CAGR of 38% & 37% over FY2016-18E. The stock currently trades at 2.3x
150
FY2018E BV. We maintain Buy on the stock, with a target price of `235.
140
130
120
Key Financials
Y/E
Op. Inc NIM
PAT
EPS
ABV ROA ROE P/E P/ABV
March
(` cr)
(%)
(` cr)
(`)
(`)
(%)
(%)
(x)
(x)
FY2017E
1,076
11.7
224
6.7
68.2
2.8
12.4
31.4
2.7
Source: Company, Angel Research
FY2018E
1,465
11.4
315
9.4
77.6
2.8
12.9
22.2
2.3
Source: Company, Angel Research
September 7, 2016
10
Top Picks Report | September 2016
Stock Info
Goodyear India
CMP
601
Normal monsoon to energize stagnant tractor demand: Goodyear India (GIL)
TP
684
is a leader in the tractor tyre segment in India with tractor tyres accounting for
Upside
14%
~50% of its overall revenues. GIL’s performance on the top-line front has
Sector
Tyres
been under pressure on account of below par monsoon over the past two
years. As tractor sales have strong correlation with monsoons, the normal
Market Cap (` cr)
1,386
monsoon this year should translate into a higher demand for tractor tyres.
Beta
0.6
Strong finances and Balance Sheet: GIL is a debt free-cash rich company with
52 Week High / Low
609 / 443
RoIC estimated at ~84% for FY2018. The company’s cash and equivalents
are `334cr for FY2016, which amount to ~28% of the current market cap.
3 year-Chart
Outlook and valuation: On an adjusted basis (for FY end March), we expect
800
the top-line to post a CAGR of 7.5% over FY2016-18E to `1,704cr mainly on
700
account of rebound in tractor tyre volumes and expect net profit to improve to
600
`121cr in FY2018E. At the current market price, the stock is trading at a PE of
500
10.0x its FY2018E earnings. We have a Buy rating on the stock and assign a
400
target price of `631 based on a target PE of 12.0x for FY2018E.
300
200
100
Key Financials
0
Y/E
Sales
OPM PAT EPS ROE P/E P/BV EV/EBITDA EV/Sales
March
(` cr)
(%)
(` cr)
(`)
(%)
(x)
(x)
(x)
(x)
FY2017E
1,598
10.4
114
49.4
18.2
12.2
1.8
4.3
0.5
FY2018E
1,704
10.2
121
52.6
17.0
11.4
1.6
3.6
0.5
Source: Company, Angel Research
Source: Company, Angel Research
Stock Info
IL&FS Transportation Networks
CMP
76
ITNL reported commercial operations date (CoD) for JSEL and PSRDCL. Also,
TP
93
completion certificate was issued for BKEL. TRDCL P-III and CNTL are expected
Upside
22.4%
to commence in the next few months. Further, RIDCRO P-III, KSEL, KNEL, and
BAEL are expected to commence operations in next few months. Accordingly,
Sector
Construction
we expect revenue from these projects to increase by ~`4cr/day (unadj. for
Market Cap (` cr)
2,497
stake).
Beta
1.0
Strategic initiatives like stake sale at SPV level, listing of operational BOT
52 Week High / Low
145/64
projects under InvITs, and re-financing of BOT projects should help the
company unlock value. Money raised from these initiatives could be used to
3 year-Chart
lower debt and improve the profitability.
300
With 7+ projects expected to commence in the next 12 months, we expect the
250
debt repayment cycle at SPV level to commence, resulting in the overall consol.
200
D/E levels peaking out at ~4.0x. With concerns over higher D/E levels allayed
to a certain extent, coupled with the attractive valuations of 0.3x FY2017E
150
P/BV multiple that the ITNL stock is trading at, we maintain our Buy on the
100
stock with price target of `93.
50
Key Financials
0
Y/E
Sales
OPM PAT EPS ROE P/E P/BV EV/EBITDA EV/Sales
March
(` cr)
(%)
(` cr)
(`)
(%)
(x)
(x)
(x)
(x)
FY2017E
8,946
31.0
266
8.1
4.2
9.4
0.3
11.6
3.6
Source: Company, Angel Research
FY2018E
10,017
31.6
299
9.1
5.0
8.3
0.3
10.5
3.3
Source: Company, Angel Research
September 7, 2016
11
Top Picks Report | September 2016
Stock Info
Jagran Prakashan
CMP
195
We expect JPL to register a net sales CAGR of ~12% over FY2016-18E, on
TP
225
back of (a) strong growth in advertising revenue due to improvement in GDP
growth, and (b) improvement in circulation revenue owing to combination of
Upside
15%
increase in cover price and volume growth.
Sector
Media
Further the acquisition of Radio City would also boost the company's revenue
Market Cap (` cr)
6,378
going ahead. Radio City has ~20 stations across 7 states in the country and is
second only to ENIL in all its operating circles, ie Delhi, Mumbai, Bengaluru,
Beta
0.6
Chennai, Ahmedabad, Hyderabad, Pune and Lucknow. The company covers
52 Week High / Low
200/126
~51% (~66mn people) of the total radio population.
Raw material prices have been in a declining trend. Thus, considering lower
3 year-Chart
news print costs, healthy sales, and higher margins in the radio business, we
250
expect an adj. net profit CAGR of ~12% over FY2016-18E to `409cr.
Considering Dainik Jagran's strong presence in the rapidly growing Hindi
200
markets, we expect JPL to benefit from an eventual recovery in the Indian
150
economy. Hence, we maintain an Accumulate rating on the stock with a target
price of `225.
100
Key Financials
50
Y/E
Sales
OPM PAT EPS ROE P/E P/BV EV/EBITDA EV/Sales
0
March
(` cr)
(%)
(` cr)
(`)
(%)
(x)
(x)
(x)
(x)
FY2017E
2,355
28.0
353
10.8
21.7
18.1
3.9
9.2
2.7
FY2018E
2,635
28.0
409
12.5
21.7
15.6
3.4
8.0
2.4
Source: Company, Angel Research
Source: Company, Angel Research
Mahindra Lifespace
Stock Info
CMP
431
Speedy execution & speedier sales: MLF has 13 projects under implementation
TP
522
across cities. MLF has exhibited fast completion of projects (4-4.5 years in
Mumbai, other-wise 3-3.5 years across other cities), compared to others. Sales
Upside
21.1%
cycle in ~65% of projects is faster than execution cycle, contrary to industry
Sector
Real Estate
trends. This fast execution and sales is optimal, as it helps MLF in revenue
recognition, inventory cycle (better than Oberoi, DLF), cash flows and
Market Cap (` cr)
1,770
profitability. This translates in creating a virtuous cycle of continuous fast growth.
Beta
0.4
Strong revenue growth visibility in short-to-long run: MLF as of 4QFY2016 is
52 Week High / Low
559 / 415
pursuing ~4.0mn sq. ft. of sale of the total ~15.0mn sq. ft. of saleable area.
Having sold ~60% of ongoing projects, we expect MLF to launch ~2.8mn
3 year-Chart
sq.ft. of saleable area in rational way during 4QFY2016-2QFY2018E, across
6 cities. Maturity at existing projects, new launches give better revenue visibility
650
for medium-term. Further, MLF is sitting on land bank of 11.0mn sq.ft across
600
4 cities, which allays any concern over long-term revenue growth.
550
With Real Estate Regulatory Bill closer to reality, MLF should be minimally
500
impacted, given their strong parentage and ethically implemented processes.
450
In the longer-term organized, professionally run, well funded players would
400
enjoy strong trust due to their reliable and fast execution strategies. With
350
improvement in company’s fundamentals, strong earnings growth visibility
300
and long-term growth outlook, at current valuations of 1.1x FY2017E P/BV,
MLF looks attractive. We maintain BUY on MLF with target price of `554.
Key Financials
Source: Company, Angel Research
Y/E
Sales
OPM PAT EPS ROE P/E P/BV EV/EBITDA EV/Sales
March
(` cr)
(%)
(` cr)
(`)
(%)
(x)
(x)
(x)
(x)
FY2017E
1,152
22.7
75
29.9
4.9
14.4
1.1
15.7
2.2
FY2018E
1,300
24.6
138
35.8
8.5
12.1
1.0
10.1
1.9
Source: Company, Angel Research
September 7, 2016
12
Top Picks Report | September 2016
Stock Info
Navkar
CMP
191
NCL is one of the largest and one of the three CFS at JNPT with rail
TP
265
connectivity, helping it garner high market share at the port. NCL is in a massive
Upside
39%
expansion mode where it is increasing its capacity by 234% to 1,036,889 TEUs
at JNPT and coming up with an ICD at Vapi (with Logistics Park).
Sector
Logistics
Market Cap (` cr)
2,721
The ICD with rail link should benefit from first mover advantage in a region
that has huge market potential and accounts for ~27% of volumes at JNPT.
Beta
0.6
The ICD should be able to capture the EXIM volumes from the region through
52 Week High / Low
224 / 151
rail link that till now was being custom cleared at JNPT (Import) or being
transported via road and consolidated at JNPT (Export). South Gujarat
3 year-Chart
volumes will now head straight to the Vapi ICD; thus the company can now
240
cater to bulk commodities and domestic traffic that it had been rejecting owing
220
to capacity constraints at CFS.
200
We expect NCL to successfully use its rail advantage and scale up its
utilizations at both JNPT and Vapi ICD. We have a Buy rating on the stock.
180
160
Key Financials
140
Y/E
Sales
OPM PAT EPS ROE P/E P/BV EV/EBITDA EV/Sales
120
March
(` cr)
(%)
(` cr)
(`)
(%)
(x)
(x)
(x)
(x)
FY2017E
408
42.9
97
6.8
6.9
28.2
2.0
18.8
7.6
FY2018E
612
42.3
164
11.5
10.5
16.6
1.8
12.7
5.1
Source: Company, Angel Research
Source: Company, Angel Research
Stock Info
Radico Khaitan
CMP
102
The IMFL segment is under penetrated. Going forward, increase in income
TP
125
levels would lead to higher growth in IMFL brands. RKL has strong brands in
Upside
22%
the premium liquor category which reported a CAGR of ~26% over the last
seven-year period. We expect the growth momentum to continue.
Sector
Breweries & Distilleries
Market Cap (` cr)
1,355
We expect the price of ENA, a key raw material, to remain stable and
potentially even decline going forward due to higher sugar production and
Beta
0.8
lower demand for ethanol from Indian oil marketing companies
52 Week High / Low
131/82
We expect a significant hike in liquor prices in the coming financial year as
there haven't been any significant ones in recent times. Also, we believe that
3 year-Chart
industry leader - United Spirits would shift focus on profitability over volume
180
growth considering the debt on its balance sheet, which in turn, would lead to
160
increased scope for other liquor companies to hike prices.
140
On valuation basis, Radico is trading at huge discount to its close peer United
120
Spirits. We have a Buy rating on the stock and target price of
`125
100
(18x FY2018E EPS)
80
Key Financials
60
Y/E
Sales
OPM PAT EPS ROE P/E P/BV EV/EBITDA EV/Sales
March
(` cr)
(%)
(` cr)
(`)
(%)
(x)
(x)
(x)
(x)
FY2017E
1,659
13.0
84
6.3
8.6
16.1
1.4
8.9
1.3
Source: Company, Angel Research
FY2018E
1,802
13.2
98
7.4
9.3
13.8
1.3
8.0
1.2
Source: Company, Angel Research
September 7, 2016
13
Top Picks Report | September 2016
Siyaram Silk Mills
Stock Info
CMP
1,281
SSML has strong brands which cater to premium as well as popular mass
TP
1,469
segments of the market. Further, in FY2014, SSML entered the ladies' salwar
Upside
15.0%
kameez and ethnic wear segment. Going forward, we believe that the company
would be able to leverage its brand equity and continue to post strong performance.
Sector
Textile
Market Cap (` cr)
1,201
The company has a nationwide network of about 1,600 dealers and business
partners. It has a retail network of 160 stores and plans to add another
Beta
0.8
300-350 stores going forward. Further, the company's brands are sold across
52 Week High / Low
1,353/896
3,00,000 multi brand outlets in the country.
Going forward, we expect SSML to report a net sales CAGR of ~12% to
3 year-Chart
~`2,040cr and adj.net profit CAGR of ~14% to `115cr over FY2016-18E on
1,600
back of market leadership in blended fabrics, strong brand building, wide
1,400
distribution channel, strong presence in tier II and tier III cities and emphasis
1,200
on latest designs and affordable pricing points. At the current market price,
1,000
SSML trades at an inexpensive valuation. We have a Buy rating on the stock
800
600
and target price of `1,469.
400
200
Key Financials
0
Y/E
Sales
OPM PAT EPS ROE P/E P/BV EV/EBITDA EV/Sales
March
(` cr)
(%)
(` cr)
(`)
(%)
(x)
(x)
(x)
(x)
FY2017E
1,799
11.6
98
104.9
16.4
12.2
2.0
6.4
0.9
Source: Company, Angel Research
FY2018E
2,040
11.7
115
122.4
16.4
10.5
1.7
5.5
0.8
Source: Company, Angel Research
TV Today Network
Stock Info
CMP
300
TTNL enjoys a strong viewership ranking in the Hindi and English news
TP
363
channel categories. The company’s Hindi news channel - Aaj Tak has
maintained its market leadership position occupying the No.1 rank for several
Upside
21%
consecutive years in terms of viewership. Its English news channel - India
Sector
Textile
Today too has been continuously gaining viewership; it has now captured the
Market Cap (` cr)
1,790
No. 2 ranking from No. 4 earlier. Its other channels like Dilli Aaj Tak and Tez
Beta
1.3
are also popular among viewers.
52 Week High / Low
351 /205
Out of the 7 radio stations, TTNL has sold off 4 (Jodhpur, Amritsar, Patiala
and Shimla) for `4cr. The remaining 3 stations are in the process of getting
3 year-Chart
sold off to ENIL but the sale will have to wait until concerns raised by the MIB
400
are resolved. Going forward, we expect them to be sold off and this would
350
prop up the company’s profitability.
300
We expect TTNL to report a net revenue CAGR of ~16% to ~`743cr and net
250
profit CAGR of ~16% to `128cr over FY2016-18E. We have a Buy rating on
200
the stock and target price of `363.
150
100
50
Key Financials
0
Y/E
Sales
OPM PAT EPS ROE P/E P/BV EV/EBITDA EV/Sales
March
(` cr)
(%)
(` cr)
(`)
(%)
(x)
(x)
(x)
(x)
FY2017E
637
27.5
110
18.4
17.4
16.3
2.8
8.7
2.5
Source: Company, Angel Research
FY2018E
743
27.5
128
21.4
17.2
14.0
2.4
7.1
2.0
Source: Company, Angel Research
September 7, 2016
14
Top Picks Report | September 2016
Macro watch
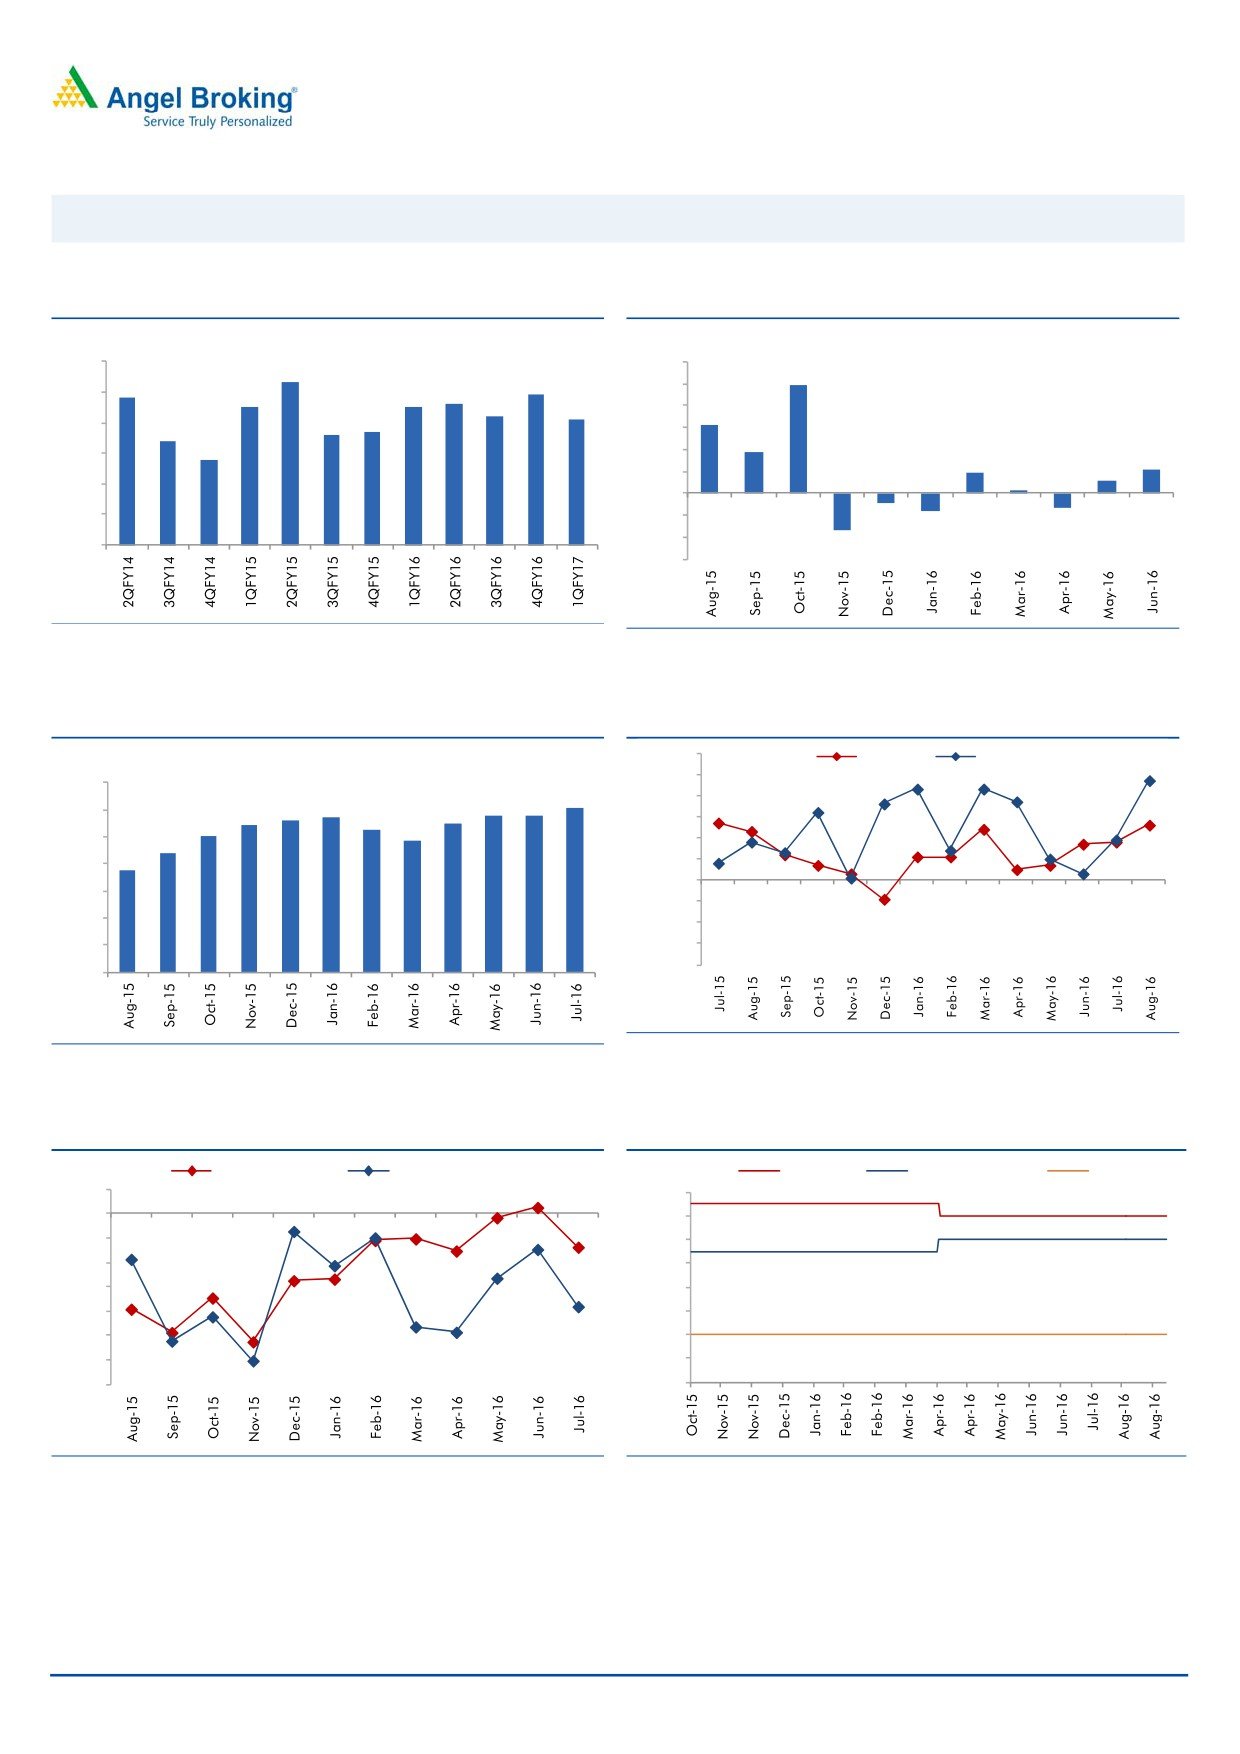
Exhibit 1: Quarterly GDP trends
Exhibit 2: IIP trends
(%)
(%)
9.0
8.3
12.0
9.9
7.8
7.9
10.0
8.0
7.5
7.5
7.6
7.2
7.1
8.0
6.3
6.6
6.7
7.0
6.4
6.0
3.7
5.8
6.0
4.0
1.9
2.1
1.1
2.0
0.3
5.0
-
4.0
(2.0)
(0.9)
(1.3)
(1.6)
(4.0)
3.0
(3.4)
(6.0)
Source: CSO, Angel Research
Source: MOSPI, Angel Research
Exhibit 3: Monthly CPI inflation trends
Exhibit 4: Manufacturing and services PMI
56.0
Mfg. PMI
Services PMI
(%)
55.0
7.0
6.1
5.7
5.8
5.8
54.0
5.6
5.5
6.0
5.4
5.3
5.0
53.0
4.8
5.0
4.4
52.0
3.7
51.0
4.0
50.0
3.0
49.0
2.0
48.0
1.0
47.0
46.0
-
Source: Market, Angel Research; Note: Level above 50 indicates expansion
Source: MOSPI, Angel Research
Exhibit 5: Exports and imports growth trends
Exhibit 6: Key policy rates
(%)
Exports yoy growth
Imports yoy growth
(%)
Repo rate
Reverse Repo rate
CRR
5.0
7.00
0.0
6.50
(5.0)
6.00
(10.0)
5.50
(15.0)
5.00
(20.0)
4.50
(25.0)
4.00
(30.0)
3.50
(35.0)
3.00
Source: Bloomberg, Angel Research
Source: RBI, Angel Research
September 7, 2016
15
Top Picks Report | September 2016
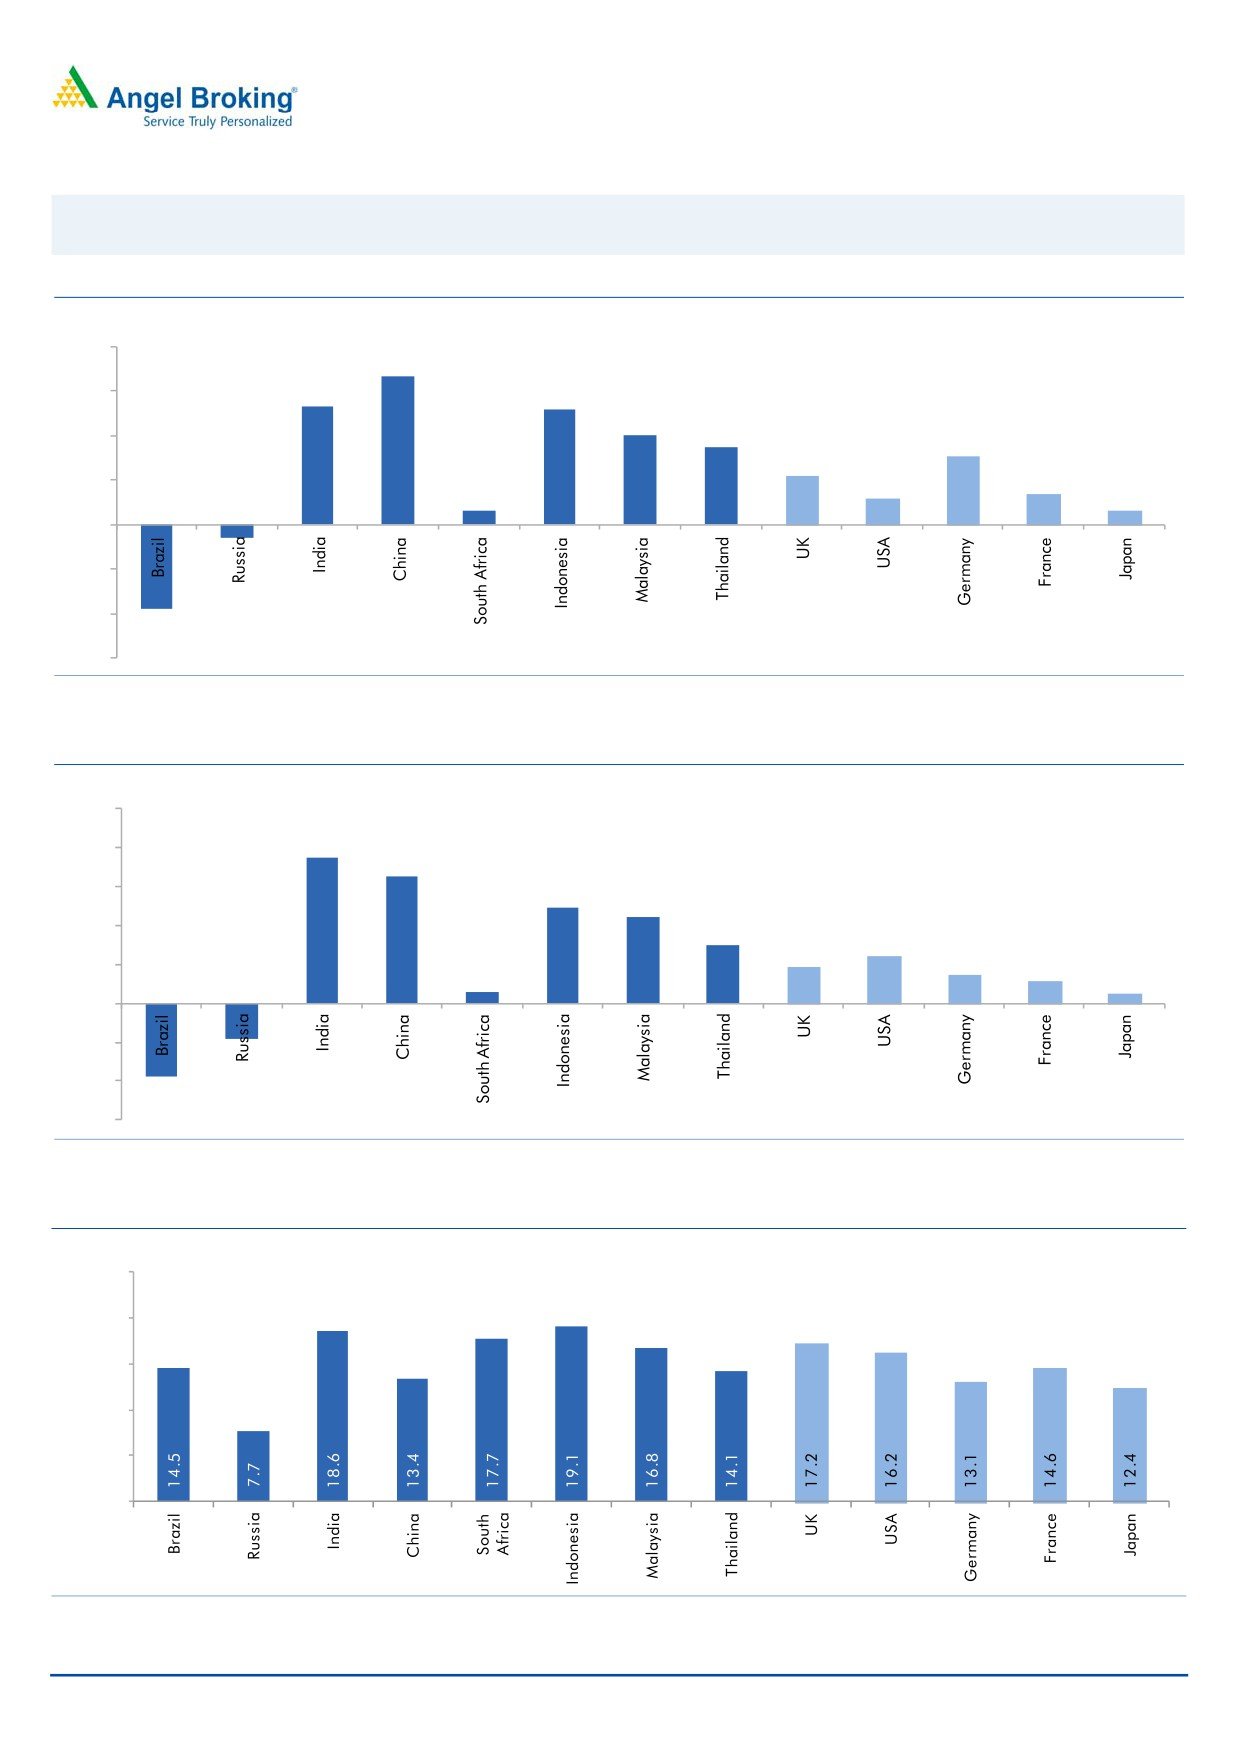
Global watch
Exhibit 7: Latest quarterly GDP Growth (%, yoy) across select developing and developed countries
(%)
8.0
6.7
6.0
5.3
0.6
5.2
4.0
3.5
4.0
3.1
2.2
2.0
1.2
1.4
0.6
-
(2.0)
(0.6)
(4.0)
(3.8)
(6.0)
Source: Bloomberg, Angel Research
Exhibit 8: 2016 GDP Growth projection by IMF (%, yoy) across select developing and developed countries
(%)
10.0
7.5
8.0
6.5
6.0
4.9
4.4
4.0
3.0
2.4
1.9
1.5
2.0
1.1
0.6
0.5
(3.8)
(1.8)
-
(2.0)
(4.0)
(6.0)
Source: IMF, Angel Research
Exhibit 9: One year forward P-E ratio across select developing and developed countries
(x)
25.0
20.0
15.0
10.0
5.0
-
Source: IMF, Angel Research
September 7, 2016
16
Top Picks Report | September 2016
Exhibit 10: Relative performance of indices across globe
Returns (%)
Country
Name of index
Closing price
1M
3M
1YR
Brazil
Bovespa
60,129
4.3
16.5
32.2
Russia
Micex
2,040
4.9
5.2
20.7
India
Nifty
8,943
4.3
8.7
11.4
China
Shanghai Composite
3,091
2.9
5.3
(4.3)
South Africa
Top 40
47,008
3.0
(2.2)
7.3
Mexico
Mexbol
47,627
0.9
2.9
10.5
Indonesia
LQ45
926
(0.5)
11.9
22.9
Malaysia
KLCI
1,690
2.1
3.6
5.5
Thailand
SET 50
950
(2.0)
2.9
6.4
USA
Dow Jones
18,538
1.0
3.4
12.4
UK
FTSE
6,826
1.3
8.6
9.6
Japan
Nikkei
17,082
5.1
3.0
(7.0)
Germany
DAX
10,687
2.8
6.3
5.9
France
CAC
4,530
2.9
3.2
(2.2)
Source: Bloomberg, Angel Research
September 7, 2016
17
Top Picks Report | September 2016
Stock Watch
September 7, 2016
18
Stock Watch | September 2016
Company Name
Reco
CMP
Target
Mkt Cap
Sales (` cr)
OPM (%)
EPS (`)
PER (x)
P/BV (x)
RoE (%)
EV/Sales (x)
(`)
Price (`)
(` cr)
FY17E
FY18E
FY17E
FY18E
FY17E
FY18E
FY17E
FY18E
FY17E
FY18E
FY17E
FY18E
FY17E
FY18E
Agri / Agri Chemical
Rallis
Neutral
224
-
4,363
1,937
2,164
13.3
14.3
9.0
11.0
24.9
20.4
4.3
3.8
18.4
19.8
2.3
2.0
United Phosphorus
Accumulate
660
684
28,301
15,176
17,604
18.5
18.5
37.4
44.6
17.7
14.8
3.5
2.9
21.4
21.2
1.9
1.6
Auto & Auto Ancillary
Ashok Leyland
Buy
89
111
25,186
22,407
26,022
10.6
10.6
5.2
6.4
17.0
13.8
3.8
3.2
23.6
24.7
1.2
1.0
Bajaj Auto
Neutral
2,986
-
86,401
25,093
27,891
19.5
19.2
143.9
162.5
20.7
18.4
5.8
5.0
30.3
29.3
3.2
2.8
Bharat Forge
Neutral
885
-
20,591
7,726
8,713
20.5
21.2
35.3
42.7
25.1
20.7
4.6
4.2
18.9
20.1
2.7
2.3
Eicher Motors
Neutral
22,973
-
62,397
16,583
20,447
17.5
18.0
598.0
745.2
38.4
30.8
13.1
10.0
41.2
38.3
3.6
2.8
Gabriel India
Neutral
116
-
1,666
1,544
1,715
9.0
9.3
5.4
6.3
21.5
18.4
4.1
3.6
18.9
19.5
1.0
0.9
Hero Motocorp
Neutral
3,610
-
72,084
31,253
35,198
15.3
15.0
172.3
192.1
21.0
18.8
7.7
6.6
38.9
37.0
2.2
1.9
Jamna Auto Industries Neutral
216
-
1,726
1,486
1,620
9.8
9.9
15.0
17.2
14.4
12.6
3.2
2.7
21.8
21.3
1.2
1.1
L G Balakrishnan & Bros Neutral
557
-
875
1,302
1,432
11.6
11.9
43.7
53.0
12.8
10.5
1.8
1.6
13.8
14.2
0.7
0.6
Mahindra and Mahindra Neutral
1,489
-
92,462
46,534
53,077
11.6
11.7
67.3
78.1
22.1
19.1
3.6
3.1
15.4
15.8
2.0
1.7
Maruti
Neutral
5,338
-
161,250
69,186
82,217
14.7
14.4
198.5
241.4
26.9
22.1
5.2
4.2
20.2
19.9
2.0
1.6
Minda Industries
Neutral
1,580
-
2,506
2,728
3,042
9.0
9.1
68.2
86.2
23.2
18.3
5.3
4.2
23.8
24.3
0.9
0.8
Motherson Sumi
Neutral
336
-
44,490
45,896
53,687
7.8
8.2
13.0
16.1
25.8
20.9
8.3
6.6
34.7
35.4
1.0
0.8
Rane Brake Lining
Neutral
1,045
-
827
511
562
11.3
11.5
28.1
30.9
37.2
33.8
5.7
5.2
15.3
15.0
1.6
1.5
Setco Automotive
Neutral
44
-
584
741
837
13.0
13.0
15.2
17.0
2.9
2.6
0.5
0.4
15.8
16.3
1.2
1.1
Tata Motors
Neutral
588
-
169,681
300,209
338,549
8.9
8.4
42.7
54.2
13.8
10.8
2.2
1.9
15.6
17.2
0.7
0.6
TVS Motor
Neutral
330
-
15,697
13,390
15,948
6.9
7.1
12.8
16.5
25.9
20.0
6.4
5.1
26.3
27.2
1.2
1.0
Amara Raja Batteries
Accumulate
1,018
1,174
17,387
5,429
6,471
17.5
17.6
35.3
43.5
28.8
23.4
6.6
5.4
25.3
24.8
3.1
2.5
Exide Industries
Neutral
191
-
16,214
7,439
8,307
15.0
15.0
8.1
9.3
23.5
20.5
3.3
2.9
14.3
16.7
1.8
1.6
Apollo Tyres
Neutral
206
-
10,488
12,877
14,504
14.3
13.9
21.4
23.0
9.6
9.0
1.5
1.3
16.4
15.2
1.0
0.9
Ceat
Buy
1,017
1,119
4,113
7,524
8,624
13.0
12.7
131.1
144.3
7.8
7.0
1.4
1.2
19.8
18.6
0.6
0.5
JK Tyres
Neutral
145
-
3,290
7,455
8,056
15.0
15.0
21.8
24.5
6.7
5.9
1.4
1.1
22.8
21.3
0.6
0.5
Swaraj Engines
Neutral
1,208
-
1,500
660
810
15.2
16.4
54.5
72.8
22.2
16.6
6.9
6.3
31.5
39.2
2.0
1.6
Subros
Neutral
127
-
760
1,488
1,681
11.7
11.9
6.4
7.2
19.8
17.7
2.1
1.9
10.8
11.4
0.7
0.6
Indag Rubber
Neutral
186
-
489
286
326
19.8
16.8
11.7
13.3
15.9
14.0
2.7
2.5
17.8
17.1
1.4
1.2
Banking
Axis Bank
Neutral
625
-
149,172
58,081
66,459
3.5
3.5
32.3
44.6
19.3
14.0
2.5
2.21
13.6
16.5
-
-
Bank of Baroda
Neutral
175
-
40,277
19,980
23,178
1.8
1.8
11.5
17.3
15.2
10.1
1.7
1.4
8.3
10.1
-
-
Canara Bank
Neutral
307
-
16,645
15,225
16,836
1.8
1.8
14.5
28.0
21.1
10.9
1.5
1.2
5.8
8.5
-
-
Dewan Housing Finance Neutral
297
-
8,663
2,225
2,688
2.9
2.9
29.7
34.6
10.0
8.6
1.6
1.4
16.1
16.8
-
-
Equitas Holdings
Buy
182
235
6,090
939
1,281
11.7
11.5
5.8
8.2
31.3
22.1
2.7
2.4
10.9
11.5
-
-
Federal Bank
Neutral
74
-
12,792
9,353
10,623
2.9
2.9
4.4
5.8
16.9
12.8
1.6
1.4
9.5
11.0
-
-
HDFC
Neutral
1,428
-
225,714
11,475
13,450
3.4
3.4
45.3
52.5
31.5
27.2
6.1
5.4
20.2
20.5
-
-
HDFC Bank
Neutral
1,288
-
326,025
46,097
55,433
4.5
4.5
58.4
68.0
22.1
18.9
3.9
3.23
18.8
18.6
-
-
ICICI Bank
Neutral
278
-
161,798
39,029
45,903
3.3
3.3
16.7
16.3
16.7
17.1
2.1
1.9
10.1
12.4
-
-
LIC Housing Finance
Neutral
588
-
29,692
3,712
4,293
2.6
2.5
39.0
46.0
15.1
12.8
2.8
2.4
19.9
20.1
-
-
September 7, 2016
19
Stock Watch | September 2016
Company Name
Reco
CMP
Target
Mkt Cap
Sales (` cr)
OPM (%)
EPS (`)
PER (x)
P/BV (x)
RoE (%)
EV/Sales (x)
(`)
Price (`)
(` cr)
FY17E
FY18E
FY17E
FY18E
FY17E
FY18E
FY17E
FY18E
FY17E
FY18E
FY17E
FY18E
FY17E
FY18E
Punjab Natl.Bank
Neutral
139
-
27,343
23,532
23,595
2.3
2.4
6.8
12.6
20.5
11.1
3.2
2.2
3.3
6.5
-
-
South Ind.Bank
Neutral
24
-
3,288
6,435
7,578
2.5
2.5
2.7
3.1
9.0
7.9
1.2
1.0
10.1
11.2
-
-
St Bk of India
Neutral
267
-
206,917
88,650
98,335
2.6
2.6
13.5
18.8
19.7
14.2
1.9
1.6
7.0
8.5
-
-
Union Bank
Neutral
151
-
10,391
13,450
14,925
2.3
2.3
25.5
34.5
5.9
4.4
0.9
0.7
7.5
10.2
-
-
Yes Bank
Neutral
1,405
-
59,167
8,978
11,281
3.3
3.4
74.0
90.0
19.0
15.6
3.6
3.1
17.0
17.2
-
-
Capital Goods
ACE
Neutral
45
-
443
709
814
4.1
4.6
1.4
2.1
32.0
21.3
1.3
1.2
4.4
6.0
0.8
0.7
BEML
Accumulate
1,082
1,157
4,508
3,451
4,055
6.3
9.2
31.4
57.9
34.5
18.7
2.1
1.9
6.3
10.9
1.4
1.2
Bharat Electronics
Buy
1,210
1,414
29,039
8,137
9,169
16.8
17.2
58.7
62.5
20.6
19.4
3.2
2.8
44.6
46.3
2.6
2.3
Voltas
Neutral
391
-
12,933
6,511
7,514
7.9
8.7
12.9
16.3
30.3
24.0
5.5
4.8
16.7
18.5
1.7
1.5
BGR Energy
Neutral
119
-
859
16,567
33,848
6.0
5.6
7.8
5.9
15.3
20.2
0.9
0.8
4.7
4.2
0.1
0.1
BHEL
Neutral
160
-
39,113
28,797
34,742
-
2.8
2.3
6.9
69.5
23.2
1.2
1.1
1.3
4.8
0.8
0.6
Blue Star
Accumulate
514
578
4,898
4,283
5,077
5.9
7.3
14.9
22.1
34.2
23.0
16.8
15.8
23.1
24.1
1.1
1.0
Crompton Greaves
Neutral
84
-
5,236
5,777
6,120
5.9
7.0
3.3
4.5
25.3
18.6
1.1
1.1
4.4
5.9
0.8
0.7
Greaves Cotton
Neutral
135
-
3,292
1,755
1,881
16.8
16.9
7.8
8.5
17.3
15.9
3.5
3.2
20.6
20.9
1.6
1.4
Inox Wind
Buy
180
286
3,995
5,605
6,267
15.7
16.4
24.8
30.0
7.3
6.0
2.0
1.5
25.9
24.4
0.8
0.6
KEC International
Neutral
133
-
3,430
9,294
10,186
7.9
8.1
9.9
11.9
13.5
11.2
2.0
1.7
15.6
16.3
0.6
0.5
Thermax
Neutral
844
-
10,053
5,421
5,940
7.3
7.3
25.7
30.2
32.8
27.9
4.0
3.6
12.2
13.1
1.7
1.6
VATech Wabag
Buy
573
681
3,121
3,136
3,845
8.9
9.1
26.0
35.9
22.0
16.0
2.8
2.3
13.4
15.9
0.9
0.7
Cement
ACC
Neutral
1,692
-
31,775
11,225
13,172
13.2
16.9
44.5
75.5
38.0
22.4
3.6
3.3
11.2
14.2
2.8
2.4
Ambuja Cements
Neutral
274
-
54,397
9,350
10,979
18.2
22.5
5.8
9.5
47.2
28.8
4.0
3.6
10.2
12.5
5.9
5.0
India Cements
Neutral
154
-
4,732
4,364
4,997
18.5
19.2
7.9
11.3
19.5
13.6
1.4
1.4
8.0
8.5
1.9
1.6
JK Cement
Neutral
802
-
5,605
4,398
5,173
15.5
17.5
31.2
55.5
25.7
14.4
3.1
2.7
12.0
15.5
1.8
1.5
J K Lakshmi Cement
Neutral
468
-
5,506
2,913
3,412
14.5
19.5
7.5
22.5
62.4
20.8
3.8
3.2
12.5
18.0
2.4
2.0
Orient Cement
Neutral
194
-
3,971
2,114
2,558
18.5
20.5
8.1
11.3
23.9
17.2
3.5
3.0
9.0
14.0
2.6
2.0
UltraTech Cement
Neutral
4,089
-
112,208
25,768
30,385
21.0
23.5
111.0
160.0
36.8
25.6
4.7
4.1
13.5
15.8
4.4
3.7
Construction
ITNL
Buy
76
93
2,497
8,946
10,017
31.0
31.6
8.1
9.1
9.4
8.3
0.3
0.3
4.2
5.0
3.6
3.3
KNR Constructions
Accumulate
712
802
2,003
1,385
1,673
14.7
14.0
41.2
48.5
17.3
14.7
3.2
2.8
14.9
15.2
1.5
1.2
Larsen & Toubro
Accumulate
1,519
1,700
141,591
67,665
77,249
10.7
11.5
57.3
71.2
26.5
21.3
2.4
2.3
12.6
14.3
2.3
2.0
Gujarat Pipavav Port
Neutral
184
-
8,876
705
788
52.2
51.7
5.0
5.6
36.7
32.8
3.6
3.2
11.2
11.2
12.4
10.6
Nagarjuna Const.
Neutral
87
-
4,856
8,842
9,775
9.1
8.8
5.3
6.4
16.5
13.6
1.3
1.2
8.2
9.1
0.7
0.6
PNC Infratech
Accumulate
122
129
3,140
2,350
2,904
13.4
13.7
48.0
42.0
2.6
2.9
0.5
0.4
16.8
13.2
1.4
1.2
Simplex Infra
Neutral
353
-
1,745
6,829
7,954
10.5
10.5
31.4
37.4
11.2
9.4
1.2
1.1
9.9
13.4
0.7
0.6
Power Mech Projects
Neutral
472
-
695
1,801
2,219
12.7
14.6
72.1
113.9
6.6
4.1
1.2
1.0
16.8
11.9
0.4
0.3
Sadbhav Engineering
Neutral
298
-
5,117
3,598
4,140
10.3
10.6
9.0
11.9
33.1
25.1
3.5
3.0
9.9
11.9
1.7
1.4
NBCC
Neutral
252
-
15,117
7,428
9,549
7.9
8.6
8.2
11.0
30.7
22.9
1.5
1.2
28.2
28.7
1.7
1.3
MEP Infra
Neutral
43
-
700
1,877
1,943
30.6
29.8
3.0
4.2
14.4
10.3
6.9
4.7
0.6
0.6
1.8
1.6
September 7, 2016
20
Stock Watch | September 2016
Company Name
Reco
CMP
Target
Mkt Cap
Sales (` cr)
OPM (%)
EPS (`)
PER (x)
P/BV (x)
RoE (%)
EV/Sales (x)
(`)
Price (`)
(` cr)
FY17E
FY18E
FY17E
FY18E
FY17E
FY18E
FY17E
FY18E
FY17E
FY18E
FY17E
FY18E
FY17E
FY18E
SIPL
Neutral
104
-
3,665
1,036
1,252
65.5
66.2
(8.4)
(5.6)
-
-
3.9
4.4
(22.8)
(15.9)
11.8
9.8
Engineers India
Neutral
268
-
9,020
1,725
1,935
16.0
19.1
11.4
13.9
23.5
19.3
3.2
3.1
13.4
15.3
4.2
3.7
FMCG
Asian Paints
Neutral
1,178
-
112,965
17,128
18,978
16.8
16.4
19.1
20.7
61.7
56.9
21.5
20.2
34.8
35.5
6.6
6.0
Britannia
Neutral
3,489
-
41,860
9,795
11,040
14.6
14.9
80.3
94.0
43.4
37.1
17.9
13.8
41.2
-
4.1
3.6
Colgate
Neutral
990
-
26,933
4,605
5,149
23.4
23.4
23.8
26.9
41.6
36.8
23.0
18.0
64.8
66.8
5.7
5.1
Dabur India
Neutral
297
-
52,255
8,315
9,405
19.8
20.7
8.1
9.2
36.7
32.3
10.2
8.5
31.6
31.0
6.0
5.3
GlaxoSmith Con*
Neutral
6,226
-
26,182
4,350
4,823
21.2
21.4
179.2
196.5
34.7
31.7
9.2
7.8
27.1
26.8
5.4
4.8
Godrej Consumer
Neutral
1,670
-
56,859
10,235
11,428
18.4
18.6
41.1
44.2
40.6
37.8
9.0
7.6
24.9
24.8
5.5
4.8
HUL
Neutral
932
-
201,643
35,252
38,495
17.6
17.4
20.4
21.9
45.6
42.5
37.5
32.9
82.2
77.3
5.6
5.1
ITC
Accumulate
262
283
315,893
40,059
44,439
39.0
39.2
9.1
10.1
28.8
25.9
7.8
6.9
27.2
26.5
7.4
6.6
Marico
Neutral
297
-
38,350
6,430
7,349
18.8
19.5
6.4
7.7
46.4
38.6
14.0
11.8
33.2
32.5
5.8
5.0
Nestle*
Neutral
6,479
-
62,467
10,073
11,807
20.7
21.5
124.8
154.2
51.9
42.0
21.3
19.2
34.8
36.7
6.1
5.2
Tata Global
Neutral
142
-
8,975
8,675
9,088
9.8
9.8
7.4
8.2
19.2
17.3
2.2
2.1
7.9
8.1
0.9
0.9
Procter & Gamble
Accumulate
6,601
7,369
21,427
2,939
3,342
23.2
23.0
146.2
163.7
45.1
40.3
101.1
96.9
25.3
23.5
6.8
5.9
IT
HCL Tech^
Buy
787
1,000
111,012
49,242
57,168
20.5
20.5
55.7
64.1
14.1
12.3
2.9
2.2
20.3
17.9
2.1
1.7
Infosys
Buy
1,055
1,370
242,328
69,934
79,025
27.5
27.5
64.8
72.0
16.3
14.7
3.6
3.3
22.0
22.3
2.9
2.5
TCS
Buy
2,447
3,004
482,164
121,684
136,286
27.3
27.3
135.0
150.1
18.1
16.3
6.0
5.5
33.2
33.9
3.8
3.3
Tech Mahindra
Buy
471
700
45,744
30,347
33,685
17.0
17.0
37.5
41.3
12.6
11.4
2.7
2.4
21.8
20.7
1.3
1.1
Wipro
Buy
482
680
117,198
51,631
55,822
21.7
17.9
35.9
36.9
13.4
13.1
2.8
2.6
19.0
18.1
2.0
1.7
Media
D B Corp
Neutral
412
-
7,565
2,297
2,590
27.4
28.2
21.0
23.4
19.6
17.6
4.6
4.0
23.7
23.1
3.1
2.7
HT Media
Neutral
86
-
2,007
2,693
2,991
12.6
12.9
7.9
9.0
10.9
9.6
0.9
0.9
7.8
8.3
0.3
0.2
Jagran Prakashan
Buy
195
225
6,378
2,355
2,635
28.0
28.0
10.8
12.5
18.1
15.6
3.9
3.4
21.7
21.7
2.7
2.4
Sun TV Network
Neutral
487
-
19,200
2,850
3,265
70.1
71.0
26.2
30.4
18.6
16.0
4.8
4.2
24.3
25.6
6.2
5.3
Hindustan Media Ven.
Neutral
285
-
2,095
1,016
1,138
24.3
25.2
27.3
30.1
10.5
9.5
2.0
1.8
16.2
15.8
1.3
1.2
TV Today Network
Buy
300
363
1,790
637
743
27.5
27.5
18.4
21.4
16.3
14.0
2.8
2.4
17.4
17.2
2.5
2.0
Metal
Coal India
Neutral
331
-
208,977
84,638
94,297
21.4
22.3
24.5
27.1
13.5
12.2
5.6
5.4
42.6
46.0
2.0
1.8
Hind. Zinc
Neutral
228
-
96,485
14,252
18,465
55.9
48.3
15.8
21.5
14.5
10.6
2.4
2.1
17.0
20.7
6.8
5.3
Hindalco
Neutral
160
-
32,998
107,899
112,095
7.4
8.2
9.2
13.0
17.4
12.3
0.8
0.8
4.8
6.6
0.8
0.8
JSW Steel
Neutral
1,851
-
44,731
53,201
58,779
16.1
16.2
130.6
153.7
14.2
12.0
1.9
1.7
14.0
14.4
1.6
1.4
NMDC
Neutral
115
-
45,416
6,643
7,284
44.4
47.7
7.1
7.7
16.1
14.9
1.4
1.4
8.8
9.2
4.2
3.7
SAIL
Neutral
52
-
21,435
47,528
53,738
(0.7)
2.1
(1.9)
2.6
-
20.0
0.6
0.5
(1.6)
3.9
1.3
1.2
Vedanta
Neutral
174
-
51,467
71,744
81,944
19.2
21.7
13.4
20.1
13.0
8.6
1.1
1.0
8.4
11.3
1.1
0.8
Tata Steel
Neutral
390
-
37,873
121,374
121,856
7.2
8.4
18.6
34.3
21.0
11.4
1.3
1.2
6.1
10.1
0.9
0.9
September 7, 2016
21
Stock Watch | September 2016
Company Name
Reco
CMP
Target
Mkt Cap
Sales (` cr)
OPM (%)
EPS (`)
PER (x)
P/BV (x)
RoE (%)
EV/Sales (x)
(`)
Price (`)
(` cr)
FY17E
FY18E
FY17E
FY18E
FY17E
FY18E
FY17E
FY18E
FY17E
FY18E
FY17E
FY18E
FY17E
FY18E
Oil & Gas
Cairn India
Neutral
201
-
37,600
9,127
10,632
4.3
20.6
8.8
11.7
22.8
17.1
0.7
0.7
3.3
4.2
5.6
4.7
GAIL
Neutral
397
-
50,295
56,220
65,198
9.3
10.1
27.1
33.3
14.6
11.9
1.3
1.2
9.3
10.7
1.1
0.9
ONGC
Neutral
245
-
209,695
137,222
152,563
15.0
21.8
19.5
24.1
12.6
10.2
1.1
1.0
8.5
10.1
1.8
1.6
Indian Oil Corp
Neutral
568
-
137,798
373,359
428,656
5.9
5.5
54.0
59.3
10.5
9.6
1.6
1.5
16.0
15.6
0.5
0.4
Reliance Industries
Neutral
1,017
-
329,903
301,963
358,039
12.1
12.6
87.7
101.7
11.6
10.0
1.2
1.1
10.7
11.3
1.6
1.3
Pharmaceuticals
Alembic Pharma
Neutral
617
-
11,629
3,483
4,083
20.2
21.4
24.3
30.4
25.4
20.3
5.8
4.6
25.5
25.3
3.3
2.8
Aurobindo Pharma
Accumulate
783
877
45,798
15,720
18,078
23.7
23.7
41.4
47.3
18.9
16.5
4.9
3.8
29.6
26.1
3.1
2.7
Aventis*
Neutral
4,391
-
10,113
2,357
2,692
17.3
17.3
153.5
169.2
28.6
26.0
4.8
3.9
25.8
28.4
4.1
3.3
Cadila Healthcare
Neutral
382
-
39,071
11,126
13,148
22.0
22.0
17.1
20.0
22.3
19.1
5.7
4.6
28.8
26.6
3.5
2.9
Cipla
Sell
581
490
46,667
15,378
18,089
17.4
18.4
21.6
27.2
26.9
21.4
3.5
3.0
13.7
15.2
3.2
2.7
Dr Reddy's
Neutral
3,141
-
52,045
16,043
18,119
23.1
24.7
126.0
157.8
24.9
19.9
3.7
3.2
15.7
17.1
3.2
2.8
Dishman Pharma
Sell
176
45
2,846
1,718
1,890
22.7
22.8
9.5
11.3
18.6
15.6
1.8
1.6
10.1
10.9
2.1
1.8
GSK Pharma*
Neutral
3,008
-
25,476
3,528
3,811
16.6
18.8
51.8
59.4
58.1
50.6
15.5
15.5
26.3
30.6
7.0
6.5
Indoco Remedies
Sell
333
225
3,065
1,112
1,289
18.2
18.2
13.2
15.6
25.2
21.3
4.5
3.8
19.2
19.2
2.8
2.4
Ipca labs
Accumulate
564
613
7,114
3,303
3,799
15.3
15.3
17.3
19.7
32.6
28.6
2.8
2.6
9.1
9.4
2.3
2.0
Lupin
Buy
1,542
1,809
69,513
15,912
18,644
26.4
26.7
58.1
69.3
26.5
22.2
5.2
4.2
21.4
20.9
4.4
3.6
Sun Pharma
Buy
779
944
187,590
31,129
35,258
30.0
30.9
28.0
32.8
27.8
23.8
4.3
3.6
18.7
18.9
5.6
4.8
Power
Tata Power
Neutral
77
-
20,745
36,916
39,557
17.4
27.1
5.1
6.3
15.0
12.2
1.3
1.2
9.0
10.3
1.6
1.4
NTPC
Neutral
161
-
132,793
86,605
95,545
17.5
20.8
11.8
13.4
13.6
12.0
1.4
1.3
10.5
11.1
2.9
2.9
Power Grid
Neutral
185
-
96,654
25,763
29,762
74.3
73.1
14.8
17.3
12.5
10.7
2.0
1.7
16.9
17.5
8.1
7.6
Real Estate
Prestige Estate
Accumulate
198
210
7,423
4,707
5,105
25.2
26.0
10.3
13.0
19.2
15.2
1.5
1.4
10.3
10.2
2.7
2.4
MLIFE
Buy
431
522
1,770
1,152
1,300
22.7
24.6
29.9
35.8
14.4
12.1
1.1
1.0
7.6
8.6
2.2
1.9
Telecom
Bharti Airtel
Neutral
321
-
128,157
105,086
114,808
34.5
34.7
12.2
16.4
26.3
19.5
1.8
1.7
6.8
8.4
2.1
1.9
Idea Cellular
Neutral
84
-
30,139
40,133
43,731
37.2
37.1
6.4
6.5
13.1
12.9
1.1
1.0
8.2
7.6
1.8
1.5
Others
Abbott India
Neutral
4,582
-
9,736
3,153
3,583
14.1
14.4
152.2
182.7
30.1
25.1
147.8
126.2
25.6
26.1
2.8
2.4
Bajaj Electricals
Accumulate
272
306
2,747
5,099
5,805
5.6
5.9
11.4
14.6
23.9
18.6
3.2
2.8
13.4
15.1
0.5
0.5
Banco Products (India)
Neutral
230
-
1,648
1,353
1,471
12.3
12.4
14.5
16.3
15.9
14.1
21.9
19.8
14.5
14.6
1.2
1.2
Coffee Day Enterprises
Neutral
238
-
4,910
2,964
3,260
20.5
21.2
4.7
8.0
-
29.8
2.8
2.5
5.5
8.5
2.1
1.8
Competent Automobiles Neutral
181
-
111
1,137
1,256
3.1
2.7
28.0
23.6
6.5
7.7
34.9
31.5
14.3
11.5
0.1
0.1
Elecon Engineering
Accumulate
56
63
614
1,482
1,660
13.7
14.5
3.9
5.8
14.5
9.7
3.4
3.1
7.8
10.9
0.7
0.6
Finolex Cables
Neutral
428
-
6,541
2,883
3,115
12.0
12.1
14.2
18.6
30.1
23.0
16.0
14.0
15.8
14.6
1.9
1.8
Garware Wall Ropes
Accumulate
509
524
1,115
873
938
12.9
13.1
30.9
34.9
16.5
14.6
2.6
2.2
15.7
15.2
1.1
1.0
Goodyear India*
Accumulate
601
684
1,386
1,598
1,704
10.4
10.2
49.4
52.6
12.2
11.4
56.2
49.3
18.2
17.0
0.5
0.4
September 7, 2016
22
Stock Watch | September 2016
Company Name
Reco
CMP
Target
Mkt Cap
Sales (` cr)
OPM (%)
EPS (`)
PER (x)
P/BV (x)
RoE (%)
EV/Sales (x)
(`)
Price (`)
(` cr)
FY17E
FY18E
FY17E
FY18E
FY17E
FY18E
FY17E
FY18E
FY17E
FY18E
FY17E
FY18E
FY17E
FY18E
Hitachi
Neutral
1,500
-
4,079
2,081
2,433
8.8
8.9
33.4
39.9
44.9
37.6
36.2
30.2
22.1
21.4
1.9
1.6
HSIL
Neutral
353
-
2,553
2,384
2,515
15.8
16.3
15.3
19.4
23.1
18.2
22.9
19.7
7.8
9.3
1.2
1.1
Interglobe Aviation
Neutral
871
-
31,392
21,122
26,005
14.5
27.6
110.7
132.1
7.9
6.6
47.1
33.6
168.5
201.1
1.5
1.1
Jyothy Laboratories
Neutral
320
-
5,787
1,440
2,052
11.5
13.0
8.5
10.0
37.6
32.0
9.1
8.4
18.6
19.3
4.3
3.0
Kirloskar Engines India
Neutral
300
-
4,332
2,554
2,800
9.9
10.0
10.5
12.1
28.5
24.8
11.9
11.3
10.7
11.7
1.2
1.1
Linc Pen & Plastics
Neutral
275
-
407
382
420
9.3
9.5
13.5
15.7
20.4
17.5
3.5
3.0
17.1
17.3
1.1
1.0
M M Forgings
Neutral
432
-
522
546
608
20.4
20.7
41.3
48.7
10.5
8.9
59.2
52.4
16.6
17.0
0.8
0.7
Manpasand Bever.
Neutral
745
-
3,729
836
1,087
19.6
19.4
16.9
23.8
44.1
31.3
5.3
4.6
12.0
14.8
4.2
3.1
MT Educare
Neutral
135
-
538
366
417
17.7
18.2
9.4
10.8
14.4
12.5
3.2
2.8
22.2
22.3
1.4
1.2
Narayana Hrudaya
Neutral
311
-
6,346
1,873
2,166
11.5
11.7
2.6
4.0
117.4
78.3
7.2
6.5
6.1
8.3
3.5
3.0
Navkar Corporation
Buy
191
265
2,722
408
612
42.9
42.3
6.8
11.5
28.2
16.6
2.0
1.7
6.9
10.5
7.6
5.1
Navneet Education
Neutral
106
-
2,525
1,062
1,147
24.0
24.0
6.1
6.6
17.4
16.0
3.6
3.2
20.5
19.8
2.4
2.2
Nilkamal
Neutral
1,271
-
1,897
1,995
2,165
10.7
10.4
69.8
80.6
18.2
15.8
72.6
63.1
16.6
16.5
0.9
0.8
Page Industries
Neutral
15,123
-
16,868
2,450
3,124
20.1
17.6
299.0
310.0
50.6
48.8
336.8
257.1
47.1
87.5
7.0
5.5
Parag Milk Foods
Neutral
334
-
2,809
1,919
2,231
9.3
9.6
9.4
12.9
35.4
25.8
5.5
4.5
15.5
17.5
1.6
1.4
Quick Heal
Neutral
239
-
1,676
408
495
27.3
27.0
7.7
8.8
30.9
27.2
2.9
2.9
9.3
10.6
3.2
2.7
Radico Khaitan
Buy
102
125
1,355
1,659
1,802
13.0
13.2
6.3
7.4
16.1
13.8
1.4
1.3
8.6
9.3
1.3
1.1
Relaxo Footwears
Neutral
423
-
5,075
2,085
2,469
9.2
8.2
7.6
7.9
55.9
53.2
21.7
18.5
17.9
18.8
2.6
2.2
S H Kelkar & Co.
Neutral
339
-
4,904
1,036
1,160
15.1
15.0
6.1
7.2
55.5
47.2
5.9
5.4
10.7
11.5
4.6
4.1
Siyaram Silk Mills
Accumulate
1,281
1,469
1,201
1,799
2,040
11.6
11.7
104.9
122.4
12.2
10.5
2.0
1.7
16.4
16.4
0.9
0.8
Styrolution ABS India*
Neutral
559
-
983
1,440
1,537
9.2
9.0
40.6
42.6
13.8
13.1
35.2
32.0
12.3
11.6
0.6
0.6
Surya Roshni
Neutral
204
-
895
3,342
3,625
7.8
7.5
17.3
19.8
11.8
10.3
22.5
18.0
10.5
10.8
0.5
0.5
Team Lease Serv.
Neutral
1,125
-
1,923
3,229
4,001
1.5
1.8
22.8
32.8
49.4
34.2
5.3
4.6
10.7
13.4
0.5
0.4
The Byke Hospitality
Neutral
162
-
650
287
384
20.5
20.5
7.6
10.7
21.3
15.1
4.5
3.6
20.7
23.5
2.3
1.7
Transport Corp. of India
Neutral
186
-
1,424
2,671
2,911
8.5
8.8
13.9
15.7
13.4
11.9
1.8
1.6
13.7
13.8
0.6
0.6
TVS Srichakra
Accumulate
2,689
2,932
2,059
2,304
2,614
13.7
13.8
231.1
266.6
11.6
10.1
302.2
237.9
33.9
29.3
0.9
0.8
UFO Moviez
Neutral
448
-
1,237
619
685
33.2
33.4
30.0
34.9
15.0
12.8
2.1
1.8
13.8
13.9
1.8
1.4
Visaka Industries
Neutral
202
-
320
1,051
1,138
10.3
10.4
21.0
23.1
9.6
8.7
25.8
24.2
9.0
9.2
0.6
0.5
VRL Logistics
Neutral
289
-
2,640
1,902
2,119
16.7
16.6
14.6
16.8
19.9
17.2
4.4
3.8
21.9
22.2
1.5
1.3
Wonderla Holidays
Neutral
405
-
2,289
287
355
38.0
40.0
11.3
14.2
35.8
28.5
5.1
4.5
21.4
23.9
7.7
6.2
Source: Company, Angel Research, Note: *December year end; #September year end;
&October year end; ^June year end; Price as of Septembr 7, 2016
September 7, 2016
23
Top Picks Report | September 2016
Research Team Tel: 022 - 39357800
DISCLAIMER
Angel Broking Private Limited (hereinafter referred to as “Angel”) is a registered Member of National Stock Exchange of India Limited,
Bombay Stock Exchange Limited and Metropolitan Stock Exchange Limited. It is also registered as a Depository Participant with CDSL
and Portfolio Manager with SEBI. It also has registration with AMFI as a Mutual Fund Distributor. Angel Broking Private Limited is a
registered entity with SEBI for Research Analyst in terms of SEBI (Research Analyst) Regulations, 2014 vide registration number
INH000000164. Angel or its associates has not been debarred/ suspended by SEBI or any other regulatory authority for accessing
/dealing in securities Market. Angel or its associates/analyst has not received any compensation / managed or co-managed public
offering of securities of the company covered by Analyst during the past twelve months.
This document is solely for the personal information of the recipient, and must not be singularly used as the basis of any investment
decision. Nothing in this document should be construed as investment or financial advice. Each recipient of this document should
make such investigations as they deem necessary to arrive at an independent evaluation of an investment in the securities of the
companies referred to in this document (including the merits and risks involved), and should consult their own advisors to determine
the merits and risks of such an investment.
Reports based on technical and derivative analysis center on studying charts of a stock's price movement, outstanding positions and
trading volume, as opposed to focusing on a company's fundamentals and, as such, may not match with a report on a company's
fundamentals. Investors are advised to refer the Fundamental and Technical Research Reports available on our website to evaluate the
contrary view, if any.
The information in this document has been printed on the basis of publicly available information, internal data and other reliable
sources believed to be true, but we do not represent that it is accurate or complete and it should not be relied on as such, as this
document is for general guidance only. Angel Broking Pvt. Limited or any of its affiliates/ group companies shall not be in any way
responsible for any loss or damage that may arise to any person from any inadvertent error in the information contained in this report.
Angel Broking Pvt. Limited has not independently verified all the information contained within this document. Accordingly, we cannot
testify, nor make any representation or warranty, express or implied, to the accuracy, contents or data contained within this document.
While Angel Broking Pvt. Limited endeavors to update on a reasonable basis the information discussed in this material, there may be
regulatory, compliance, or other reasons that prevent us from doing so.
This document is being supplied to you solely for your information, and its contents, information or data may not be reproduced,
redistributed or passed on, directly or indirectly.
Neither Angel Broking Pvt. Limited, nor its directors, employees or affiliates shall be liable for any loss or damage that may arise from
or in connection with the use of this information.
September 7, 2016
24