Angel Top Picks - November 2017
With 5.3% returns, October proved to be the best month for Indian equities in the
Top Picks
last 19 months. While the government signalled its pro growth stance through its
Company
CMP (`)
TP (`)
bank recapitalization and aggressive capex in the road infrasstrucutre, the 30 rank
Banking/NBFC
jump in the World Bank’s ease of doing busijess proved to be sentimental booster.
Dewan Housing
666
762
While markets are at all time highs, Angel Broking’s Top Picks portfolio has shown
GIC Housing Finance
481
655
a 30% outperformance to BSE 100 index during the last two year period.
Karur Vysa Bank
127
161
Consumption
Government’s focus shifts to growth: Following the slower ecoconimic growth in
Asian Granito
495
572
1QFY18, government had indicated of undertaking a plan to boost the economy.
Accordingly, government has announced a `2.11 lakh cr plan to recapitalize
Blue Star
692
867
public sector banks (PSBs) and `5.35 lakhs cr plan to undertake road construction
Siyaram Silk Mills
607
650
projects. With the host of reforms implemented over the last three years, we believe
LT Foods
73
96
that government’s focus has now shifted towards job creation and growth. The
Media/Automobiles
same can be seen in revision in the excise duty on petrol and diesel as well as the
Maruti Suzuki
8,216
8,890
high probability of revision in the GST rates on common use items to spur the
Music Broadcast
387
434
growth in the economy.
TV Today
379
435
Real Estate/Infra/Logistics/Power
Bank recapitalization to revive credit growth: The recapitalization plan of `2.11
KEI Industries
338
371
lakh cr (~$32.6bn) is expected to be completed over the two fiscals i.e. FY2018
Navkar Corp.
195
265
and FY2019. This will be financed by budgetary provisions
(`18,139cr),
Pharmaceutical
recapitalization bonds (`1.35 lakh cr), and by diluting government equity stake by
Alkem Laboratories
1,926
2,125
raising funds through financial markets (~`58,000cr). In our view, capital infusion
Source: Angel Research;
of PSBs would help to clean-up their NPAs, improve their capital adequacy ratio
Note: CMP as of November 03, 2017
which will support them in bringing credit growth going ahead.
Several sectors to benefit from road capex: Under the name Bharatmala
Pariyojana, govt. has planned to construct 34,800 km of roads over the next 5
years at a capital expenditure of `5.35 lakhs cr ($82.7bn). This is likely to create
14.2cr man days of jobs. The scope of project includes construction of ring roads,
bypasses, elevated corridors and logistics parks. The government envisages that
this project will help in unclogging the bottlenecks on the existing Golden
Quadrilateral highway network. The road capex is expected to be positive for
sectors like construction, cement, steel, automobile, etc. while improved efficiency
will benefit the sectors like logistics and manufacturing.
India’s rank in Ease Of Doing Business improves: With the help of reforms in
taxation, licensing, investor protection, and bankruptcy resolution, India’s rank in
World Bank’s Ease Of Doing Business (EODB) jumped 30 spots to 100. We believe
that jump in EODB ranking highlights India’s firm macro improvement story. The
GST implementation and use of Aadhar in transactions are further expected to
helping improve the domestic fundamentals and improve this ranking. This is
crucial for India to attract the foreign capital and we view this positively.
In the nutshell, we continue to maintain positive stance on the economy and
believe that the affordable housing scheme and Bharatmala Pariyojana project will
help in job creation which will benefit the Indian economy. With the capital
infusion in PSBs we believe that credit growth will also be supported.
We ,maintain positive outlook on Maruti Suzuki, Asian Granito and Blue Star from
consumption sector as well as on the stocks like Music Broadcast, GIC housing
finance, Karur Vysa Bank, Navkar Corp, KEI Industries and Siyaram Silk Mills. We
add LT Foods in the Top Picks portfolio.
Please refer to important disclosures at the end of this report
1
Top Picks Report | November 2017
Top Picks
November 6, 2017
2
Top Picks Report | November 2017
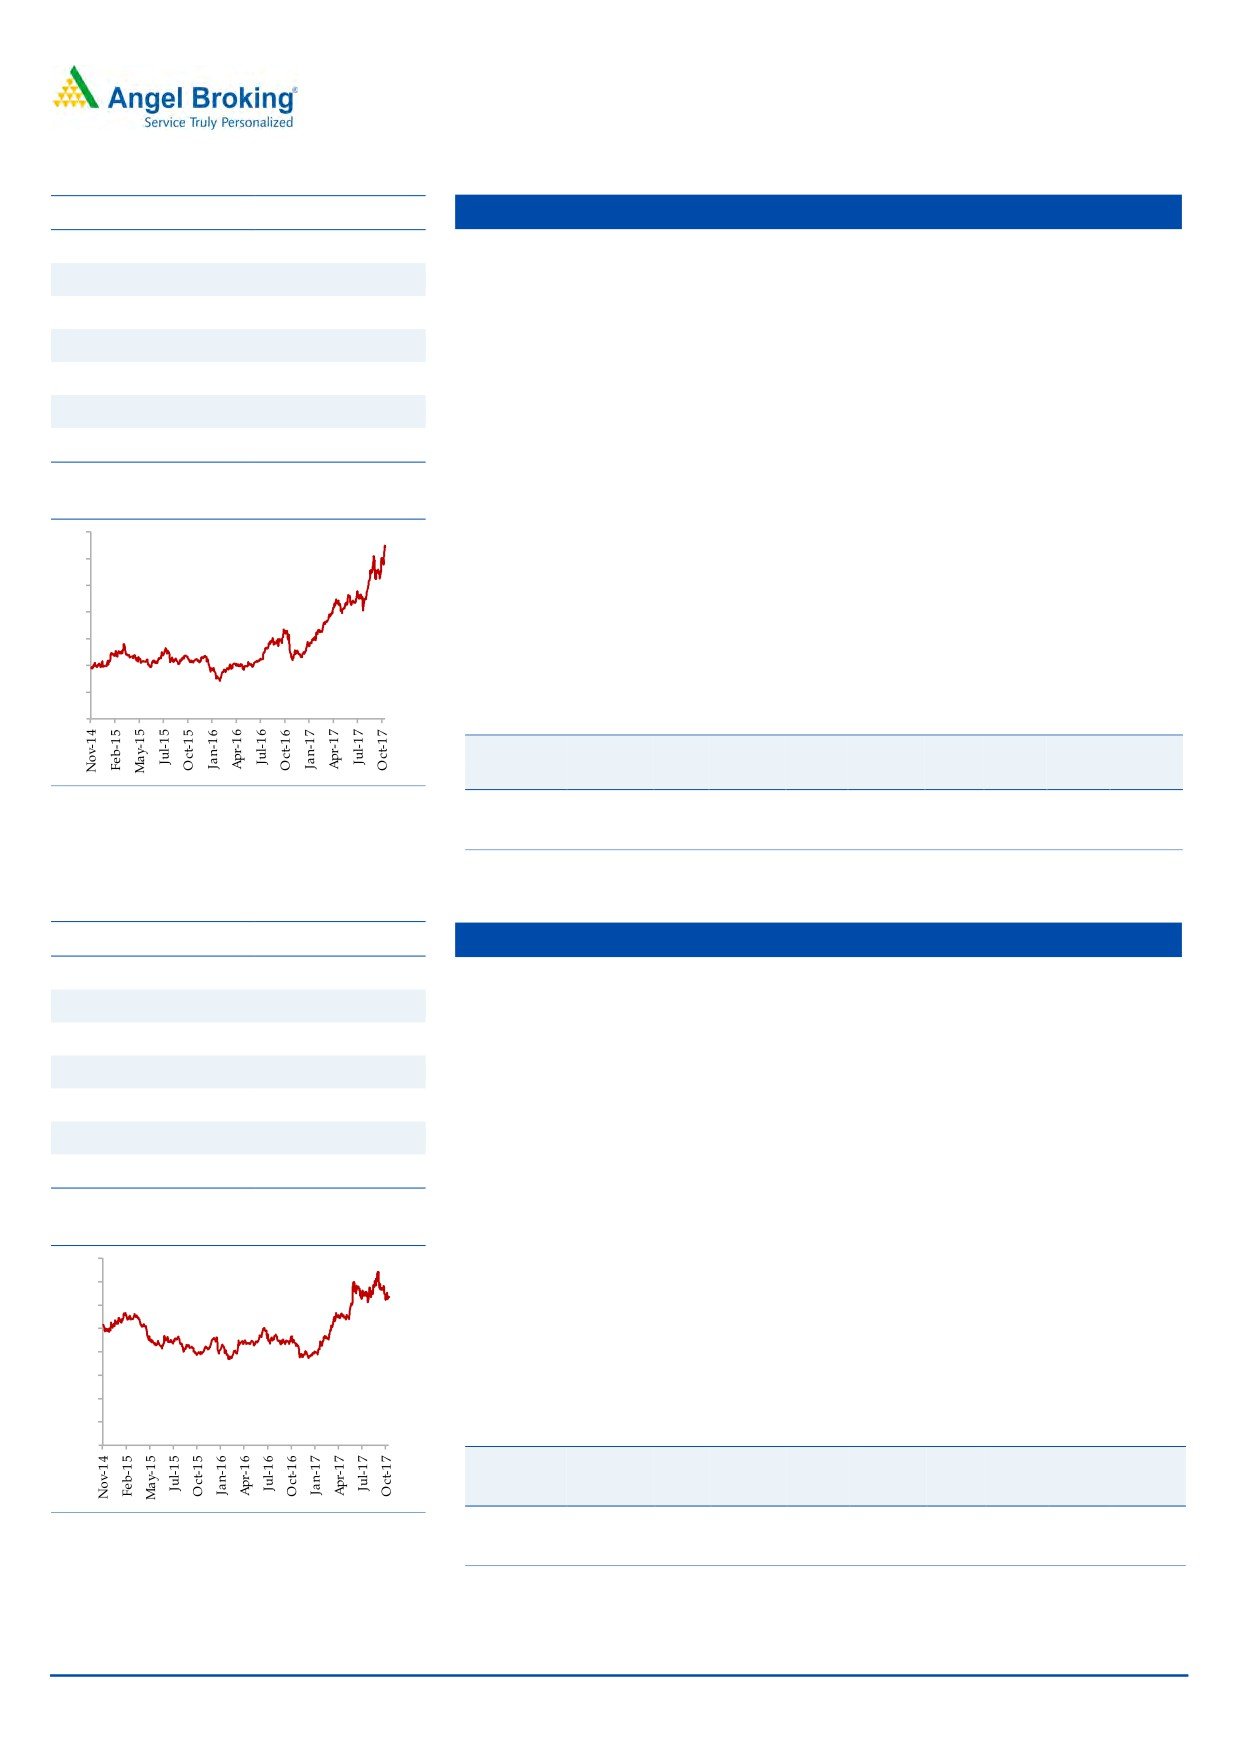
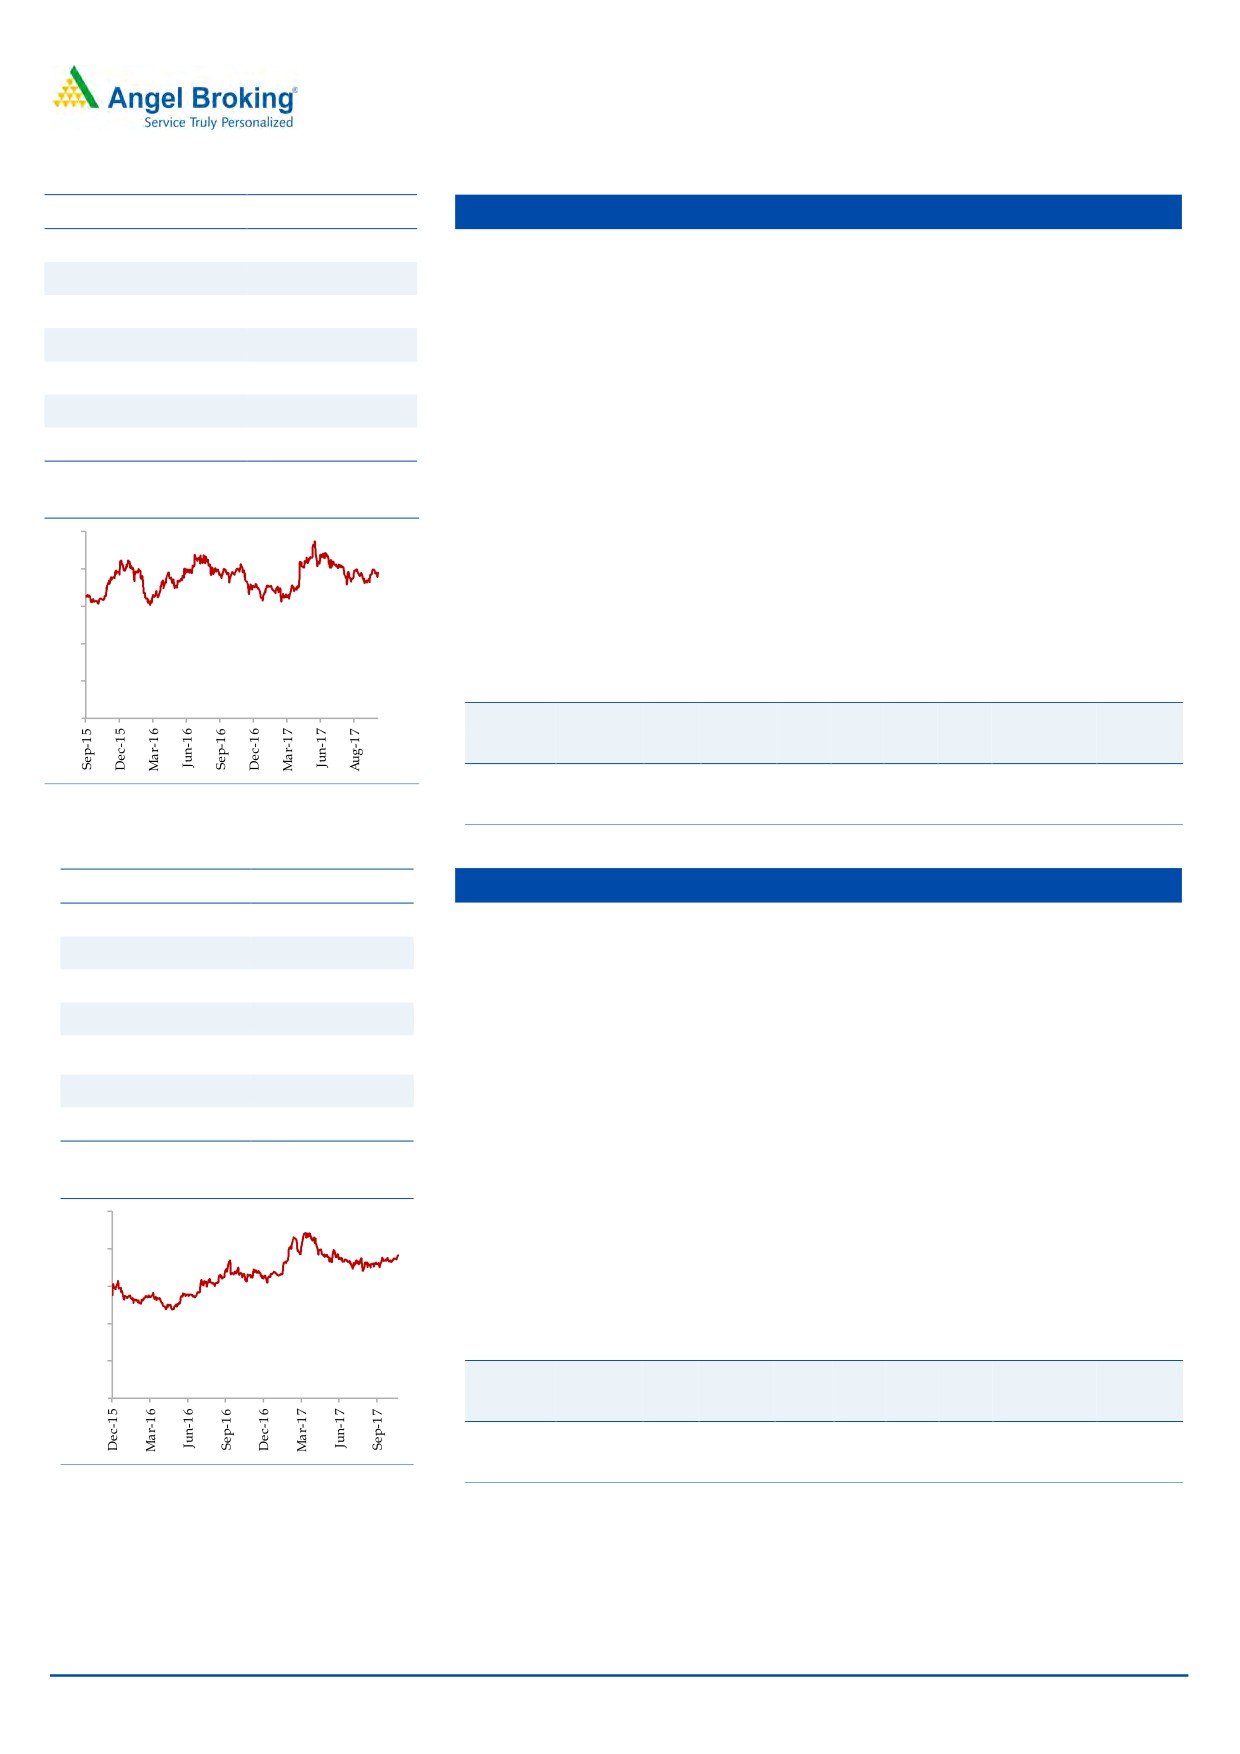
Stock Info
Dewan Housing
CMP
666
Loan growth to remain strong going ahead: Backed by healthy capital
TP
762
adequacy and increasing demand for home loans DHFL’s loan book is
Upside
14.5%
expected to report 23% loan growth over next two three years.
Sector
Financials
Strong Capital adequacy lends visibility for growth: DHFL sold 50% stake held
Market Cap (` cr)
20,876
by it in DFHFL Pramerica Life Insurance Co Ltd which added `1,969 cr to its
Beta
2.1
net worth and increases its CAR by 400 bps, to 19.3% which should fuel
52 Week High / Low
679 / 213
growth for next 2-3 years.
Asset quality has been strong: Strong NIM on the back of lower cost of funds
3 year-Chart
and lower credit cost will ensure healthy return ratios for the company. Despite
700
strong growth the company has maintained stable asset quality and we expect
600
the trend to continue.
500
Outlook: We expect the company’s loan growth to remain 23% over next two
400
years and earnings growth is likely to be more than 28%.The stock currently
300
trades at 2.2x FY2019E ABV. We maintain Buy on the stock with a target price of
200
`762.
100
-
Key Financials
Y/E
Op. Inc NIM
PAT
EPS
ABV ROA ROE P/E P/ABV
March
(` cr)
(%)
(` cr)
(`)
(`)
(%)
(%)
(x)
(x)
Source: Company, Angel Research
FY2018E
2,279
2.4
1,171
37.4
268
1.3
13.8
17.9
2.5
FY2019E
2,927
2.7
1,556
49.7
305
1.5
16.2
13.5
2.2
Source: Company, Angel Research
Stock Info
Karur Vysa Bank
CMP
127
Loan growth to pick up from FY18 onwards: KVB had a fairly strong loan
TP
161
CAGR of 14.9% over FY11-17.However, FY17 was year of consolidation and
Upside
27%
loan book grew by only 4.7%. We expect loan growth to pick up to 11% over
Sector
Banking
FY17-19. Deposit growth is expected at 9% during the period.
Market Cap (` cr)
7,699
Asset quality likely to stabilize going ahead: KVB’s slippages remained high
during FY17 and hence GNPAs % went up to 3.58% vs 1.3%. However, large
Beta
0.9
part of the troubled accounts has been classified as NPAs and hence gradually
52 Week High / Low
150 / 74
we expect the asset quality to improve. While in Q1FY18 we saw some
pressure on asset quality, it still remained fairly under control.
3 year-Chart
NIM likely to see further improvement: There were 25 bps improvements in
160
NIM during FY17, with share of CASA growing and cost of fund coming down
140
NIM is expected to improve further going ahead.
120
100
Outlook: We expect KVB to post a strong loan book & earnings CAGR of 11%
80
& 22% over FY2017-19E. The stock currently trades at 1.4x FY2019E ABV. We
60
have a BUY rating on the stock.
40
20
Key Financials
-
Y/E
Op. Inc NIM
PAT
EPS
ABV ROA ROE P/E P/ABV
March
(` cr)
(%)
(` cr)
(`)
(`)
(%)
(%)
(x)
(x)
FY2018E
2,388
3.7
660
10.8
77.8
1
12.5
11.8
1.6
Source: Company, Angel Research
FY2019E
2,757
3.9
858
14.1
89.6
1.2
14.7
9.0
1.4
Source: Company, Angel Research
November 6, 2017
3
Top Picks Report | November 2017
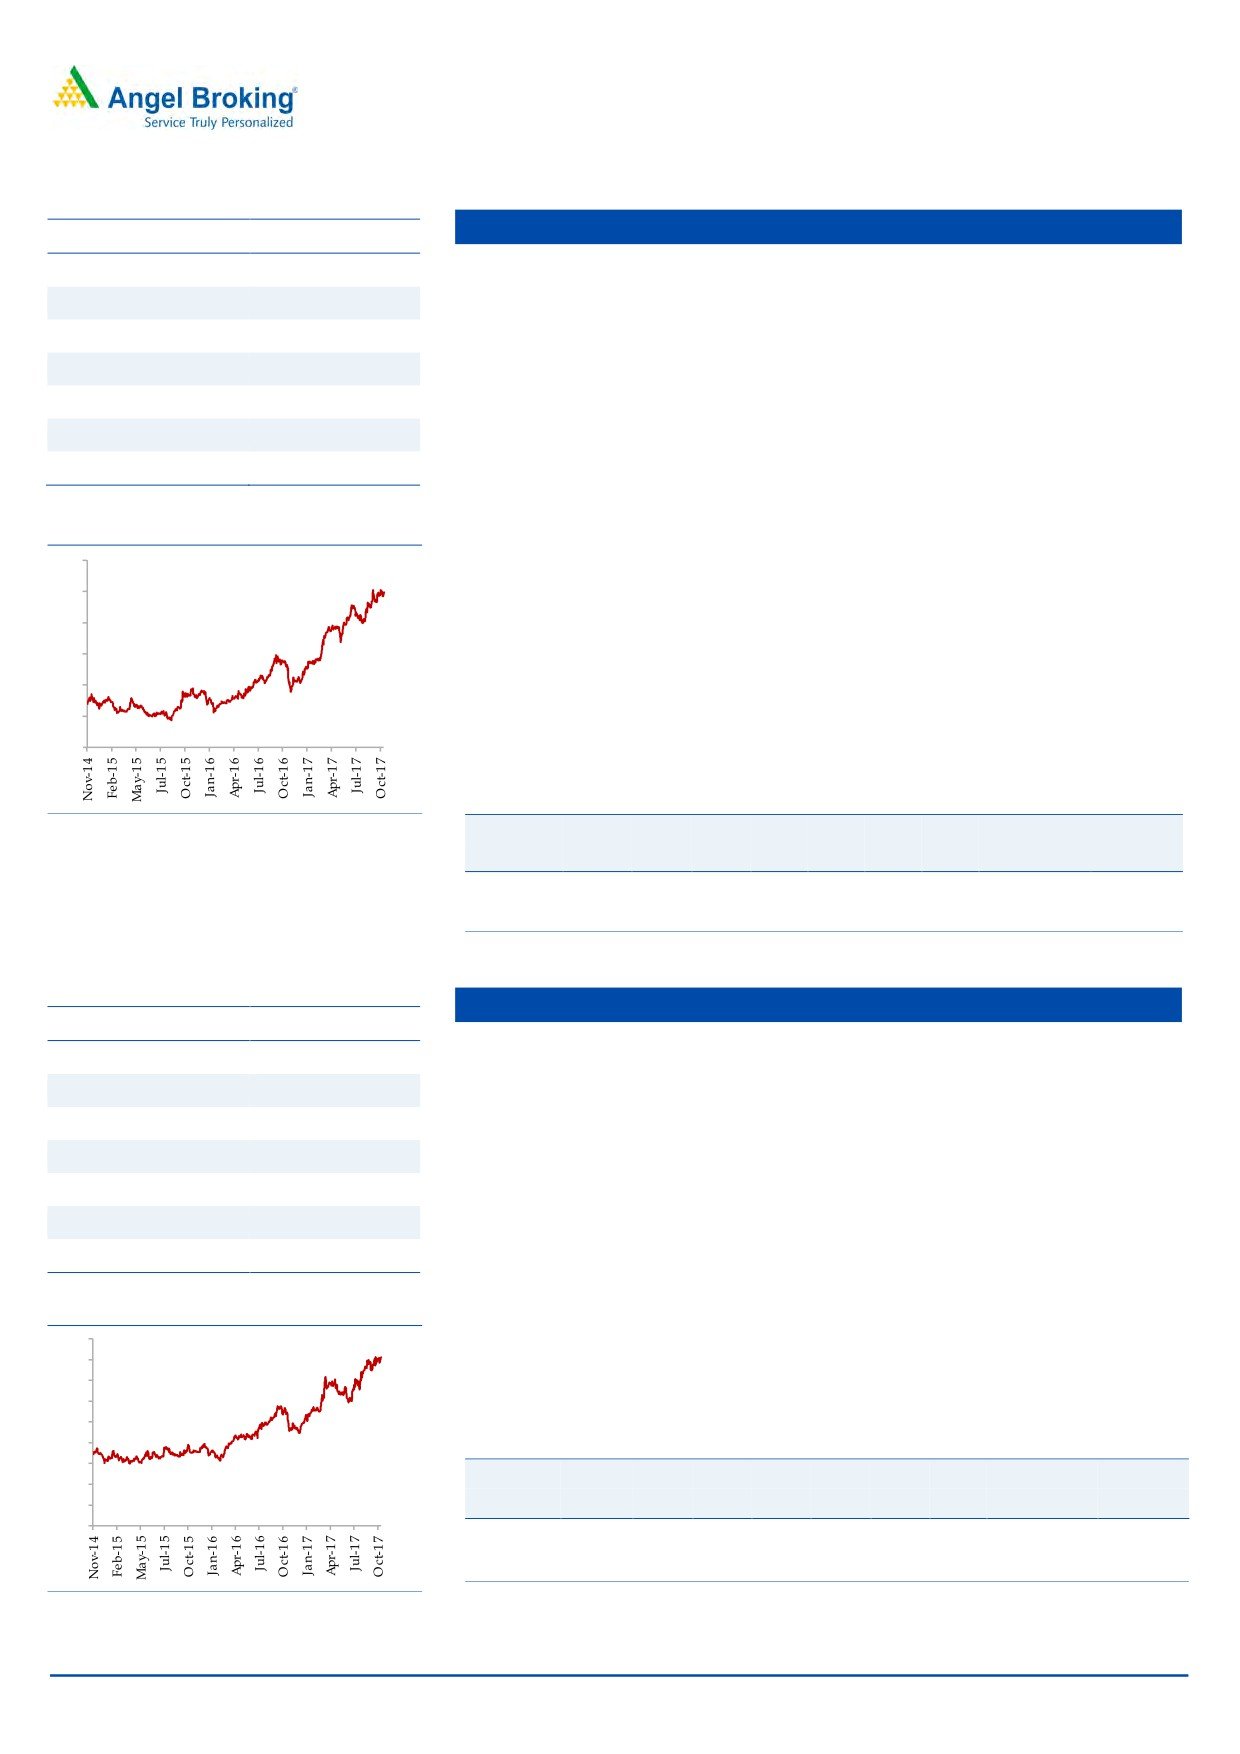
Asian Granito
Stock Info
CMP
495
AGIL’s current, vitrified sales (35%) are lower as compared to its peers like
Somany Ceramics (47%) and Kajaria Ceramics (61%). Recently, AGIL has
TP
572
launched various products in premium segment. Going forward, we expect
Upside
15%
AGIL’s profit margin to improve due to increase in focus for higher vitrified
Sector
Cons. Durable
product sales, which is a high margin business.
Market Cap (` cr)
1,488
AGIL is continuously putting efforts to increase the B2C sales from the current
Beta
1.9
level (35-36% in FY17). It is expected to reach up to 50% in next 2-3 years on
52 Week High / Low
518 / 176
the back of various initiatives taken by AGIL to increase direct interaction with
customers like strengthening distribution network, participation in key trade
exhibition, etc.
3 year-Chart
In July FY2016, AGIL acquired Artistique Ceramic which has a better margin
600
profile. Going forward, we expect the company to improve its operating
500
margin from 7.5% in FY16 (excluding merger) to
12-12.5% in coming
400
financial year. Artisique Ceramics has a contract with RAS GAS to supply
300
quality natural gas at a discounted rate of 50% to current market rate, which
200
would reduce the overall power & fuel cost of the company.
100
We expect AGIL to report a net revenue CAGR of ~8.5% to ~`1,286cr and
net profit CAGR of ~23% to `59cr over FY2017-19E. We recommend a Buy
-
rating on the stock.
Key Financials
Source: Company, Angel Research
Y/E
Sales OPM PAT EPS ROE P/E P/BV EV/EBITDA EV/Sales
March
(` cr)
(%)
(` cr)
(`)
(%)
(x)
(x)
(x)
(x)
FY2018E
1,169
12.5
48
16.0
10.7
31.0
3.3
12.0
1.5
FY2019E
1,286
12.5
59
19.7
11.6
25.1
2.9
10.7
1.3
Source: Company, Angel Research
Blue Star
Stock Info
CMP
692
BSL is one of the largest air-conditioning companies in India. With a mere 3%
penetration level of ACs vs 25% in China, the overall outlook for the room air-
TP
867
conditioner (RAC) market in India is favourable.
Upside
25%
BSL's RAC business has been outgrowing the industry by ~10% points over the
Sector
Cons. Durable
last few quarters, resulting in the company consistently increasing its market
Market Cap (` cr)
6,626
share. This has resulted in the Cooling Products Division (CPD)'s share in
Beta
0.7
overall revenues increasing from~23% in FY2010 to ~45% in FY2017
52 Week High / Low
826 / 436
(expected to improve to ~47-48% in FY2018E). With strong brand equity and
higher share in split ACs, we expect the CPD to continue to drive growth.
3 year-Chart
Aided by increasing contribution from the Unitary Products, we expect the
900
overall top-line to post a revenue CAGR of ~19% over FY2017-19E and
800
700
margins to improve from
5.8% in FY2017 to
6.6% in FY2019E. We
600
recommend an buy rating on the stock.
500
400
Key Financials
300
Y/E
Sales OPM PAT EPS ROE P/E P/BV EV/EBITDA EV/Sales
200
100
March
(` cr)
(%)
(` cr)
(`)
(%)
(x)
(x)
(x)
(x)
-
FY2018E
5,220
6.3
161
16.8
19.0
41.2
8.2
25.3
1.2
FY2019E
6,207
6.6
214
22.3
23.3
31.1
7.2
18.7
1.0
Source: Company, Angel Research
Source: Company, Angel Research
November 6, 2017
4
Top Picks Report | November 2017
Stock Info
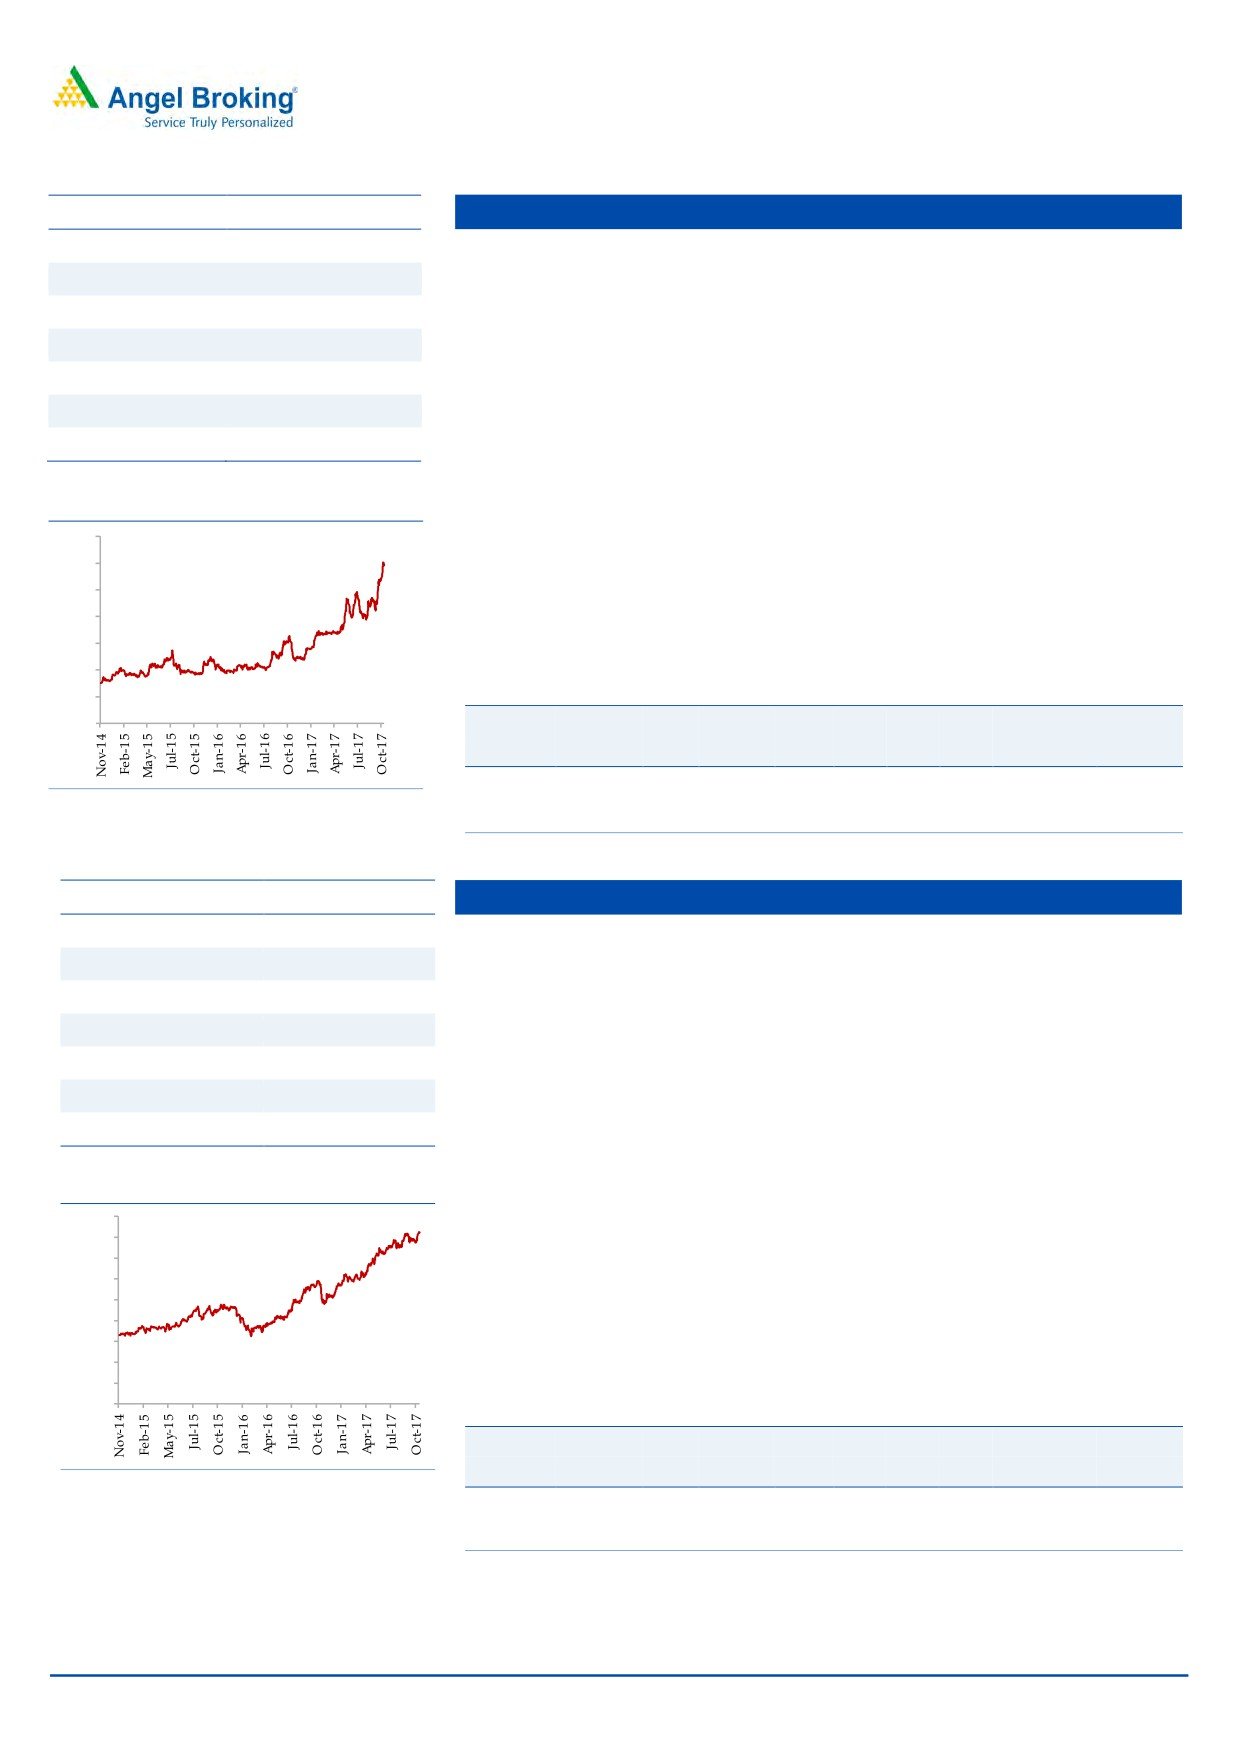
Siyaram Silk Mills
CMP
607
SSML has strong brands which cater to premium as well as popular mass
TP
650
segments of the market. Further, SSML entered the ladies' salwar kameez and
Upside
7%
ethnic wear segment. Going forward, we believe that the company would be able to
Sector
Textile
leverage its brand equity and continue to post strong performance.
Market Cap (` cr)
2,845
The company has a nationwide network of about 1,600 dealers and business
partners. It has a retail network of 160 stores and plans to add another
Beta
0.9
300-350 stores going forward. Further, the company's brands are sold across
52 Week High / Low
222/626
3,00,000 multi brand outlets in the country.
Going forward, we expect SSML to report a net sales CAGR of ~12% to
3 year-Chart
~`1,981cr and adj.net profit CAGR of ~16% to `123cr over FY2017-19E on
700
back of market leadership in blended fabrics, strong brand building, wide
600
distribution channel, strong presence in tier II and tier III cities and emphasis
500
on latest designs and affordable pricing points. At the current market price,
400
SSML trades at an inexpensive valuation. We have an accumulate
300
recommendation on the stock and target price of `650.
200
100
Key Financials
-
Y/E
Sales
OPM PAT EPS ROE P/E P/BV EV/EBITDA EV/Sales
March
(` cr)
(%)
(` cr)
(`)
(%)
(x)
(x)
(x)
(x)
FY2018E
1,769
12.7
106
113.1
15.4
26.8
4.1
13.3
1.8
Source: Company, Angel Research
FY2019E
1,981
12.7
123
131.1
15.5
23.1
3.6
11.9
1.6
Source: Company, Angel Research
Stock Info
Maruti Suzuki
CMP
8,216
The Automobile sector is expected to benefit from the GST implementation.
TP
8,890
The sector has seen a pick up in the volumes in FY17 as there were several
Upside
8%
positive factors like normal monsoon and lower interest rates.
Sector
Automobiles
Maruti Suzuki continues to hold ~51% market share in the passenger vehicles.
Market Cap (` cr)
2,48,201
The launch of exciting models has helped the company to ride on the
premiumization wave that is happening in the country. In the last two years,
Beta
1.2
company has seen improvement in the business mix with the pie of the utility
52 Week High / Low
8,370/4,769
vehicles growing from ~4% to current 15%. With the 3-4 months of waiting
period on these models, strong demand and GST led price decrease; we
3 year-Chart
believe that this pie is expected to grow to ~20% in FY19E.
9,000
Due to the favorable business mix, company has also been seeing
8,000
7,000
improvement in the margins. Company has already moved from ~11-12%
6,000
EBITDA margin range in FY14 to current ~17% margin range in 2QFY18.
5,000
Together with higher operating leverage at Gujarat plant, increasing Nexa
4,000
3,000
outlets, and improving business mix, we believe that company has further
2,000
room to improve its margins. We have an accumulate rating on the stock.
1,000
-
Key Financials
Y/E
Sales
OPM PAT EPS ROE P/E P/BV EV/EBITDA EV/Sales
March
(` cr)
(%)
(` cr)
(`)
(%)
(x)
(x)
(x)
(x)
Source: Company, Angel Research
FY2018E
80,985
15.6
8,526
282.3
21.8
29.1
6.3
17.5
2.7
FY2019E
97,917
16.9
11,187
370.4
23.1
22.2
5.1
12.7
2.2
Source: Company, Angel Research
November 6, 2017
5
Top Picks Report | November 2017
Stock Info
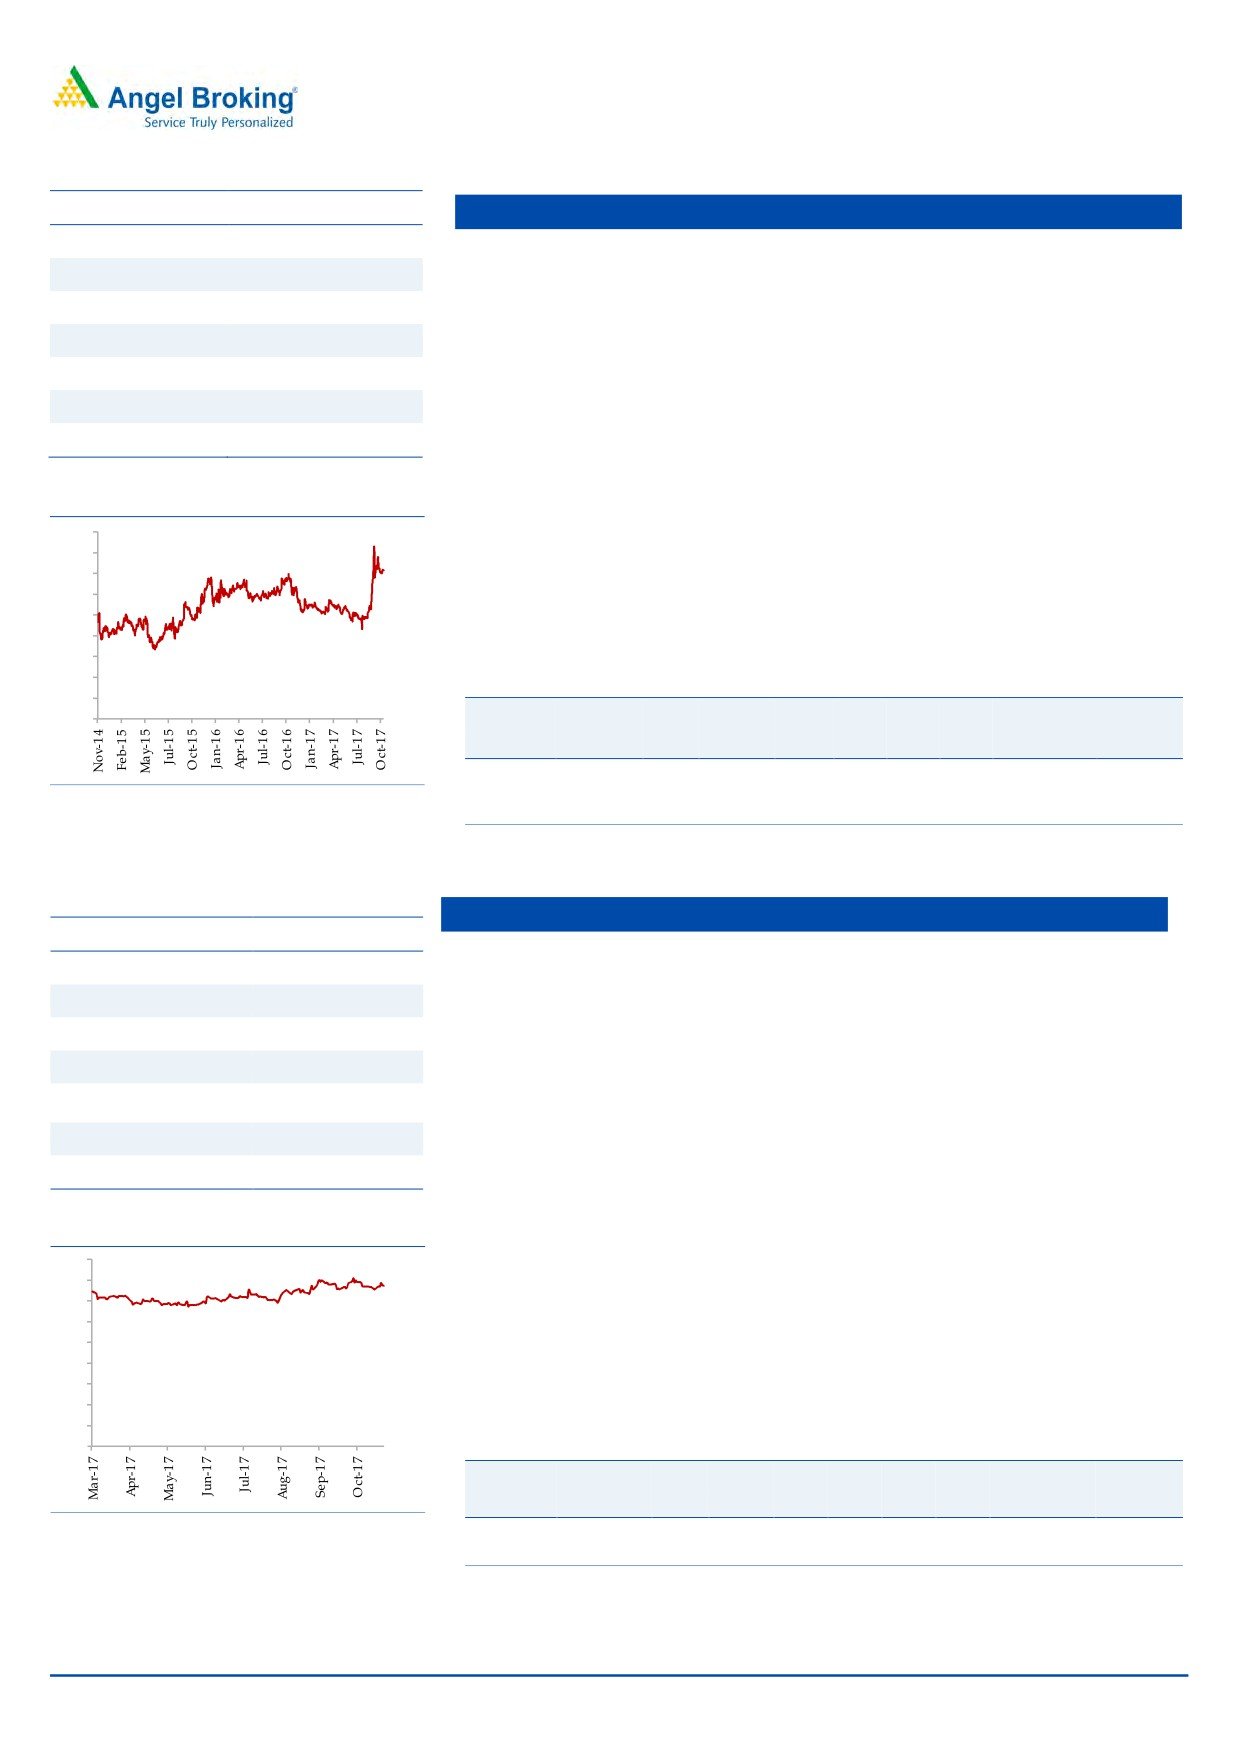
TV Today Network
CMP
379
TTNL enjoys a strong viewership ranking in the Hindi and English news
TP
435
channel categories. The company’s Hindi news channel - Aaj Tak has
Upside
15%
maintained its market leadership position occupying the No.1 rank for several
Sector
Media
consecutive years in terms of viewership. Its English news channel - India
Today too has been continuously gaining viewership; it has now captured the
Market Cap (` cr)
2,263
No. 2 ranking from No. 4 earlier. Its other channels like Dilli Aaj Tak and Tez
Beta
0.6
are also popular among viewers.
52 Week High / Low
434 /210
TTNL is a play of higher operating leverage that would be visible as
advertisement revenues gain traction. Going ahead, we expect EBITDA
3 year-Chart
margins would improve.
450
400
350
We expect TTNL to report a net revenue CAGR of ~9% to ~`727cr and net
300
profit CAGR of ~14% to `121cr over FY2017-19E. We have a buy rating on
250
the stock
200
150
100
Key Financials
50
-
Y/E
Sales
OPM PAT EPS ROE P/E P/BV EV/EBITDA EV/Sales
March
(` cr)
(%)
(` cr)
(`)
(%)
(x)
(x)
(x)
(x)
FY2018E
667
27.7
111
18.6
15.6
20.4
3.2
10.5
2.9
Source: Company, Angel Research
FY2019E
727
27.7
121
20.1
17.3
18.7
3.2
9.8
2.7
Source: Company, Angel Research
Music Broadcast
Stock Info
Radio Industry is protected by licenses for 15 years, thereby restricting the entry
CMP
387
of new players. This would support the existing companies to strengthen their
TP
434
position and maintain a healthy growth rate.
Upside
12.1%
It has grabbed the Number 1 position in Mumbai, Bengaluru and Delhi in
Sector
Media
terms of number of listener. This is helping MBL to charge premium rate,
Market Cap (` cr)
2,206
which resulting into higher EBITDA margin (33.6%) compare to 22% of ENIL.
Beta
0.6
MBL outperformed its closest peer with 18.4% CAGR in revenue over FY2013-
52 Week High / Low
415/333
17 (ENIL reported 13.2% CAGR in revenue). On the profitability front too,
MBL, with 32.3% CAGR in PAT over FY2013-17, has performed much better
3 year-Chart
than ENIL (-5.2% CAGR in PAT). Moreover, Radio City posted a six year CAGR
450
of 12.1% v/s. 9.1% of industry owing to higher advertising volumes.
400
350
Capex for 39 licenses have been done for the next 15 years, hence no heavy
300
incremental Capex requirement would emerge. Moreover, the maintenance
250
Capex would be as low as `5-10cr. This would leave sufficient cash flow to
200
150
distribute as dividend. We have a Buy recommendation on the stock and
100
target price of `434.
50
-
Key Financials
Y/E
Sales
OPM PAT EPS ROE P/E P/BV EV/EBITDA EV/Sales
March
(` cr)
(%)
(` cr)
(`)
(%)
(x)
(x)
(x)
(x)
Source: Company, Angel Research
FY2018E
317
34.4
56
9.8
9.3
39.4
3.7
18.5
6.4
FY2019E
372
34.9
80
14.0
12.0
27.7
3.3
15.0
5.2
Source: Company, Angel Research
November 6, 2017
6
Top Picks Report | November 2017
Stock Info
KEI Industries
CMP
338
KEI’s current order book (OB) stands at `2,780cr (segmental break-up:
TP
371
`1,990cr in EPC, `560cr in Cable & `230cr in EHV). Its OB grew by ~28% in
Upside
19%
the last 3 years due to strong order inflows from State Electricity Boards, Power
Sector
Cable
grid, etc.
Market Cap (` cr)
2,425
KEI’s consistent effort to increase its retail business from 30-32% of revenue in
Beta
0.9
FY17 to 40-45% of revenue in the next 2-3 years on the back of strengthening
52 Week High / Low
367 / 99
distribution network (currently 926 which is expect to increase `1,500 by FY19)
and higher ad spend (increased from `2cr in FY13 to `7.5cr in FY17 and
expected to spend).
3 year-Chart
400
KEI’s export (FY17 - 8-10% of revenue) is expected to reach a level of ~14-
350
15% in next two years with higher order execution from current OB and
300
participation in various international tenders. We expect a strong ~26%
250
200
growth CAGR over FY2017-19 in exports. We expect KEI to report net revenue
150
CAGR of ~14% to ~`3,392cr and net profit CAGR of ~13% to `125cr over
100
FY2017-19E. Hence we have a Buy rating on the stock.
50
-
Key Financials
Y/E
Sales
OPM PAT EPS ROE P/E P/BV EV/EBITDA EV/Sales
March
(` cr)
(%)
(` cr)
(`)
(%)
(x)
(x)
(x)
(x)
Source: Company, Angel Research
FY2018E
3,001
10.0
100
13.0
18.2
26.0
4.7
10.4
1.0
FY2019E
3,392
10.0
125
16.1
18.7
21.0
3.9
9.2
0.9
Source: Company, Angel Research
Stock Info
GIC Housing Finance Ltd
CMP
481
Backed by the new management, GICHF is aiming for 2.0x growth in the loan
TP
655
book over the period of FY16-FY19E to `16,000cr. GICHF has healthy capital
Upside
37%
adequacy, and is seeing an increase in demand for home loans. GICHF’s
Sector
Financials
loan book is expected to report 24.3% loan growth over next two years.
GICHF is consistently decreasing bank borrowing and increasing high yield
Market Cap (` cr)
2,586
loan book which is expected to boost its Net Interest Margin. The share of
Beta
1.7
bank borrowing was 75% in FY15, which fell to 55% in FY17. In our opinion,
52 Week High / Low
623 /251
the impetus on lower bank borrowings and increasing high yield loan book is
likely to result in 17bps NIM over FY16-FY19E.
3 year-Chart
GICHF’s asset quality is on the higher side compared to other HFCs (As on
700
FY17 GNPA-2.3% and NPA-0.3%). This is primarily due to GICHF has not
600
written off any bad asset and has not sold any bad assets to ARC. New
500
Management is expediting asset quality improvement.
400
We expect the GICHF’s loan growth to grow at a CAGR of 24.3% over next
300
two years and RoA/RoE to improve from 1.7%/19.0% in FY17 to 2.0%/23.0%
200
in FY19E.The stock is currently trading at 2.2x FY2019E ABV. We have a Buy
100
rating on the stock.
-
Key Financials
Y/E
Op. Inc NIM
PAT
EPS
ABV ROA ROE P/E P/ABV
Source: Company, Angel Research
March
(` cr)
(%)
(` cr)
(`)
(`)
(%)
(%)
(x)
(x)
FY2018E
376
3.6
180
33
184
1.7
20
14
2.6
FY2019E
477
3.7
215
40
219
1.9
23
12
2.2
Source: Company, Angel Research
November 6, 2017
7
Top Picks Report | November 2017
Stock Info
Navkar
CMP
195
NCL is one of the largest and one of the three CFS at JNPT with rail
TP
265
connectivity, helping it garner high market share at the port. NCL is in a massive
Upside
35%
expansion mode where it is increasing its capacity by 234% to 1,036,889 TEUs
Sector
Logistics
at JNPT and coming up with an ICD at Vapi (with Logistics Park).
Market Cap (` cr)
2,778
The ICD with rail link should benefit from first mover advantage in a region
Beta
1.0
that has huge market potential and accounts for ~27% of volumes at JNPT.
The ICD should be able to capture the EXIM volumes from the region through
52 Week High / Low
247 / 155
rail link that till now was being custom cleared at JNPT (Import) or being
transported via road and consolidated at JNPT (Export). South Gujarat
3 year-Chart
volumes will now head straight to the Vapi ICD; thus the company can now
250
cater to bulk commodities and domestic traffic that it had been rejecting owing
200
to capacity constraints at CFS.
150
We expect NCL to successfully use its rail advantage and scale up its
100
utilizations at both JNPT and Vapi ICD. We have a Buy rating on the stock.
50
Key Financials
-
Y/E
Sales
OPM PAT EPS ROE P/E P/BV EV/EBITDA EV/Sales
March
(` cr)
(%)
(` cr)
(`)
(%)
(x)
(x)
(x)
(x)
FY2018E
450
41.5
124
8.7
8.4
22.5
1.8
16.6
6.9
Source: Company, Angel Research
FY2019E
617
41.5
181
12.7
11.0
15.4
1.6
12.0
5.0
Source: Company, Angel Research
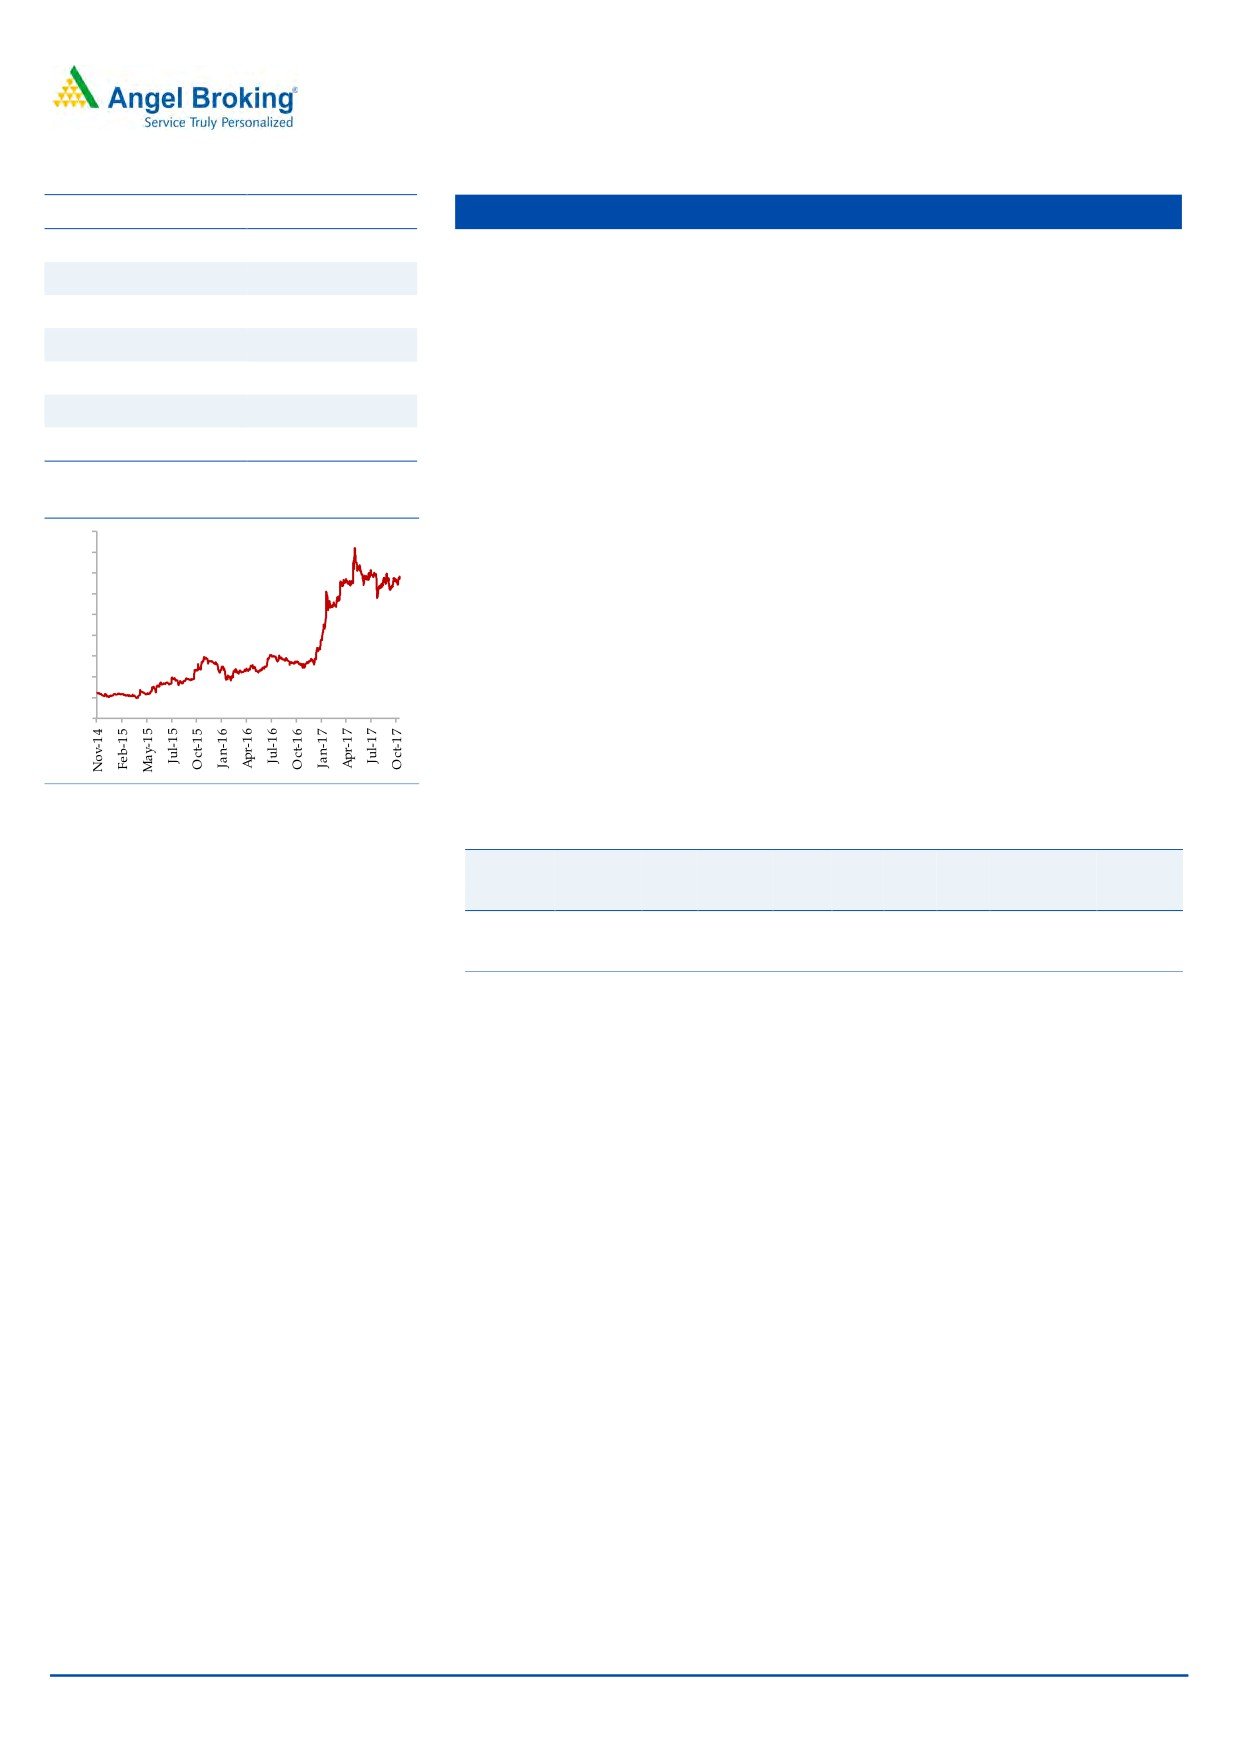
Stock Info
Alkem Laboratories
CMP
1,926
Alkem is 5th largest pharma company is the domestic market and also has
TP
2,125
presence in US. It derives 73% of its revenues come from the Indian markets
Upside
10%
while rest come from the other countries. Alkem has leadership position in the
domestic anti infective segment and it is ranked #3 in Gastro-Intestinal and
Sector
Pharmaceutical
Pain/Analgesics segments. Company holds ~3.6% and ~7.9% market share
Market Cap (` cr)
23,028
in the formulations and overall prescriptions in the country.
Beta
0.4
In the domestic market, company operates in acute and chronic segments. It is
52 Week High / Low
2,400 /1,455
a prominent player in acute segment has forayed in chronic segment from
which it expects faster growth. Alkem has been outperforming the domestic
3 year-Chart
industry growth which is likely to continue. Company is focusing on
2,500
monetization of its pipeline (92 ANDAs) in the US with high single digit ANDA
launches to grow the US revenues at ~20% growth rate from FY17-FY19E.
2,000
Overall outlook remains strong with 9% CAGR in the topline and 13% CAGR
1,500
in the bottom-line. We have an accumulate rating on the stock.
1,000
Key Financials
500
Y/E
Sales
OPM PAT EPS ROE P/E P/BV EV/EBITDA EV/Sales
-
March
(` cr)
(%)
(` cr)
(`)
(%)
(x)
(x)
(x)
(x)
FY2018E
6,320
17.5
869
72.7
17.7
26.5
4.7
20.4
3.6
FY2019E
7,341
19.8
1,155
96.6
19.8
19.9
4.0
15.2
3.0
Source: Company, Angel Research
Source: Company, Angel Research
November 6, 2017
8
Top Picks Report | November 2017
Stock Info
LT Foods
CMP
73
LT Foods LTD (LTFL) is a branded specialty Foods Company engaged in
TP
96
milling, processing and marketing of branded and non-branded basmati rice
Upside
31%
and manufacturing of rice food products in the domestic and overseas
Sector
Food Processing
markets.
Market Cap (` cr)
1,960
LTFL’s flagship brand Daawat enjoys 22% market share in the branded rice
Beta
1.0
market of India. The company also has strong market share in North America
52 Week High / Low
84 / 21
selling Basmati rice under the brand name ‘Royal’. Currently it has access to
1,40,000 traditional retail outlets Reach -93% of towns with over 2 lakh
3 year-Chart
population Access to 3000 Wholesalers. Moreover, it has also strong network
90
in modern trade. LTFL is the 1st Rice company to place Brown Basmati Rice in
80
70
Medical Chains.
60
50
The company has a well-diversified product basket catering to consumers of
40
all income groups. The company is present in segments like Basmati rice,
30
20
Specialty rice (non-Basmati) and Other food products.
10
-
Overall outlook remains strong with ~14% CAGR in the top-line and 20 %
CAGR in the bottom-line. We recommend Buy on the stock with Target Price of
`96 (15x FY2019E EPS).
Source: Company, Angel Research
Key Financials
Y/E
Sales OPM
PAT EPS ROE P/E P/BV EV/EBITDA EV/Sales
March
(` cr)
(%)
(` cr)
(`)
(%)
(x)
(x)
(x)
(x)
FY2018E
3,747
11.5
139
5.2
17.5
14.0
2.4
8.2
0.9
FY2019E
4,234
11.5
170
6.4
17.6
11.4
2.0
7.2
0.8
Source: Company, Angel Research
November 6, 2017
9
Top Picks Report | November 2017
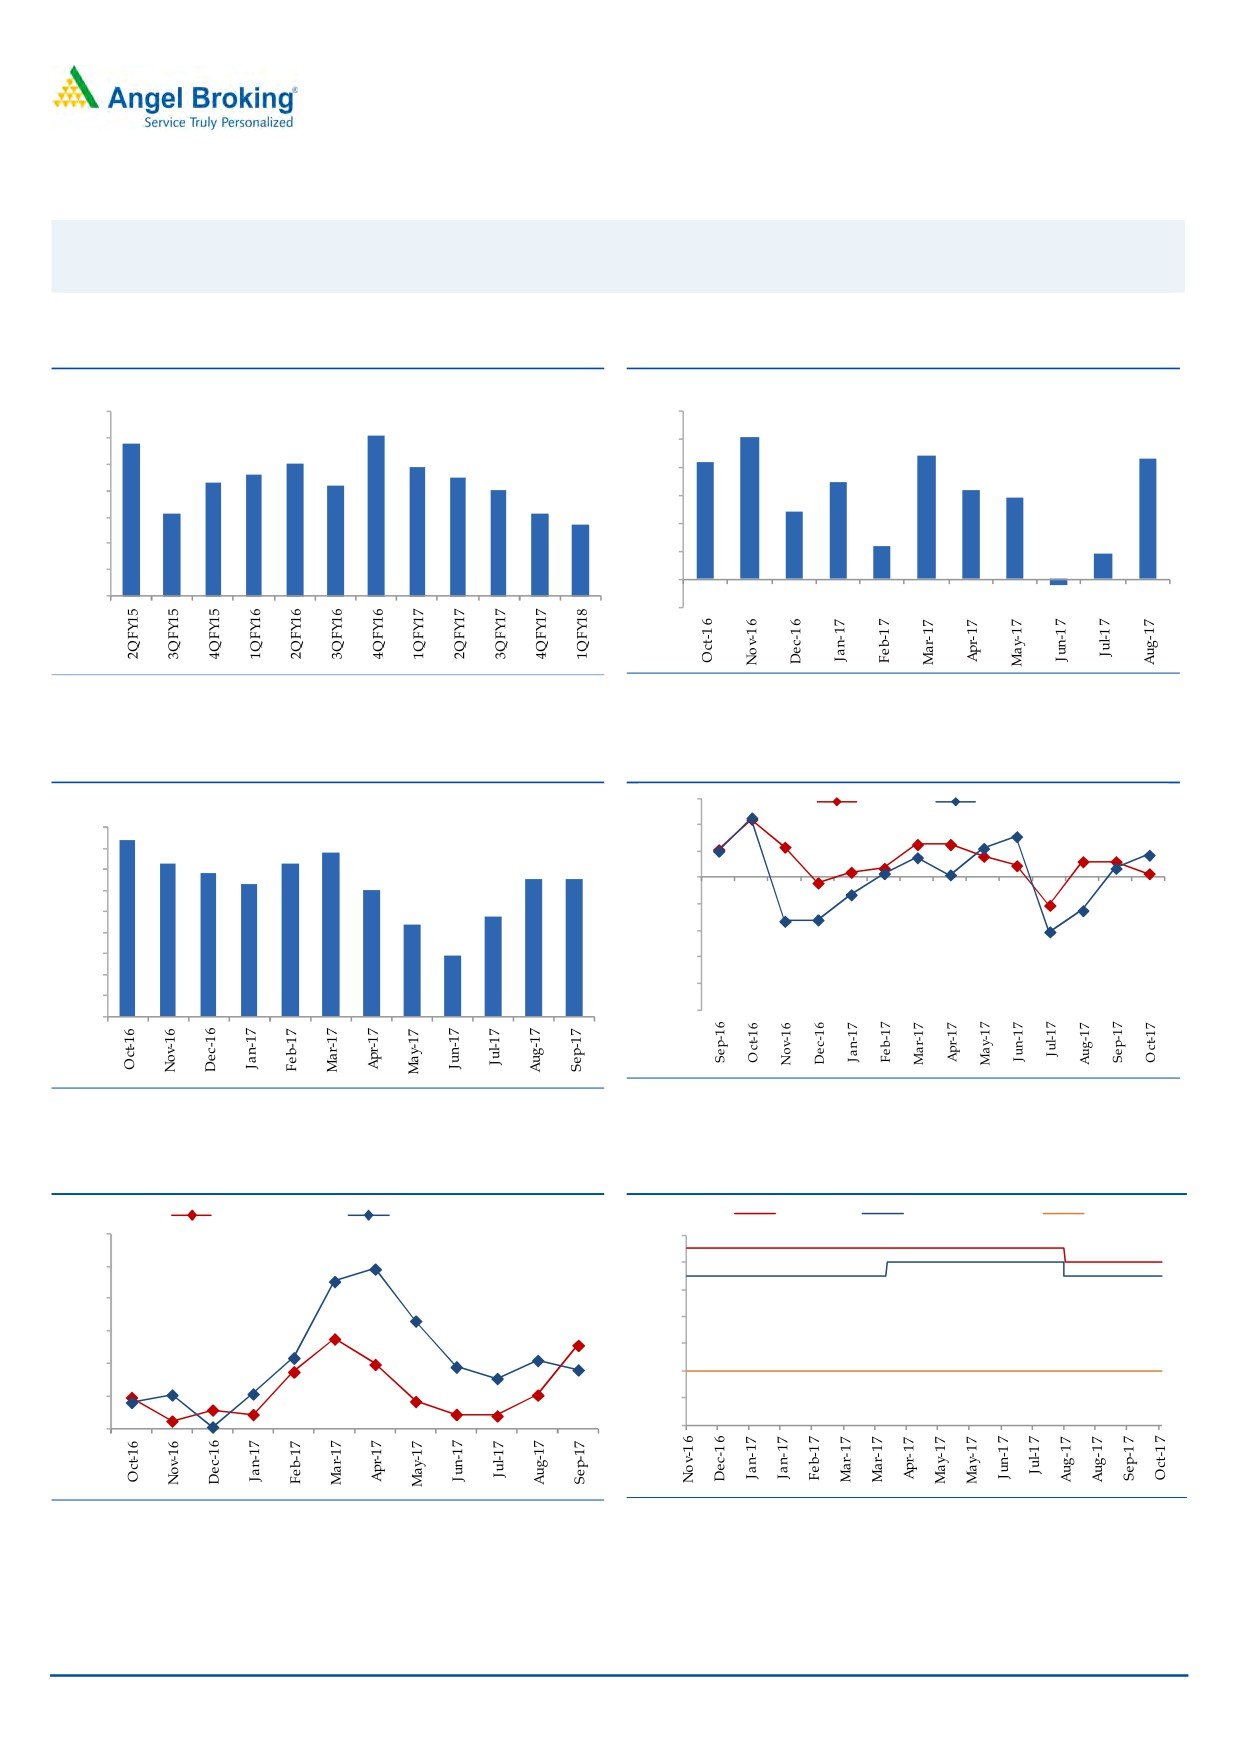
Macro watch
Exhibit 1: Quarterly GDP trends
Exhibit 2: IIP trends
(%)
(%)
10.0
6.0
9.1
5.1
8.8
9.0
5.0
4.4
4.3
8.0
7.9
4.2
7.6
7.5
8.0
7.3
7.2
4.0
3.5
7.0
3.2
2.9
7.0
6.1
6.1
3.0
2.4
5.7
6.0
2.0
1.2
0.9
5.0
1.0
4.0
-
3.0
(1.0)
(0.2)
Source: CSO, Angel Research
Source: MOSPI, Angel Research
Exhibit 3: Monthly CPI inflation trends
Exhibit 4: Manufacturing and services PMI
56.0
Mfg. PMI
Services PMI
(%)
4.5
4.2
54.0
3.9
4.0
3.6
3.7
52.0
3.4
3.2
3.3
3.3
3.5
3.0
50.0
3.0
2.4
48.0
2.5
2.2
2.0
46.0
1.5
1.5
44.0
1.0
42.0
0.5
40.0
-
Source: Market, Angel Research; Note: Level above 50 indicates expansion
Source: MOSPI, Angel Research
Exhibit 5: Exports and imports growth trends
Exhibit 6: Key policy rates
(%)
Exports yoy growth
Imports yoy growth
(%)
Repo rate
Reverse Repo rate
CRR
60.0
6.50
50.0
6.00
5.50
40.0
5.00
30.0
4.50
20.0
4.00
10.0
3.50
0.0
3.00
Source: Bloomberg, Angel Research
Source: RBI, Angel Research
November 6, 2017
10
Top Picks Report | November 2017
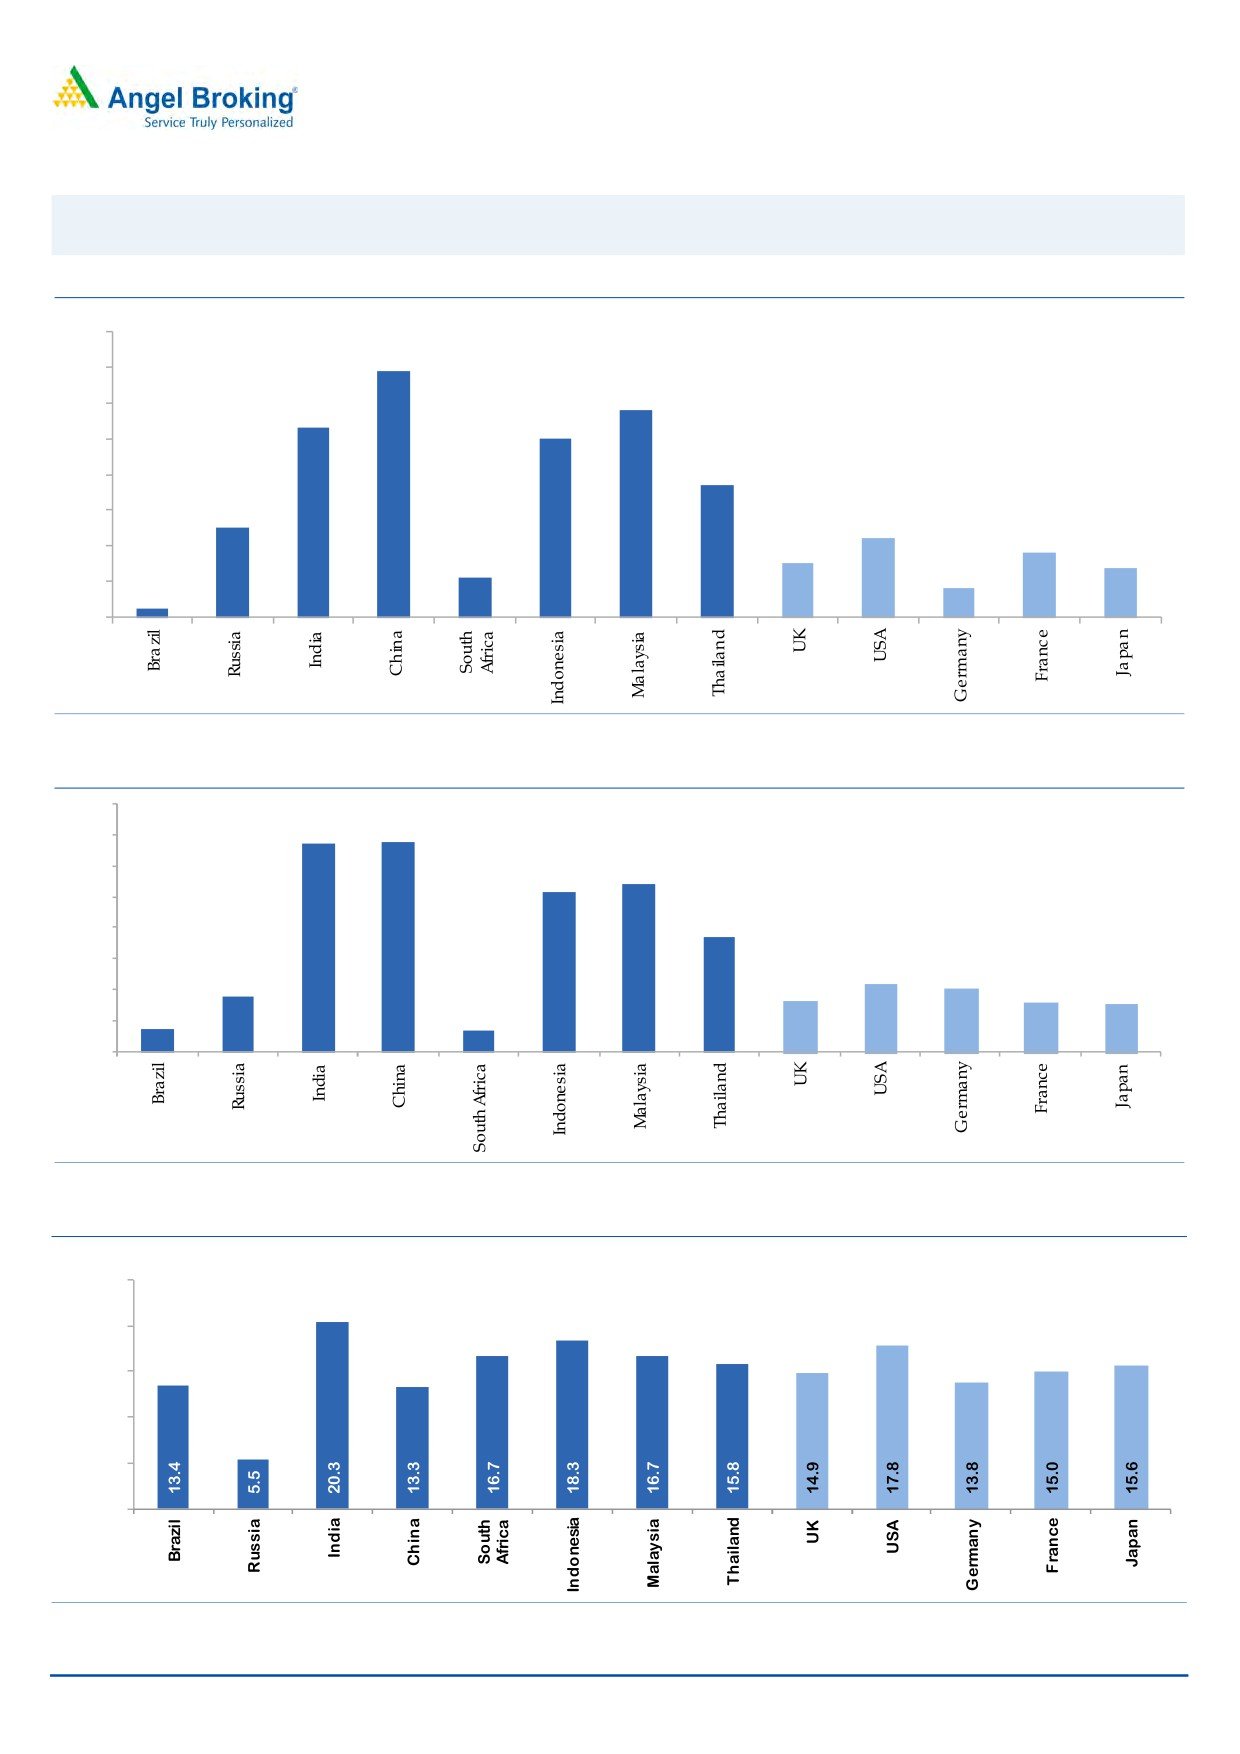
Global watch
Exhibit 8: Latest quarterly GDP Growth (%, yoy) across select developing and developed countries
(%)
8.0
6.9
7.0
5.8
6.0
5.3
5.0
5.0
1.1
3.7
4.0
2.5
3.0
2.2
1.8
2.0
1.5
1.4
0.8
1.0
0.3
-
Source: Bloomberg, Angel Research
Exhibit 9: 2017 GDP Growth projection by IMF (%, yoy) across select developing and developed countries
(%)
6.7
6.8
7.0
6.0
5.4
5.2
5.0
3.7
4.0
3.0
1.8
2.2
2.0
1.7
1.6
2.0
0.7
1.5
0.7
1.0
-
Source: IMF, Angel Research
Exhibit 10: One year forward P-E ratio across select developing and developed countries
(x)
25.0
20.0
15.0
10.0
5.0
-
Source: IMF, Angel Research
November 6, 2017
11
Top Picks Report | November 2017
Exhibit 11: Relative performance of indices across globe
Returns (%)
Country
Name of index
Closing price
1M
3M
1YR
Brazil
Bovespa
73,915
(0.6)
11.0
14.8
Russia
Micex
2,081
0.4
5.9
6.0
India
Nifty
10,453
6.0
3.3
21.2
China
Shanghai Composite
3,372
0.8
3.0
8.2
South Africa
Top 40
53,199
5.2
7.9
19.6
Mexico
Mexbol
48,535
(4.3)
(5.8)
3.5
Indonesia
LQ45
1,006
1.4
3.4
8.0
Malaysia
KLCI
1,741
(1.1)
(1.1)
4.0
Thailand
SET 50
1,079
0.9
7.6
14.9
USA
Dow Jones
23,539
3.9
6.8
31.2
UK
FTSE
7,560
1.2
0.6
11.1
Japan
Nikkei
22,539
10.5
12.8
30.0
Germany
DAX
13,479
4.5
10.9
28.6
France
CAC
5,518
2.8
5.9
22.9
Source: Bloomberg, Angel Research
November 6, 2017
12
Top Picks Report | November 2017
Stock Watch
November 6, 2017
13
Top Picks Report
November 06, 2017
Company Name
Reco
CMP
Target
Mkt Cap
Sales ( Čcr )
OPM(%)
EPS (Č)
PER(x)
P/BV(x)
RoE(%)
EV/Sales(x)
(Č)
Price ( Č)
( Č cr )
FY18E FY19E
FY18E
FY19E
FY18E
FY19E
FY18E
FY19E
FY18E
FY19E
FY18E
FY19E
FY18E
FY19E
Agri / Agri Chemical
Rallis
Reduce
240
209
4,666
1,873
2,099
15.0
15.0
9.5
10.5
25.3
22.9
3.8
3.5
15.8
16.0
2.4
2.2
United Phosphorus
Accumulate
777
820
39,449
18,922
21,949
18.0
18.5
36.2
45.6
21.5
17.0
4.5
3.7
22.7
23.8
2.2
1.9
Auto & Auto Ancillary
Ashok Leyland
Neutral
124
-
36,187
23,339
27,240
10.1
10.8
4.7
6.2
26.6
19.9
5.3
4.7
20.0
23.6
1.5
1.3
Bajaj Auto
Neutral
3,223
-
93,266
23,936
27,955
19.5
20.1
142.7
167.3
22.6
19.3
4.9
4.4
21.8
22.8
3.5
2.9
Bharat Forge
Buy
706
875
32,850
7,637
8,755
21.7
23.2
36.1
47.3
19.6
14.9
3.5
3.0
18.5
20.8
4.2
3.5
Eicher Motors
Neutral
31,235
-
85,030
19,043
22,837
19.5
19.9
835.4
1,019.0
37.4
30.7
14.0
10.8
40.9
37.8
4.3
3.6
Gabriel India
Neutral
199
-
2,855
1,782
2,033
9.7
10.2
7.1
8.9
28.0
22.5
5.7
4.8
21.0
22.2
1.6
1.3
Hero Motocorp
Accumulate
3,691
4,129
73,704
32,239
36,878
16.0
15.6
184.4
206.5
20.0
17.9
6.3
5.5
31.3
30.7
2.1
1.8
Jamna Auto Industries Neutral
66
-
2,622
1,441
1,662
14.4
14.8
13.9
17.6
4.7
3.7
1.3
1.1
30.0
31.0
1.8
1.5
Mahindra and Mahindra Neutral
1,331
-
82,677
46,971
53,816
13.6
14.0
67.7
79.8
19.7
16.7
2.8
2.5
15.0
15.9
1.6
1.4
Maruti
Accumulate
8,216
8,658
248,201
81,825
101,245
15.0
15.0
283.5
356.0
29.0
23.1
6.3
5.2
21.9
22.4
2.7
2.1
Minda Industries
Neutral
910
-
7,867
4,328
5,084
11.0
11.9
27.3
36.4
33.4
25.0
7.1
5.5
23.1
25.6
1.9
1.6
Motherson Sumi
Neutral
365
-
76,786
55,937
64,445
10.8
11.4
16.9
21.1
21.6
17.3
4.8
4.9
25.2
25.4
1.4
1.2
Tata Motors
Neutral
447
-
129,036
303,167
343,649
11.8
13.8
33.1
54.7
13.5
8.2
2.2
1.8
16.9
23.0
0.5
0.4
TVS Motor
Neutral
695
-
33,014
13,992
16,216
9.0
9.4
17.1
20.3
40.8
34.2
10.8
8.4
29.7
27.7
2.3
1.9
Amara Raja Batteries
Buy
691
858
11,801
6,140
7,122
14.3
15.6
29.3
39.0
23.6
17.7
4.0
3.4
17.1
19.0
1.9
1.6
Exide Industries
Neutral
205
-
17,421
8,689
9,854
15.1
15.2
9.7
11.0
21.2
18.6
3.8
3.3
15.7
16.1
1.7
1.5
Apollo Tyres
Neutral
236
-
12,031
15,739
17,326
13.3
14.6
20.4
26.7
11.6
8.9
1.4
1.2
20.4
26.7
1.0
0.9
Ceat
Neutral
1,695
-
6,856
6,661
7,717
11.1
14.2
116.2
178.2
14.6
9.5
2.5
2.1
15.2
21.3
1.1
1.0
JK Tyres
Neutral
145
-
3,299
8,318
9,239
16.2
16.4
21.0
27.5
6.9
5.3
1.4
1.1
19.1
20.4
0.8
0.7
Swaraj Engines
Neutral
1,964
-
2,439
788
889
16.4
16.5
71.6
81.0
27.4
24.3
7.9
7.3
29.6
31.0
2.8
2.4
Subros
Neutral
252
-
1,513
1,855
2,135
11.6
11.8
10.3
14.7
24.6
17.2
3.7
3.2
15.8
19.1
1.0
0.9
Capital Goods
BEML
Neutral
1,740
-
7,246
4,286
5,194
7.1
8.2
42.9
58.1
40.6
30.0
3.3
3.0
7.6
8.7
1.8
1.4
Bharat Electronics
Neutral
183
-
44,963
10,258
12,470
19.6
19.5
7.3
8.6
25.1
21.3
0.5
0.4
20.4
21.9
3.9
3.2
Voltas
Neutral
548
-
18,129
6,778
8,004
9.6
11.0
17.1
22.4
32.0
24.5
7.6
6.7
17.7
19.8
2.4
2.0
BHEL
Neutral
100
-
36,732
33,200
39,167
6.8
9.5
6.2
11.2
16.1
8.9
0.7
0.7
4.6
8.0
0.7
0.5
Blue Star
Buy
692
867
6,626
5,220
6,207
6.3
6.6
16.8
22.3
41.2
31.1
8.2
7.2
19.9
23.3
1.2
1.0
CG Power and Industrial
Neutral
85
-
5,324
6,555
7,292
7.5
7.5
-
0.8
8,495.0
106.2
1.3
1.3
0.1
1.2
0.9
0.8
Solutions
Greaves Cotton
Neutral
128
-
3,123
1,778
1,993
14.7
15.1
8.1
9.1
15.8
14.1
3.5
3.3
21.8
23.6
1.5
1.4
Top Picks Report
November 06, 2017
Company Name
Reco
CMP
Target
Mkt Cap
Sales ( Čcr )
OPM(%)
EPS (Č)
PER(x)
P/BV(x)
RoE(%)
EV/Sales(x)
(Č)
Price ( Č)
( Č cr )
FY18E FY19E
FY18E
FY19E
FY18E
FY19E
FY18E
FY19E
FY18E
FY19E
FY18E
FY19E
FY18E
FY19E
Capital Goods
KEC International
Accumulate
314
350
8,071
9,779
11,113
9.4
9.8
14.2
18.2
22.1
17.3
4.2
3.5
21.1
22.1
1.1
1.0
KEI Industries
Accumulate
338
380
2,629
3,001
3,391
10.0
10.0
13.0
16.1
26.0
21.0
4.7
3.9
18.2
18.7
1.1
0.9
Thermax
Neutral
959
-
11,429
4,125
4,747
10.3
10.8
26.7
31.5
35.9
30.5
4.0
3.7
11.2
12.0
2.5
2.2
VATech Wabag
Buy
588
681
3,207
3,867
4,126
9.6
10.0
34.9
39.8
16.8
14.8
2.8
2.4
17.7
17.5
0.8
0.8
Cement
ACC
Neutral
1,804
-
33,870
12,255
13,350
13.5
14.3
58.0
66.2
31.1
27.3
3.7
3.4
11.5
12.2
2.7
2.5
Ambuja Cements
Neutral
282
-
56,045
10,250
11,450
17.5
19.0
7.2
8.3
39.2
34.0
2.8
2.7
7.0
7.8
5.2
4.6
India Cements
Neutral
187
-
5,750
6,135
6,750
14.8
15.2
8.5
11.5
22.0
16.2
1.1
1.0
4.8
6.2
1.3
1.1
JK Cement
Neutral
1,000
-
6,994
4,150
4,775
19.2
20.0
49.0
63.5
20.4
15.8
3.2
2.8
17.0
18.5
2.1
1.8
J K Lakshmi Cement
Neutral
439
-
5,163
3,422
3,757
15.5
17.0
13.5
23.2
32.5
18.9
3.4
2.9
10.8
15.5
1.9
1.7
Orient Cement
Neutral
176
-
3,600
2,215
3,233
16.8
17.0
5.9
6.9
29.8
25.5
2.3
2.1
10.8
10.1
2.6
1.7
UltraTech Cement
Neutral
4,369
-
119,938
28,250
35,150
20.2
23.5
77.5
122.2
56.4
35.8
4.8
4.3
9.6
14.8
4.7
3.8
Construction
KNR Constructions
Neutral
273
-
3,840
1,846
2,203
14.5
14.5
12.1
13.7
22.6
20.0
1.2
1.1
17.5
16.7
2.1
1.8
Larsen & Toubro
Neutral
1,235
-
172,967
95,787
109,476
10.2
11.6
44.5
50.8
27.8
24.3
3.5
3.2
12.9
13.1
2.4
2.1
Gujarat Pipavav Port
Neutral
137
-
6,611
739
842
61.6
62.7
5.1
6.2
26.8
22.2
3.3
3.3
12.7
14.9
8.4
7.3
PNC Infratech
Neutral
199
-
5,114
2,040
2,935
13.0
13.0
6.4
9.0
31.2
22.2
0.8
0.7
9.7
12.2
2.5
1.8
Simplex Infra
Neutral
524
-
2,591
6,012
6,619
11.6
11.7
21.1
31.0
24.9
16.9
1.7
1.6
6.5
8.6
1.0
0.9
Sadbhav Engineering
Neutral
308
-
5,287
3,823
4,426
10.7
10.8
10.3
11.8
29.9
26.1
3.6
3.1
10.1
10.5
1.7
1.5
NBCC
Neutral
263
-
23,652
9,099
12,706
6.4
6.4
7.3
9.6
36.1
27.5
1.6
1.3
27.5
30.5
2.5
1.8
MEP Infra
Neutral
106
-
1,723
2,403
2,910
18.3
16.8
2.4
6.1
45.1
17.5
17.1
11.5
35.2
55.8
1.9
1.5
SIPL
Neutral
128
-
4,516
2,060
2,390
46.8
47.7
(5.8)
(3.1)
4.8
5.5
(14.2)
(2.3)
7.0
6.5
Engineers India
Neutral
192
-
12,942
1,795
2,611
21.1
22.4
5.9
8.1
32.6
23.7
2.3
2.3
12.9
16.1
5.6
3.7
Financials
Axis Bank
Accumulate
540
580
129,470
32,558
35,843
3.5
3.2
27.8
41.0
19.4
13.2
2.1
1.8
11.4
14.9
-
-
Bank of Baroda
Neutral
172
-
39,574
22,533
26,079
2.4
2.4
12.0
20.9
14.3
8.2
0.9
0.9
6.6
11.0
-
-
Canara Bank
Neutral
404
-
24,128
17,925
20,235
2.0
2.1
18.5
36.5
21.8
11.1
0.8
0.8
3.4
6.2
-
-
Can Fin Homes
Buy
467
2,128
6,220
586
741
3.5
3.5
107.8
141.0
4.3
3.3
1.0
0.8
24.1
25.6
-
-
Cholamandalam Inv. &
Neutral
1,241
-
19,403
2,826
3,307
6.3
6.3
53.7
64.6
23.1
19.2
3.9
3.4
18.3
18.9
-
-
Fin. Co.
Dewan Housing Finance Accumulate
666
712
20,872
2,676
3,383
2.4
2.7
37.4
49.7
17.8
13.4
2.3
2.0
13.8
16.2
-
-
Equitas Holdings
Buy
147
235
4,963
1,125
1,380
9.6
9.8
1.5
6.0
97.7
24.4
2.2
2.1
2.4
8.2
-
-
Federal Bank
Accumulate
116
125
22,597
4,896
5,930
2.8
3.1
5.4
7.6
21.6
15.3
1.8
1.7
8.5
11.0
-
-
Top Picks Report
November 06, 2017
Company Name
Reco
CMP
Target
Mkt Cap
Sales ( Čcr )
OPM(%)
EPS (Č)
PER(x)
P/BV(x)
RoE(%)
EV/Sales(x)
(Č)
Price ( Č)
( Č cr )
FY18E FY19E
FY18E
FY19E
FY18E
FY19E
FY18E
FY19E
FY18E
FY19E
FY18E
FY19E
FY18E
FY19E
Financials
GIC Housing
Buy
481
655
2,588
376
477
3.6
3.7
33.0
40.0
14.6
12.0
2.6
2.2
20.0
23.0
-
-
HDFC Bank
Neutral
1,831
-
473,194
55,236
63,253
4.5
4.4
68.9
82.4
26.6
22.2
4.6
3.8
18.7
18.5
-
-
ICICI Bank
Neutral
316
-
202,654
42,361
51,378
3.6
3.9
18.4
25.7
17.2
12.3
1.9
1.8
11.3
15.0
-
-
Karur Vysya Bank
Buy
127
180
7,699
3,289
3,630
3.7
3.9
10.8
14.1
11.8
9.1
1.4
1.3
12.5
14.7
-
-
LIC Housing Finance
Neutral
609
-
30,721
4,895
6,332
3.4
3.7
50.7
66.8
12.0
9.1
2.4
2.0
21.7
23.8
-
-
Punjab Natl.Bank
Neutral
207
-
44,113
23,708
25,758
2.1
2.1
5.9
16.4
35.3
12.6
1.0
1.0
3.0
8.3
-
-
RBL Bank
Neutral
520
-
21,473
2,309
2,888
2.6
2.5
16.4
19.1
31.8
27.3
4.0
3.6
13.3
13.8
-
-
Repco Home Finance
Buy
613
825
3,838
496
597
4.4
4.2
38.5
48.7
16.0
12.6
2.9
2.4
19.6
20.6
-
-
South Ind.Bank
Neutral
32
-
5,711
3,195
3,567
3.0
3.1
3.0
3.8
10.5
8.3
1.0
0.9
10.5
11.9
-
-
St Bk of India
Neutral
325
-
280,542
105,827
121,056
2.4
2.5
16.1
25.6
20.2
12.7
1.6
1.4
6.6
9.9
-
-
Union Bank
Neutral
173
-
12,589
14,650
16,225
2.3
2.3
23.1
32.5
7.5
5.3
0.6
0.5
7.1
9.2
-
-
Yes Bank
Neutral
326
-
74,647
11,088
13,138
3.0
2.9
84.0
99.3
3.9
3.3
0.6
0.5
16.3
16.8
-
-
FMCG
Akzo Nobel India
Neutral
1,861
-
8,924
3,164
3,607
13.8
13.7
58.6
67.9
31.8
27.4
7.8
6.9
24.5
25.1
2.7
2.3
Asian Paints
Neutral
1,173
-
112,552
17,603
20,615
18.6
18.6
2,128.9
2,543.3
0.6
0.5
11.6
9.8
28.0
28.9
6.2
5.2
Britannia
Neutral
4,654
-
55,871
9,690
11,278
14.8
15.4
84.0
101.0
55.4
46.1
20.2
16.1
40.6
39.0
5.7
4.9
Colgate
Neutral
1,033
-
28,096
4,420
5,074
24.9
25.3
28.6
32.8
36.1
31.5
14.3
11.5
43.8
40.5
6.1
5.3
Dabur India
Neutral
340
-
59,892
8,346
9,344
19.6
19.9
7.8
9.0
43.6
37.8
8.8
7.9
25.2
24.8
6.8
6.0
GlaxoSmith Con*
Neutral
5,370
-
22,586
5,072
5,760
18.2
18.4
176.3
199.2
30.5
27.0
6.5
5.9
21.2
21.7
3.8
3.3
Godrej Consumer
Neutral
971
-
66,143
10,171
11,682
20.8
21.5
21.7
27.1
44.7
35.8
10.1
8.6
22.3
23.4
6.6
5.7
HUL
Neutral
1,238
-
267,984
37,077
41,508
20.3
21.8
5,189.9
6,318.5
0.2
0.2
37.8
32.2
74.8
82.0
7.1
6.3
ITC
Neutral
265
-
323,265
44,588
49,853
37.0
37.3
9.6
11.0
27.7
24.1
6.8
6.5
25.1
27.3
6.7
6.0
Marico
Neutral
313
-
40,353
6,788
7,766
18.5
19.2
7.1
8.5
44.0
36.8
15.4
13.2
36.9
38.0
5.8
5.0
Nestle*
Neutral
7,409
-
71,430
10,083
11,182
20.0
20.9
119.7
141.3
61.9
52.4
218.1
199.4
36.7
39.8
6.8
6.0
Tata Global
Neutral
225
-
14,219
7,121
7,641
11.9
12.3
6.9
8.0
32.7
28.2
2.2
2.1
6.8
7.2
1.8
1.7
Procter & Gamble
Neutral
8,820
-
28,631
3,034
3,579
27.1
27.7
167.7
198.8
52.6
44.4
14.1
12.2
28.8
29.5
8.9
7.4
Hygiene
IT
HCL Tech^
Buy
848
1,014
120,944
50,009
54,608
22.1
22.1
62.8
67.6
13.5
12.5
3.0
2.6
22.4
20.6
2.1
1.8
Infosys
Buy
927
1,120
212,851
70,333
75,960
26.0
26.0
61.7
65.9
15.0
14.1
2.8
2.6
18.9
18.7
2.4
2.2
TCS
Neutral
2,613
-
514,814
123,384
134,488
26.1
26.1
133.2
143.7
19.6
18.2
5.4
5.0
27.6
27.8
3.8
3.5
Tech Mahindra
Accumulate
464
533
45,228
31,015
33,496
15.0
15.0
35.6
38.1
13.0
12.2
2.2
2.1
17.0
16.3
1.2
1.1
Top Picks Report
November 06, 2017
Company Name
Reco
CMP
Target
Mkt Cap
Sales ( Čcr )
OPM(%)
EPS (Č)
PER(x)
P/BV(x)
RoE(%)
EV/Sales(x)
(Č)
Price ( Č)
( Č cr )
FY18E FY19E
FY18E
FY19E
FY18E
FY19E
FY18E
FY19E
FY18E
FY19E
FY18E
FY19E
FY18E
FY19E
IT
Wipro
Neutral
294
-
143,227
54,164
56,544
22.3
22.3
18.8
19.5
15.7
15.1
2.5
2.2
15.0
13.6
1.9
1.6
Media
D B Corp
Neutral
371
-
6,830
2,404
2,625
30.5
31.5
23.7
26.9
15.7
13.8
3.7
3.1
23.5
22.8
2.7
2.4
HT Media
Neutral
102
-
2,371
2,589
2,830
15.1
15.4
8.3
10.9
12.3
9.3
1.0
0.9
8.4
10.4
0.5
0.3
Jagran Prakashan
Buy
177
225
5,788
2,541
2,835
28.5
28.7
12.7
14.1
13.9
12.6
2.9
2.5
21.3
21.4
2.1
1.8
Sun TV Network
Neutral
881
-
34,733
3,238
3,789
51.9
55.1
30.9
38.0
28.5
23.2
8.1
7.1
30.0
31.0
10.2
8.6
Hindustan Media
Neutral
242
-
1,777
1,002
1,074
23.3
23.5
29.2
33.8
8.3
7.2
1.3
1.1
15.6
15.4
0.8
0.5
Ventures
TV Today Network
Accumulate
379
435
2,263
667
727
27.7
27.7
18.6
20.1
20.4
18.9
3.2
3.2
15.6
17.3
2.9
2.7
Music Broadcast Limited Accumulate
387
434
2,206
271
317
91.0
109.0
6.0
10.0
64.4
38.7
4.0
3.7
6.5
9.3
7.7
6.4
Metals & Mining
Coal India
Neutral
287
-
177,904
82,301
91,235
17.0
18.0
17.1
20.5
16.8
14.0
3.2
3.0
45.0
55.0
1.8
1.6
Hind. Zinc
Neutral
322
-
136,119
22,108
24,555
57.0
58.0
22.1
26.3
14.6
12.3
4.7
3.8
32.0
35.0
5.2
4.3
Hindalco
Neutral
269
-
60,241
102,350
105,355
13.5
14.5
21.5
24.5
12.5
11.0
1.7
1.5
15.0
15.2
1.2
1.1
JSW Steel
Neutral
267
-
64,516
64,500
68,245
21.1
21.5
20.1
21.2
13.3
12.6
2.4
2.1
-
-
1.7
1.7
NMDC
Neutral
128
-
40,466
10,209
11,450
47.0
48.0
11.1
12.1
11.5
10.6
1.6
1.5
-
-
3.5
3.1
SAIL
Neutral
87
-
35,829
54,100
63,555
3.0
10.0
(10.0)
1.5
57.8
1.2
1.1
-
-
1.7
1.4
Vedanta
Neutral
338
-
125,678
81,206
87,345
28.0
29.0
26.5
33.5
12.8
10.1
2.9
2.5
-
-
2.3
2.0
Tata Steel
Neutral
709
-
68,850
121,445
126,500
16.2
17.2
65.4
81.3
10.8
8.7
1.7
1.5
-
-
1.1
1.0
Oil & Gas
GAIL
Neutral
464
-
78,400
53,115
52,344
14.2
15.3
30.0
31.1
15.5
14.9
1.9
1.8
-
-
1.2
1.2
ONGC
Neutral
191
-
245,564
83,111
84,934
44.2
44.9
16.4
16.9
11.7
11.3
1.4
1.3
-
-
2.8
2.8
Indian Oil Corp
Neutral
413
-
200,670
396,116
432,560
8.5
8.8
40.1
42.2
10.3
9.8
1.8
1.6
-
-
0.7
0.6
Reliance Industries
Neutral
946
-
615,000
257,711
267,438
17.0
18.2
89.1
89.5
10.6
10.6
1.0
0.9
-
-
2.0
2.0
Pharmaceuticals
Alembic Pharma
Buy
505
600
9,524
3,903
4,584
18.2
19.2
21.8
27.2
23.2
18.6
4.2
3.5
19.8
20.6
2.5
2.1
Alkem Laboratories Ltd
Accumulate
1,926
2,079
23,028
6,320
7,341
17.5
19.8
72.7
96.6
26.5
19.9
4.7
4.0
16.7
18.7
3.6
3.0
Aurobindo Pharma
Neutral
788
-
46,162
17,086
19,478
22.1
22.0
44.7
51.4
17.6
15.3
3.9
3.2
24.7
22.7
2.8
2.5
Aventis*
Neutral
4,609
-
10,615
2,508
2,862
16.8
16.8
139.9
153.8
33.0
30.0
4.8
3.9
23.5
25.8
3.8
3.2
Cadila Healthcare
Reduce
496
426
50,819
11,584
13,228
20.3
20.4
18.7
21.3
26.6
23.3
5.9
4.9
24.6
22.9
4.2
3.6
Cipla
Sell
640
458
51,468
16,619
19,437
15.4
16.2
19.7
24.3
32.5
26.3
3.7
3.3
12.0
13.2
3.3
2.8
Dr Reddy's
Neutral
2,418
-
40,082
15,844
17,973
17.6
18.2
91.7
111.0
26.4
21.8
3.0
2.7
11.9
13.0
2.7
2.4
GSK Pharma*
Neutral
2,656
-
22,494
3,260
3,651
15.0
18.0
46.1
58.6
57.6
45.3
11.8
12.2
20.0
26.5
6.8
6.2
Indoco Remedies
Sell
277
153
2,554
1,154
1,310
14.9
14.9
11.3
12.7
24.5
21.8
3.5
3.1
15.0
15.0
2.3
2.0
Top Picks Report
November 06, 2017
Company Name
Reco
CMP
Target
Mkt Cap
Sales ( Čcr )
OPM(%)
EPS (Č)
PER(x)
P/BV(x)
RoE(%)
EV/Sales(x)
(Č)
Price ( Č)
( Č cr )
FY18E FY19E
FY18E
FY19E
FY18E
FY19E
FY18E
FY19E
FY18E
FY19E
FY18E
FY19E
FY18E
FY19E
Pharmaceuticals
Ipca labs
Neutral
525
-
6,623
3,593
4,022
14.5
15.5
19.4
25.2
27.1
20.8
2.5
2.2
9.5
11.2
1.9
1.7
Lupin
Buy
1,049
1,467
47,405
18,657
21,289
21.3
23.3
52.8
66.7
19.9
15.7
3.0
2.6
16.3
17.5
2.6
2.1
Natco Pharma
Accumulate
955
1,057
16,638
1,886
2,016
32.3
29.5
23.2
22.0
41.2
43.3
8.6
7.6
20.9
17.6
8.7
8.1
Sun Pharma
Neutral
552
-
132,486
32,899
36,451
26.9
25.4
31.6
32.3
17.5
17.1
3.1
2.7
18.7
18.8
3.7
3.1
Syngene International
Accumulate
505
557
10,108
1,402
1,823
32.8
36.0
15.9
20.7
31.8
24.5
5.9
4.9
18.7
20.0
7.2
5.5
Power
Tata Power
Neutral
85
-
22,855
32,547
33,806
20.5
20.5
4.7
5.4
18.0
15.8
1.7
1.5
10.5
10.5
1.7
1.6
NTPC
Neutral
182
-
150,191
86,070
101,246
28.3
30.7
12.9
16.2
14.1
11.2
1.5
1.3
10.6
12.4
3.1
2.8
Power Grid
Accumulate
211
223
110,177
29,183
32,946
89.7
90.0
18.0
20.8
11.7
10.1
2.0
1.7
17.7
18.2
7.7
7.2
Real Estate
Prestige Estate
Neutral
298
-
11,166
4,607
5,146
21.0
22.2
7.9
9.8
37.7
30.4
2.3
2.2
10.3
12.0
3.6
3.3
MLIFE
Buy
431
522
2,211
487
590
12.3
17.8
21.0
31.2
20.5
13.8
1.1
1.0
5.2
7.4
3.3
2.7
Telecom
Bharti Airtel
Neutral
541
-
216,399
97,903
105,233
36.0
36.3
9.3
11.1
58.2
49.0
2.8
2.7
5.0
5.6
3.2
2.9
Idea Cellular
Neutral
106
-
38,251
35,012
37,689
27.1
27.7
(4.4)
(2.7)
1.7
1.7
(6.8)
(4.6)
2.4
2.2
zOthers
Abbott India
Neutral
4,329
-
9,198
3,244
3,723
14.9
16.1
167.5
209.4
25.8
20.7
5.7
4.8
23.7
24.8
2.5
2.1
Asian Granito
Buy
495
570
1,488
1,169
1,286
12.5
12.5
16.0
19.7
31.0
25.1
3.3
2.9
10.7
11.6
1.5
1.3
Bajaj Electricals
Neutral
394
-
3,997
4,646
5,301
6.7
7.6
16.1
22.3
24.5
17.7
4.0
3.4
16.4
19.2
0.9
0.8
Banco Products (India)
Neutral
214
-
1,533
1,530
1,695
13.2
12.7
19.0
20.0
11.3
10.7
1.8
1.6
0.2
0.2
0.9
101.2
Coffee Day Enterprises
Neutral
223
-
4,600
3,494
3,913
17.4
18.0
4.8
5.7
-
39.2
2.0
1.9
-
0.1
1.8
1.6
Ltd
Elecon Engineering
Neutral
75
-
840
171
201
15.0
16.2
36.0
43.0
2.1
1.7
0.2
0.2
0.1
0.1
4.3
3.6
Garware Wall Ropes
Neutral
920
-
2,014
928
1,003
15.2
15.2
39.4
43.2
23.3
21.3
3.9
3.3
16.5
15.4
2.0
1.8
Goodyear India*
Neutral
814
-
1,878
1,717
1,866
11.8
12.3
47.9
49.8
17.0
16.4
2.6
2.3
15.6
15.7
0.8
112.9
Hitachi
Neutral
2,385
-
6,485
2,355
2,715
10.3
10.8
49.0
60.9
48.7
39.2
11.4
9.0
0.2
0.2
2.8
2.4
HSIL
Neutral
420
-
3,037
2,240
2,670
14.6
15.0
17.0
22.0
24.7
19.1
2.0
1.9
0.1
0.1
1.6
1.3
Interglobe Aviation
Neutral
1,254
-
45,344
22,570
27,955
14.2
15.0
63.6
81.8
19.7
15.3
10.4
8.8
0.5
0.6
1.7
1.3
Jyothy Laboratories
Neutral
383
-
6,956
1,781
2,044
14.1
15.0
9.4
10.5
41.0
36.5
8.7
8.2
0.2
0.2
4.1
3.5
Linc Pen & Plastics
Neutral
248
-
367
420
462
9.3
9.3
15.3
17.1
16.2
14.5
2.7
2.8
16.9
19.5
0.9
0.8
M M Forgings
Neutral
860
-
1,038
542
642
20.1
21.0
41.6
56.8
20.7
15.2
2.9
2.4
0.1
0.2
2.3
2.0
Mirza International
Neutral
162
-
1,948
1,148
1,285
18.0
18.0
8.0
9.4
20.1
17.3
3.3
2.8
16.3
16.1
1.9
1.6
Navkar Corporation
Buy
195
265
2,778
561
617
41.5
41.5
11.5
12.7
16.9
15.3
1.8
1.6
10.5
10.4
5.6
4.9
Nilkamal
Neutral
1,612
-
2,405
2,317
2,525
11.4
11.1
96.0
105.0
16.8
15.4
2.9
2.5
0.2
0.2
1.0
0.9
Top Picks Report
November 06, 2017
Company Name
Reco
CMP
Target Mkt Cap
Sales ( Čcr )
OPM(%)
EPS (Č)
PER(x)
P/BV(x)
RoE(%)
EV/Sales(x)
(Č)
Price ( Č)
( Č cr )
FY18E FY19E FY18E FY19E FY18E FY19E FY18E FY19E FY18E FY19E FY18E FY19E FY18E FY19E
zOthers
Parag Milk Foods
Neutral
278
-
2,339
1,987
2,379
7.6
9.0
12.4
18.3
22.4
15.2
3.2
2.8
8.2
13.2
1.3
1.1
Radico Khaitan
Neutral
212
-
2,819
1,811
1,992
13.2
13.2
8.1
8.8
26.1
24.1
2.6
2.9
10.1
12.0
1.9
1.7
Relaxo Footwears
Neutral
589
-
7,074
1,981
2,310
13.7
14.5
12.0
15.5
49.1
38.0
9.6
7.7
0.2
0.2
3.6
3.1
Siyaram Silk Mills
Accumulate
607
650
2,845
1,769
1,981
12.7
12.7
22.6
26.2
26.8
23.1
4.2
3.6
15.5
15.5
1.8
1.6
Styrolution ABS India* Neutral
948
-
1,667
1,800
1,980
8.0
8.1
42.0
46.2
22.6
20.5
2.5
2.3
0.1
0.1
1.0
1.0
Surya Roshni
Neutral
372
-
1,629
4,870
5,320
7.7
7.8
22.8
28.1
16.3
13.2
2.2
1.9
0.1
0.1
0.6
0.5
TVS Srichakra
Neutral
3,205
-
2,454
2,729
2,893
12.7
12.5
248.5
265.0
12.9
12.1
3.7
3.0
0.3
0.3
0.9
0.8
Visaka Industries
Neutral
687
-
1,092
1,104
1,214
12.1
12.6
31.0
37.9
22.2
18.2
2.7
2.4
0.1
0.1
1.2
1.1
VIP Industries
Accumulate
280
300
3,957
1,450
1,693
10.4
10.5
6.5
7.8
42.8
35.9
9.0
7.9
21.1
22.1
2.7
2.3
Navin Fluorine
Neutral
727
-
3,586
945
1,154
22.4
22.6
28.7
34.8
25.4
20.9
4.2
3.6
-
-
3.3
2.6
Source: Company, Angel Research; Note: *December year end; #September year end; &October year end; Price as on November 03, 2017
Top Picks Report | November 2017
Research Team Tel: 022 - 39357800
DISCLAIMER
Angel Broking Private Limited (hereinafter referred to as “Angel”) is a registered Member of National Stock Exchange of India Limited,
Bombay Stock Exchange Limited and Metropolitan Stock Exchange Limited. It is also registered as a Depository Participant with CDSL
and Portfolio Manager and investment advisor with SEBI. It also has registration with AMFI as a Mutual Fund Distributor. Angel Broking
Private Limited is a registered entity with SEBI for Research Analyst in terms of SEBI (Research Analyst) Regulations, 2014 vide
registration number INH000000164. Angel or its associates has not been debarred/ suspended by SEBI or any other regulatory
authority for accessing /dealing in securities Market. Angel or its associates/analyst has not received any compensation / managed or
co-managed public offering of securities of the company covered by Analyst during the past twelve months.
This document is solely for the personal information of the recipient, and must not be singularly used as the basis of any investment
decision. Nothing in this document should be construed as investment or financial advice. Each recipient of this document should
make such investigations as they deem necessary to arrive at an independent evaluation of an investment in the securities of the
companies referred to in this document (including the merits and risks involved), and should consult their own advisors to determine
the merits and risks of such an investment.
Reports based on technical and derivative analysis center on studying charts of a stock's price movement, outstanding positions and
trading volume, as opposed to focusing on a company's fundamentals and, as such, may not match with a report on a company's
fundamentals. Investors are advised to refer the Fundamental and Technical Research Reports available on our website to evaluate the
contrary view, if any.
The information in this document has been printed on the basis of publicly available information, internal data and other reliable
sources believed to be true, but we do not represent that it is accurate or complete and it should not be relied on as such, as this
document is for general guidance only. Angel Broking Pvt. Limited or any of its affiliates/ group companies shall not be in any way
responsible for any loss or damage that may arise to any person from any inadvertent error in the information contained in this report.
Angel Broking Pvt. Limited has not independently verified all the information contained within this document. Accordingly, we cannot
testify, nor make any representation or warranty, express or implied, to the accuracy, contents or data contained within this document.
While Angel Broking Pvt. Limited endeavors to update on a reasonable basis the information discussed in this material, there may be
regulatory, compliance, or other reasons that prevent us from doing so.
This document is being supplied to you solely for your information, and its contents, information or data may not be reproduced,
redistributed or passed on, directly or indirectly.
Neither Angel Broking Pvt. Limited, nor its directors, employees or affiliates shall be liable for any loss or damage that may arise from
or in connection with the use of this information.
Ratings (Based on expected returns
Buy (> 15%)
Accumulate (5% to 15%)
Neutral (-5 to 5%)
over 12 months investment period):
Reduce (-5% to -15%)
Sell (< -15)