Angel Top Picks - May 2016
Angel Top Picks - May 2016
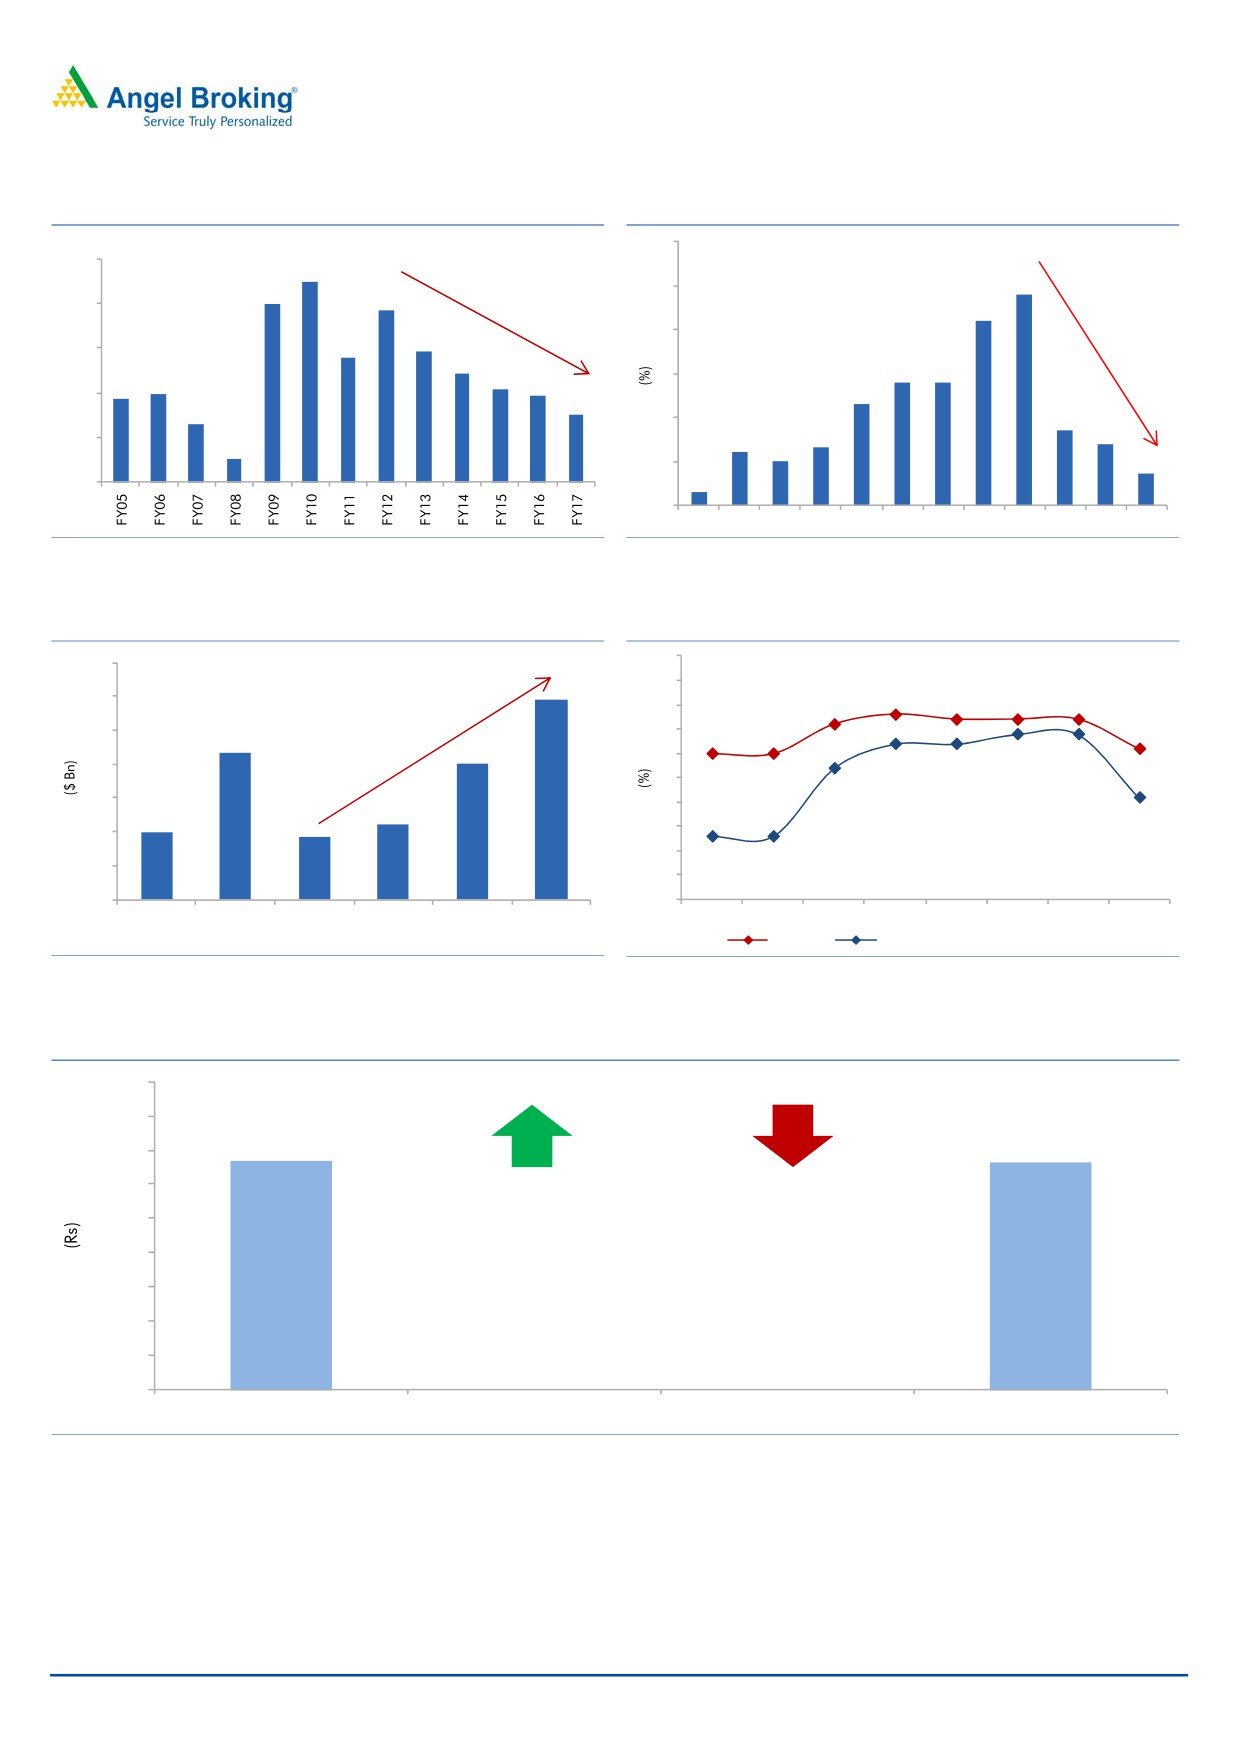
India’s macroeconomic environment has shown gradual improvement over the
past two years and there are a whole host of indicators suggesting a favorable
India’s macroeconomic environment is
outlook for the Indian economy. The interest rates have declined with the central
strong, however, Sensex earning has
bank getting the leeway to do so on the back of slowing consumer inflation and
been flattish so far
declining fiscal deficit. The current account deficit has narrowed, forex reserves
have been at their highest levels and FDI inflows have picked up. However,
despite these improvements over the past two years, Nifty and Sensex earnings
have been anemic.
The earnings of high growth companies in spaces like IT, FMCG, pharma etc,
which account for ~73% of the Sensex have grown by 26% over FY2014-16E.
However, this is not reflected in the overall Sensex earnings as they have been
overshadowed by the balance 27% of the index composed of commodity and
But, there are many pockets of growth
power stocks that have witnessed a de-growth in earnings by 39% yoy over the
in the broader market
same period.
In our view, there are pockets in the market where growth trends are picking up.
We believe there are stock picking opportunities in the space outside of
Sensex/Nifty and also in many of the newer listings in the upcoming sectors of the
economy.
Our top picks comprise of companies that will benefit from strong consumption
We believe there are ample
and from the government’s thrust on infrastructure. Our top consumption based
opportunities arising from strong
plays are Blue Star, Siyaram Silk Mills and Radico Khaitan. Our picks that will
consumption demand and government
benefit from interest rate cuts and higher government focus include LIC Housing
spending
Finance, Dewan Housing Finance, Mahindra Lifespace, NBCC and IL&FS
Transportation Networks.
Large Cap Picks
Mid Cap Picks
Company
Sector
Rating
Target (`) Upside (%)
Company
Sector
Rating Target (`) Upside (%)
Amara Raja
Auto Ancill.
Buy
1,076
15.6
Blue Star
Cons. Durable
Buy
481
16.2
Dewan Housing
Financials
Buy
270
34.2
BEL
Capital Goods
Buy
1,414
23.3
IL&FS Transport.
Infra
Buy
93
25.3
HCL Tech
IT
Buy
1,038
41.5
Jagran Prakashan
Media
Buy
205
23.5
HDFC Bank
Financials
Accumulate
1,262
11.4
Mahindra Lifespace Real Estate
Buy
554
30.1
Infosys
IT
Buy
1,374
15.2
Navkar Corp.
Logistics
Buy
265
52.3
LIC Housing Fin. Financials
Buy
592
31.5
Radico Khaitan
Breweries & Dist.
Buy
156
75.3
NBCC
Construction
Accumulate
1,089
11.3
Siyaram Silk Mills
Textile
Buy
1,354
25.4
Source: Company, Angel Research
Source: Company, Angel Research
Cross section of recent growth trends in various pockets of the economy
Sector
Description
Data/ Growth
Period
Source
After a few disappointing quarters, FY2017 has gotten off to a fast
Automobile
13-18%
Apr-16
Auto Companies
start led by strong volume growth in 2W/ PV/ CV/Tractors
Real Estate
Top 8 cities: Sales with < 25 lakhs ticket size witnessed growth
46%
4QFY2016 Liases Foras
Huge NHAI tendering pipeline (from `66,335cr at FY2015-end to
Infrastructure
38%
FY2016
NHAI
`91,500cr at FY2016-end)
Channel checks and industry sources suggest strong AC sales
AC sales
~50%
Apr-16
Industry Sources
in April
Domestic passenger traffic has grown at 22.1% in FY2016 (growth
Directorate General of
Aviation
23%
2HFY2016
of 23.3% yoy in 2HFY2016).
Civil Aviation
Source: Company, Angel Research
Update on 20 more sectors on page No.2
Please refer to important disclosures at the end of this report
1
Top Picks Report | May 2016
Exhibit 1: Cross section of recent growth trends in various pockets of the economy
Sector
Description
Data/ Growth
Period
Source
Auto sales have gotten off to a fast start in FY2017 after
Automobile
consecutive quarters of disappointing numbers. 2W segment
18%
Apr-16
Auto companies
has reported ~18% yoy growth in April
Passenger Vehicles too have reported good growth of 13%
13%
Apr-16
Auto companies
CV sales have improved which is indicative of improvement
17%
Apr-16
Auto companies
in commercial activities
Tractor sales have grown by ~17% in April partially due to
lower base and also led by expectation of favorable
17%
Apr-16
Auto companies
monsoon
Premium Bikes
Royal Enfield sales have grown by ~42% for April 2016
42%
Apr-16
Auto companies
AC sales have picked up since the month of March and as
per industry sources, most AC players have witnessed ~50%
AC sales
jump in the month of April. Major players like Daikin,
~50%
Apr-16
Industry Sources
Panasonic, Blue Star expect Industry to grow at 18-20% for
FY2017E
The net Inflows in Equity Mutual Funds over FY2002-2014
Equity Mutual
were `1,14,000cr. The Total Inflows for FY2015 and
1.6x
FY16
AMFI
Funds
FY2016 alone were `1,45,000cr. FY16 inflows 1.6x of peak
of last bull rally (FY08)
Real Estate
Sales across Top 8 cities witnessed growth
6%
4QFY2016
Liases Foras
Sales across Top 8 cities have grown in the < 25 lakhs ticket
46%
4QFY2016
Liases Foras
size
MoRTH has increased awarding target (from 10,000kms in
Roads & High.
150%
FY2016
Pib.nic.in
FY2016 to 25,000kms in FY2017E)
NHAI tendering pipeline increases from `66,335cr in Mar-
38%
Mar-16
NHAI
2015 to `91,500cr in Mar-2016
New Initiative: Bharatmala Project to lead to strong
17,200kms
FY2016
Pib.nic.in
awarding
Defence projects (Capital) spending increased from
Defence
62%
FY2016
Pib.nic.in
`39,955cr in FY2015 to `64,860cr in FY2016
Urban Infra
New Initiative: 100 Smart Cities to create huge opportunities
~`6 lakh cr
4QFY2016
Pib.nic.in
New Initiative: Build 2cr Urban Houses, under the 'Housing
~`11 lakh cr
4QFY2016
Pib.nic.in
for All'
Oil
Fuel consumption has increased to 9% on yoy basis in
Ministry of Petroleum
9%
FY2016
consumption
FY2016 which is highest growth rate since FY2010
& Natural Gas
Combined retail loans of the top five pvt banks and four
Retail loan
housing finance companies reported a healthy growth of
22%
4QFY2016
Company
growth
22% to `9.9 lac cr vs `8.1 lac cr in Q4FY16 indicating pick
up in consumption demand.
Delhi government is expected to collect 30% higher revenue
Liquor
30%
FY2016E
Delhi government
due to increase in liquor sales (90% from premium brands)
Indian craft beer market has grown at 1000% CAGR over
Media Reports
FY2009-15 and is expected to post exponential growth rates
Huge awarding potential (target for FY2022; Current
Solar Energy
1,00,000MW
4QFY2016
Pib.nic.in
Capacity- 5,755MW)
The organised dairy industry in India is estimated to have
Dairy
grown ~20% in FY2015 and as per industry reports will
20%
FY2015
IMARC
maintain the growth over next 5 years
Domestic passenger traffic has grown at 22.1% in FY2016
Directorate General of
Aviation
23%
2HFY2016
(growth of 23.3% yoy in 2HFY2016).
Civil Aviation
Foreign tourist arrivals during 4QFY2016 grew by 10% to
2.5mn which has improved hotel occupancy rates (7-8%).
Hotels
7-8%
4QFY2016
HVS
Further, occupancy rates are expected to improve by 4-5%
over the next year.
In terms of travelers’ bookings - there has been 185%
Niche Travel
increase in out-bound bookings and 184% increase in-
185%
FY2016
Airbnb management
bound bookings for Airbnb over FY2015
Apple India I-phone sales revenue had registered 56%
Premium
growth in 4QFY2016. Yet it managed to concede market
56%
4QFY16
Apple CEO- Tim Cook
Mobiles
share to Samsung indicating strong sales growth in Indian
Smartphone Industry.
Source: Company, Angel Research
May 5, 2016
2
Top Picks Report | May 2016
Exhibit 2: Fiscal Deficit (% of GDP)
Exhibit 3: Current Account Deficit (% of GDP)
Fiscal Deficit (% of GDP)
6
CAD (% of GDP)
7.0
6.5
4.8
6.0
5
5.8
6.0
4.2
4
4.8
4.9
5.0
4.4
2.8
2.8
4.1
3
3.9
4.0
3.9
2.3
4.0
3.5
3.3
2
1.7
1.3
1.4
3.0
1.2
2.5
1.0
1
0.7
0.3
2.0
0
FY05 FY06 FY07 FY08 FY09 FY10 FY11 FY12 FY13 FY14 FY15 FY16E
Source: Company, Angel Research
Source: Company, Angel Research
Exhibit 4: Strong Increase in FDI Inflows
Exhibit 5: Declining interest rate
10
60
Strong increase in FDI Flows
10
55
8.8
8.7
8.7
8.7
9
8.6
54
50
9
8.0
8.0
8.1
8
8.4
8.4
45
8.2
8.2
47
8
45
7.7
40
7
7.1
35
7
36
35
34
6
6.3
6.3
30
6
25
5
FY11
FY12
FY13
FY14
FY15
FY16
FY10
FY11
FY12
FY13
FY14
FY15
FY16
Curr.
9M Ann.
PPF
Post Office Time Deposit Accoun - 1year
Source: Company, Angel Research
Source: Company, Angel Research
Exhibit 6: What Impacted Earnings Growth?
1,800
1,552
1,600
1,400
1,200
1,329
1,000
73% weightage cos in
27% weightage cos in
800
FMCG, Pharma, Auto,
Oil&Gas, Metals, Power
1,338
Pvt Banks, etc
and PSU space
1,329
600
grew 26%
degrew 39%
400
200
-
FY2014
FY2016E
Source: Company, Angel Research
May 5, 2016
3
Top Picks Report | May 2016
Large Cap
EPS
PER
EV/Sales
ROE
Company
Sector
Rating
CMP (`) Target (`)
Upside (%) FY16E FY17E FY16E FY17E FY16E FY17E FY16E FY17E
Amara Raja
Auto Ancill.
Buy
931
1,076
15.6
28.8
37.1
32.3
25.1
3.2
2.6
23.4
24.1
BEL
Capital Goods
Buy
1,147
1,414
23.3
54.0
61.5
21.2
18.6
3.0
2.7
39.3
45.6
HCL Tech
IT
Buy
734
1,038
41.5
51.1
57.7
14.2
12.7
2.1
1.6
21.5
18.8
HDFC Bank Financials
Accumulate
1,133
1,262
11.4
48.8
61.4
23.2
18.5
-
-
18.7
20.0
Infosys
IT
Buy
1,192
1,374
15.2
59.0
65.3
20.2
18.3
3.8
3.3
22.2
22.4
LIC Housing Fin.Financials
Buy
450
592
31.5
32.9
40.6
13.7
11.1
-
-
19.6
20.7
NBCC
Construction
Accumulate
979
1,089
11.3
29.6
39.8
33.1
24.6
1.8
1.3
24.1
26.7
Source: Angel Research
Mid Cap
EPS
PER
EV/Sales
ROE
Company
Sector
Rating
CMP (`) Target (`) Upside (%) FY16E FY17E FY16E FY17E FY16E FY17E FY16E FY17E
Blue Star
Cons. Durable
Buy
414
481
16.2
13.7
17.2
30.2
24.1
1.1
1.0
26.1
25.4
Dewan Housing Financials
Buy
201
270
34.2
24.9
29.7
8.1
6.8
-
-
15.0
16.1
IL&FS Transport. Infra
Buy
74
93
25.3
7.0
9.0
10.6
8.2
3.7
3.6
3.2
3.7
Jagran Prakashan Media
Buy
166
205
23.5
8.9
9.9
18.6
16.8
2.4
2.2
20.9
20.4
Mahindra LifespaceReal Estate
Buy
426
554
30.1
22.6
30.7
18.8
13.9
4.0
2.7
6.0
7.4
Navkar Corp.
Logistics
Buy
174
265
52.3
5.6
5.9
30.9
29.7
7.6
6.6
6.3
6.1
Radico Khaitan
Breweries & Dist. Buy
89
156
75.3
5.8
7.1
15.3
12.6
1.3
1.2
8.6
9.6
Siyaram Silk Mills Textile
Buy
1,080
1,354
25.4
89.9
104.1
12.0
10.4
0.8
0.7
17.9
17.8
Source: Angel Research
May 5, 2016
4
Top Picks Report | May 2016
Top Picks - Large Cap
May 5, 2016
5
Top Picks Report | May 2016
Stock Info
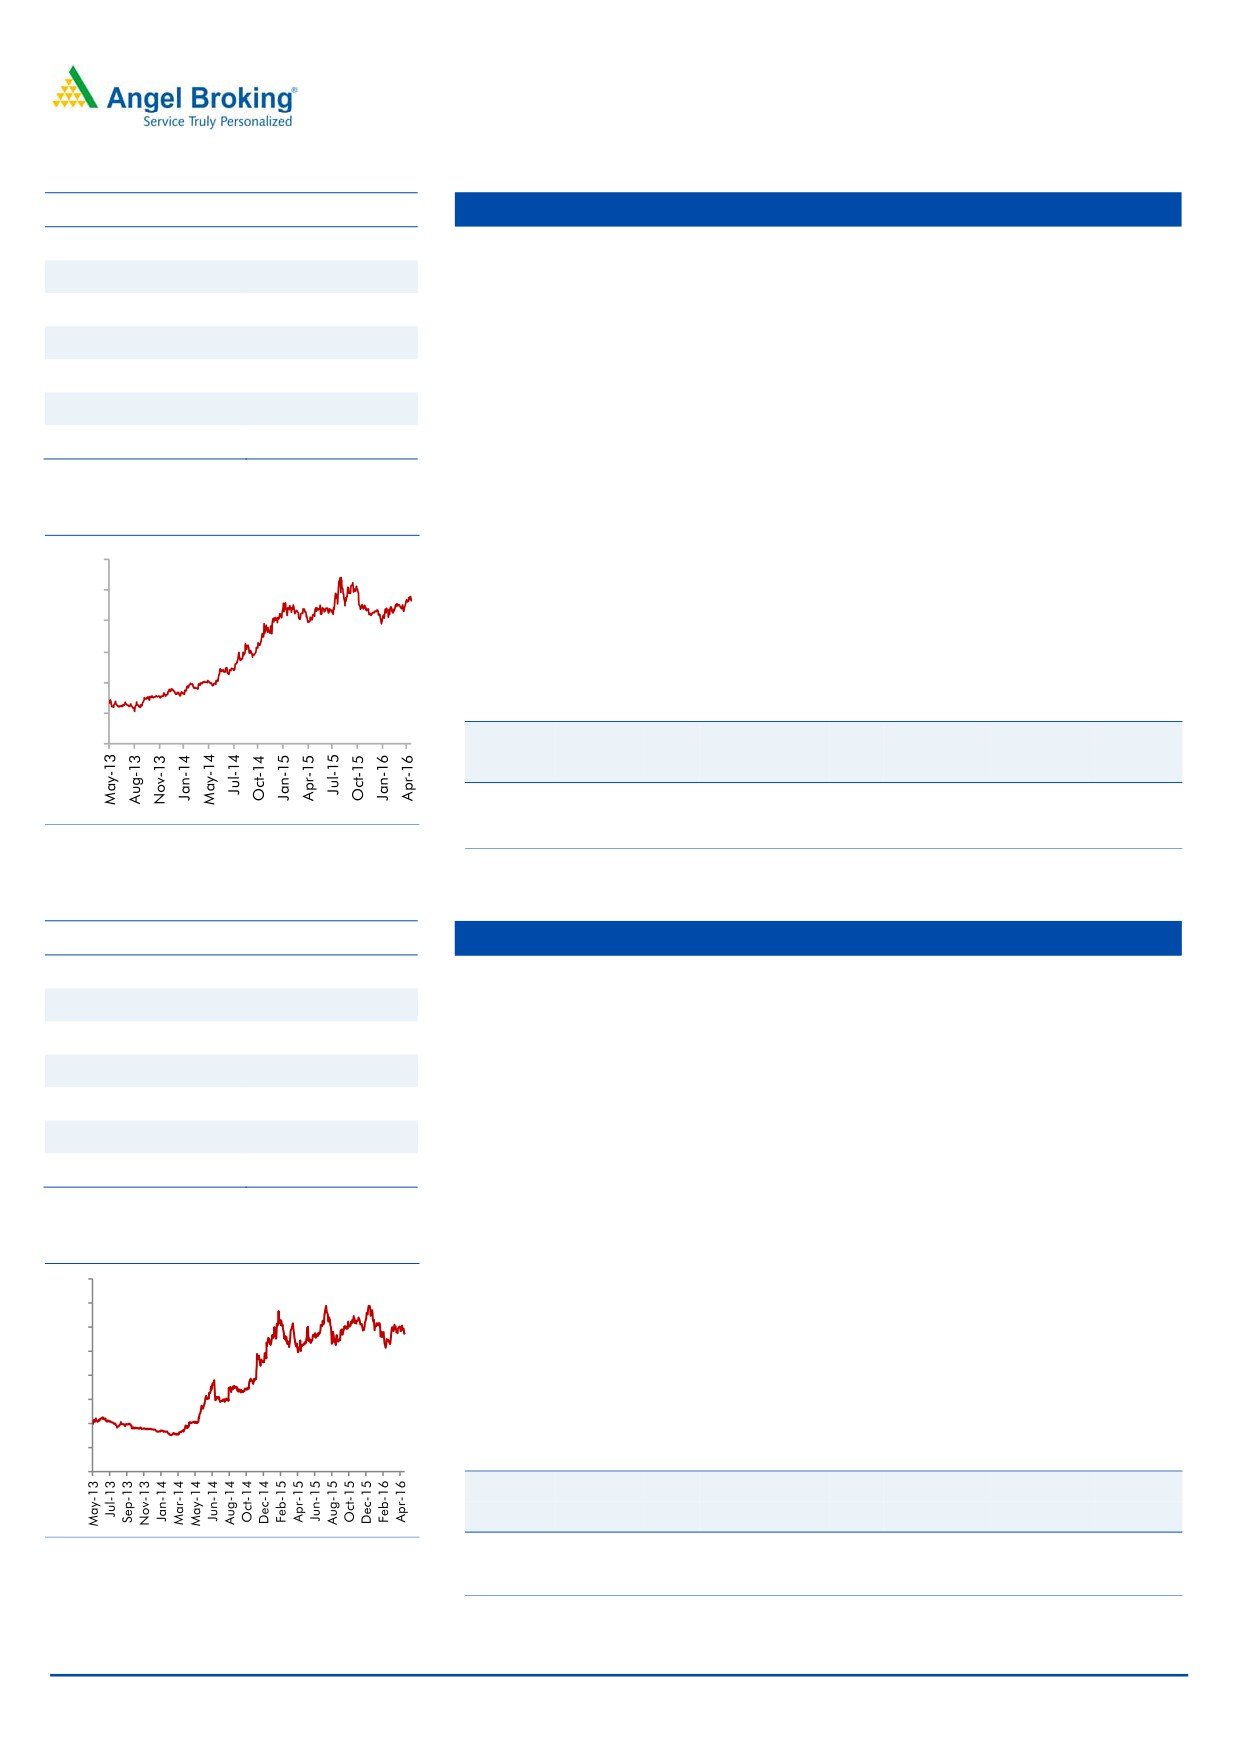
Amara Raja Batteries
CMP
931
Amara Raja Batteries Ltd (ARBL) is the second largest lead acid storage battery
TP
1,076
manufacturer. ARBL has been outpacing market leader Exide (ARBL grew at a
24% CAGR over FY2010-15 as compared to Exide's growth of 13%), leading
Upside
15.6%
to its market share improving from 25% in FY10 to about 35% currently.
Sector
Auto Ancillary
ARBL's outperformance has been mainly on back of its association with global
Market Cap (` cr)
15,905
battery leader Johnson Controls Inc (which also holds 26% stake in ARBL) for
manufacturing ducts.
Beta
0.8
With the automotive OEMs following a policy of having multiple vendors and
52 Week High / Low
1,132 / 773
with ARBL’s products enjoying a strong brand recall in the replacement
segment, the company is well poised to gain further market share. Given the
economic recovery and market share gains, the company is expected to grow at
3 year-Chart
a CAGR of 18% over the next two years as against industry growth of 10-12%.
1,200
ARBL is a well diversified auto ancillary player having presence across the
1,000
automotive and the industrial segment and a broad OEM as well as
800
replacement customer base. We believe ARBL is a high quality stock to play
the auto sector revival. We assign a P/E multiple of 28x to its FY2017E
600
earnings and arrive at a target price of `1,040/share.
400
200
Key Financials
0
Y/E
Sales
OPM PAT EPS ROE P/E P/BV EV/EBITDA EV/Sales
March
(` cr)
(%)
(` cr)
(`)
(%)
(x)
(x)
(x)
(x)
FY2016E
4,892
17.4
493
28.8
23.4
32.3
7.5
18.4
3.2
FY2017E
5,871
17.6
634
37.1
24.1
25.1
6.0
14.8
2.6
Source: Company, Angel Research
Source: Company, Angel Research
Stock Info
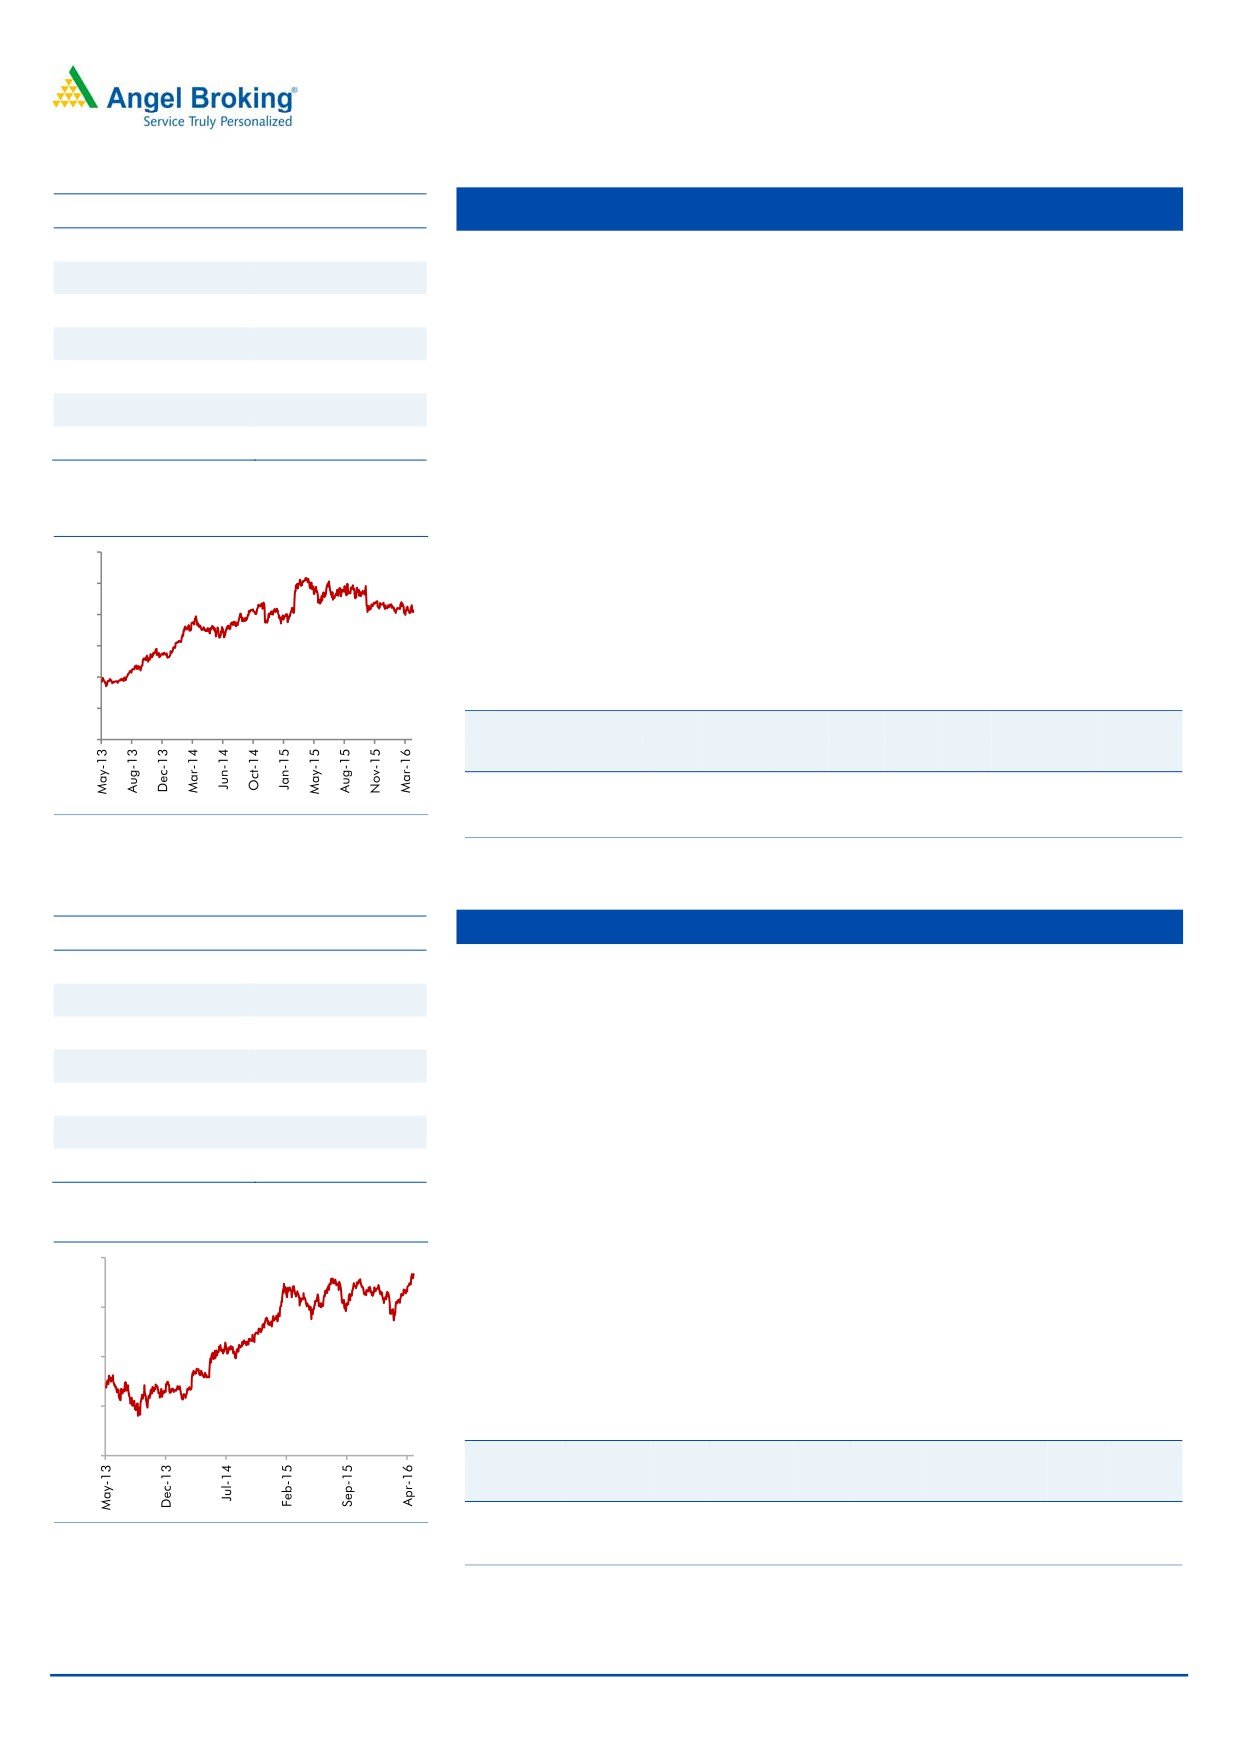
Bharat Electronics (BEL)
CMP
1,147
(1) High priority to the defense sector in the government’s ‘Make in India’
TP
1,414
campaign, with (1) emphasis on indigenization, (2) increase in FDI limits from
26% to 49%, and (3) Over $50bn worth of projects cleared by Defense
Upside
23.3%
Acquisition Council (DAC) in the last 23 months, indicate at the sector being at
Sector
Capital Goods
an inflexion point where Indian defense capex cycle is entering a new era of
Market Cap (` cr)
27,516
growth. The current bid pipeline could lead to strong award activity for the
next few years and BEL could emerge as a beneficiary.
Beta
1.2
BEL in FY2015 had 37% market share in the defense electronics space.
52 Week High / Low
1,417 / 983
Considering (1) bid-pipeline of Indian Air Force and Navy’s platform projects,
which have high defense electronic component, (2) BEL’s in-house R&D
capabilities, and (3) its zero debt status, we believe that BEL would maintain its
3 year-Chart
strong market positioning in the defense electronics space.
1600
We expect BEL to trade at a premium to its historical valuations on account of
1400
uptick in investment cycle. Current low competitive intensity which should
1200
1000
enable BEL to justifiably command scarcity premium, coupled with the fact that
800
the company is the largest listed defense player, makes the stock more
600
attractive. We assign a 1-year forward P/E multiple of 23.0x to arrive at a
400
price target of `1,414. Given the upside, we recommend BUY.
200
Key Financials
0
Y/E
Sales
OPM PAT EPS ROE P/E P/BV EV/EBITDA EV/Sales
March
(` cr)
(%)
(` cr)
(`)
(%)
(x)
(x)
(x)
(x)
FY2016E
7,737
16.8
1,296
54.0
39.3
21.2
3.0
15.9
2.7
Source: Company, Angel Research
FY2017E
8,634
17.2
1,475
61.5
45.6
18.6
2.7
13.2
2.3
Source: Company, Angel Research
May 5, 2016
6
Top Picks Report | May 2016
Stock Info
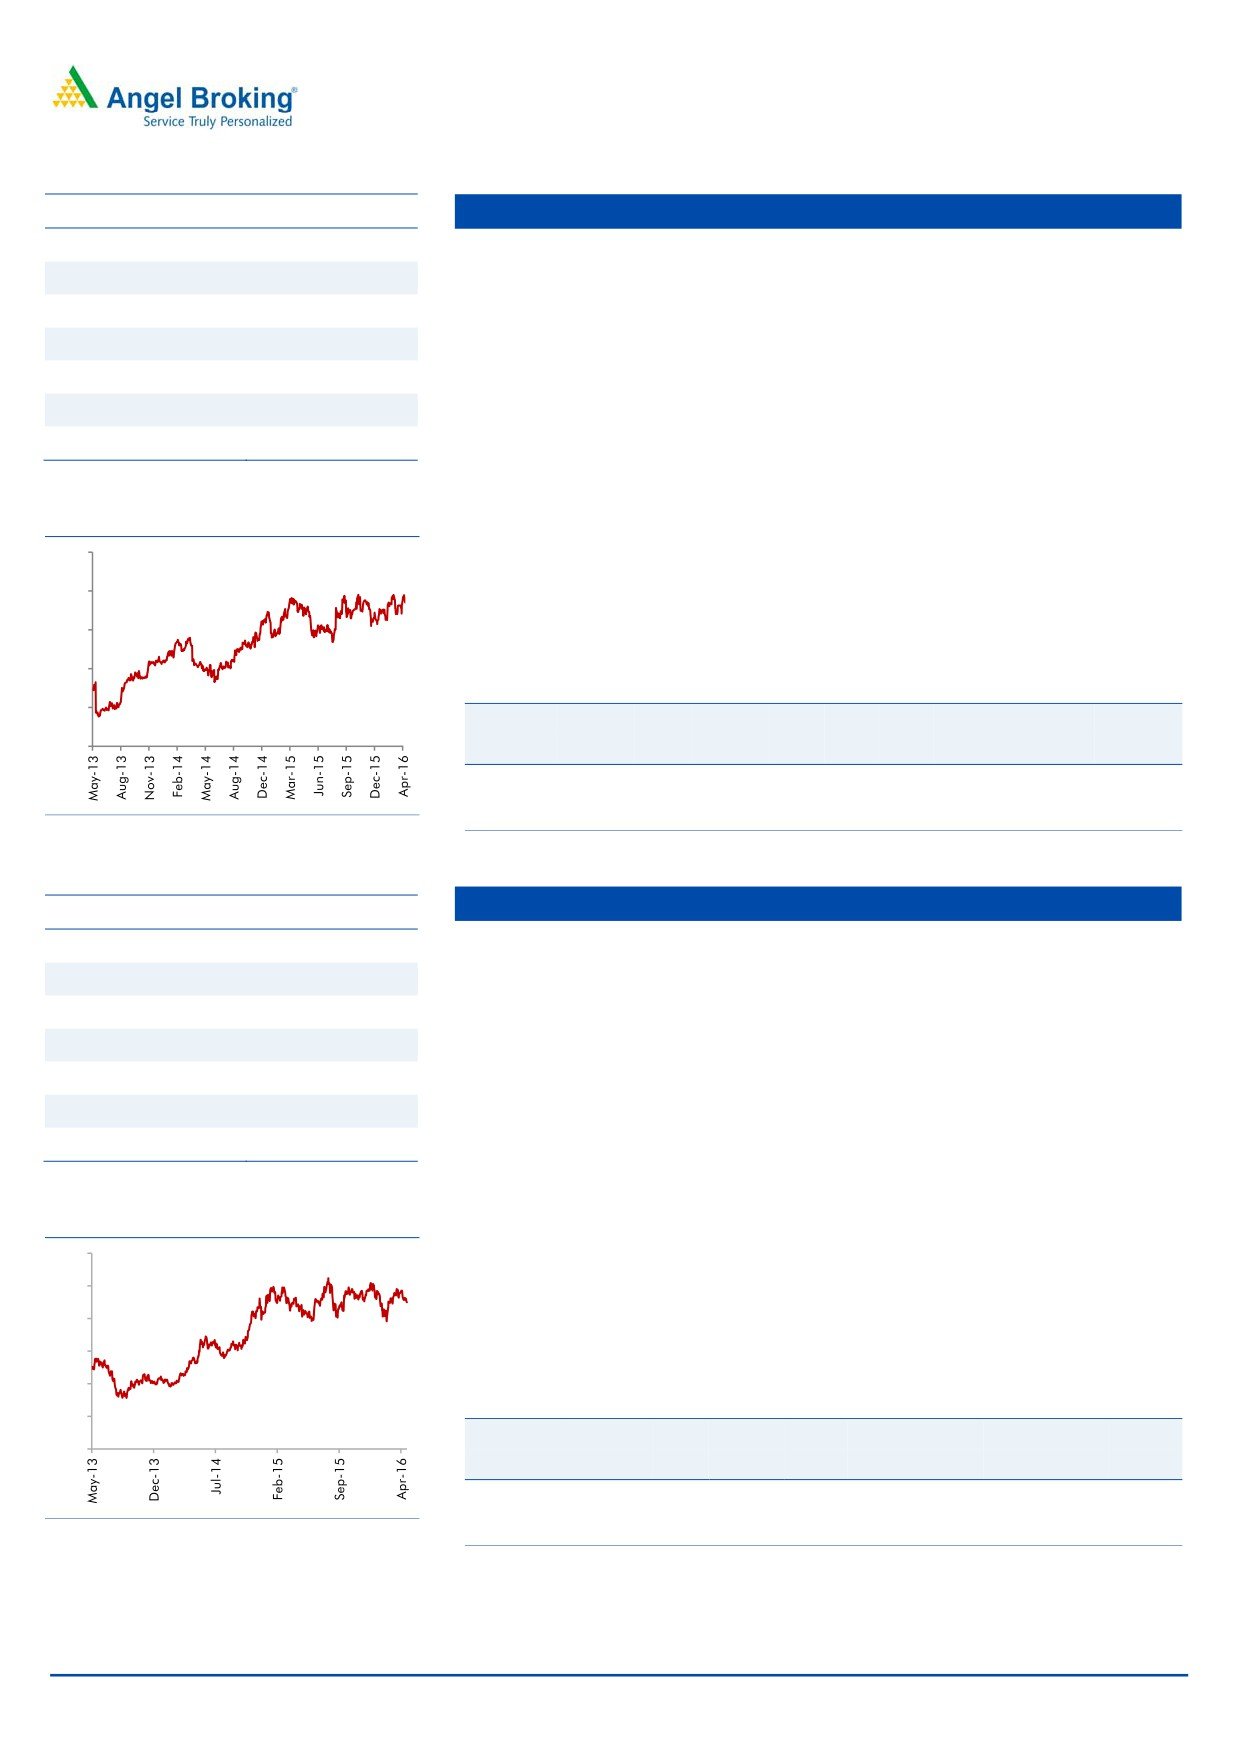
HCL Technologies
CMP
734
Healthy pipeline: During 3QFY2016, the company has signed orders in excess
TP
1038
of US$2bn. This excludes the inorganic portion of the Volvo deal. Over
Upside
41.5%
9MFY16, it has announced signing 25 transformational deals with more than
US$4bn of TCV. Also, during the last quarter, the company acquired
Sector
IT
Geometric Software’s business, which though small in terms of its contribution
Market Cap (` cr)
1,03,464
to sales, would still be positive and add to the company’s capability in
Beta
0.8
engineering services. This comes after its announced acquisition of Volvo’s
52 Week High / Low
1,048 / 726
external IT business, which registered revenue of ~US$190mn.
Robust outlook: We expect HCL Tech to post a USD and INR revenue CAGR of
8.8% and 8.9%, respectively, over FY2015-17E. On the operating front, HCL
3 year-Chart
Tech's EBIT margin has been around 20.2% in FY2016. Going ahead, the
1200
Management expects EBIT margins to sustain at 21-22% levels. We expect the
1000
EBIT and PAT to post a 4.3% and 3.9% CAGR, respectively, over FY2015-17E.
800
Outlook and Valuations: At current valuations, the stock is attractively valued
600
and hence we maintain our Buy with a price target of `1,038.
400
Key Financials
200
Y/E
Sales
OPM PAT EPS ROE P/E P/BV EV/EBITDA EV/Sales
0
June
(` cr)
(%)
(` cr)
(`)
(%)
(x)
(x)
(x)
(x)
FY2016E
30,781
21.5
5,643
40.0
20.4
18.3
3.7
14.3
3.1
FY2017E
44,031
21.5
7,823
55.5
21.1
13.2
2.8
8.6
1.9
Source: Company, Angel Research
Source: Company, Angel Research
HDFC Bank
Stock Info
CMP
1,133
Strong capital adequacy, will enable continued growth going ahead HDFC
TP
1,262
Bank continued to report strong loan growth of 27% yoy and with capital
Upside
11.4%
adequacy ratio of 15.5% at the end of 4QFY2016, the bank has enough
Sector
Financials
scope to continue to grow its loan book and increase its market share.
Market Cap (` cr)
2,86,550
Asset quality rock-solid: The bank has been able to maintain its asset quality
consistently. Asset quality continued to remain healthy with the Gross NPA
Beta
0.80
ratio and the Net NPA ratio at 0.94% and 0.28%, respectively, as of
52 Week High / Low
1,138 / 928
4QFY2016, in a challenging macro environment.
Outlook: Credit and deposit growth beat the industry growth rate, driven by
3 year-Chart
strong retail business, healthy CASA and continued network expansion. This
1,200
provides strong visibility for a robust 20% earnings trajectory, coupled with
high quality of earnings. This in our view justifies a premium valuation
1,000
multiple. At the current market price, the bank is trading at 3.4x its FY2017E
800
ABV. We recommend an Accumulate rating on the stock, with a target price of
`1,262.
600
Key Financials
400
Y/E
Op. Inc NIM
PAT
EPS
ABV ROA ROE P/E P/ABV
March
(` cr)
(%)
(` cr)
(`)
(`)
(%)
(%)
(x)
(x)
FY2016
38,343
4.3
12,296
48.8
287.4
1.9
23.2
23.2
3.9
Source: Company, Angel Research
FY2017E
47,696
4.5
15,514
61.4
330.3
2.0
18.5
18.5
3.4
Source: Company, Angel Research
May 5, 2016
7
Top Picks Report | May 2016
Stock Info
Infosys
CMP
1,192
Strong revenue guidance for FY2017: The Management has guided towards
TP
1,374
higher revenue growth for FY2017, ie of 11.5-13.5% in CC terms and 12.7-
Upside
15.2%
14.7% in INR terms (exchange rate as on March 31, 2016). For FY2016, the
Sector
IT
company posted a 13.3% growth in CC terms V/s a guidance of 12.8-13.2%
growth (in CC). We expect the company to post ~13.0% USD revenue growth
Market Cap (` cr)
2,73,899
in FY2017.
Beta
0.8
Aims to be US$20bn company by FY2020: Company expects its revenue to
52 Week High / Low
1,268 / 933
rise to US$20bn by FY2020, up from US$8.7bn in FY2015, as it focuses on
acquisitions and winning more new technology services, implying a
14%
CAGR over the period. Over the near term, we expect Infosys to post a 12.7%
3 year-Chart
USD revenue growth in FY2016. Over FY2015-17E, we expect USD and INR
1400
revenue to grow at a CAGR of 12.9% and 14.5%, respectively.
1200
Outlook and Valuations: The stock trades at a valuation of 18.3x FY2017E
1000
earnings. We recommend buy on the stock with a price target of `1,374.
800
Key Financials
600
Y/E
Sales
OPM PAT EPS ROE P/E P/BV EV/EBITDA EV/Sales
400
March
(` cr)
(%)
(` cr)
(`)
(%)
(x)
(x)
(x)
(x)
FY2016E
62,441
27.5
13,491
59.0
21.8
20.2
4.4
14.1
3.9
FY2017E
70,558
27.5
14,999
65.3
22.2
18.3
4.1
12.1
3.3
Source: Company, Angel Research
Source: Company, Angel Research
LIC Housing Finance
Stock Info
CMP
450
Significant under penetration of mortgages in India: India is expected to
TP
592
witness a robust housing finance growth going forward as the mortgage
penetration in India remains at very low levels at 9% to GDP as compared to
Upside
31.5%
the developed countries where it is in the range of 60-100%.
Sector
Financials
NIM expansion visible: LIC Housing Finance is able to raise funds from low-
Market Cap (` cr)
22,712
cost NCDs due to its strong AAA credit rating and backing by strong
Beta
1.40
promoters like LIC. In a declining interest rate environment, NBFC's like LIC
52 Week High / Low
526 / 389
Housing are well-placed to witness margin improvement in our view.
Outlook: For companies like LICHF, the funding environment has eased; thus
3 year-Chart
it will lead to lower cost of borrowing, while outlook for growth in retail
600
housing loans remains positive, going forward. We expect the company to
post a healthy loan book CAGR of 19% over FY2016-18E, which is likely to
500
reflect in an earnings CAGR of 21.0%, over the same period. The stock
400
currently trades at 2.1x FY2017E ABV. We maintain our Buy rating on the stock,
300
with a target price of `592.
200
Key Financials
100
Y/E
Op. Inc NIM
PAT
EPS
ABV ROA ROE P/E P/ABV
0
March
(` cr)
(%)
(` cr)
(`)
(`)
(%)
(%)
(x)
(x)
FY2016
3,179
2.6
1,661
32.9
178.0
1.4
19.6
13.7
2.5
FY2017E
3,758
2.6
2,052
40.6
209.9
1.5
20.7
11.1
2.1
Source: Company, Angel Research
Source: Company, Angel Research
May 5, 2016
8
Top Picks Report | May 2016
National Buildings Construction Corporation (NBCC)
Stock Info
CMP
979
NBCC reported an order book of over
`35,000cr at 3QFY2016-end.
TP
1,089
Considering the bid pipeline for re-development works from Delhi and other
Upside
11.3%
State governments, and with ‘Smart City’ projects to take-off shortly, we expect
NBCC’s order-book to grow 1.5x during FY2016-18E to `59,440cr.
Sector
Construction
We expect NBCC to report 26.7% revenue CAGR during FY2015-18E (to
Market Cap (` cr)
11,746
`9,506cr), mainly driven by 29.3% revenue CAGR from PMC segment, where
Beta
1.3
re-development projects would contribute the maximum. We expect NBCC to
52 Week High / Low
1,215/ 707
report 41.5% EBITDA CAGR during the same period, led by increased
contribution from PMC segment, which is likely to experience margin
expansion. Owing to lower other income growth assumption, we expect NBCC
3 year-Chart
to report 32.9% PAT CAGR during FY2015-18E to `653cr.
1400
We have a strong positive view on NBCC, given its growth prospects as
1200
reflected by its strong order book of `35,000cr (6.3x OB to LTM revenues).
1000
Also, emerging opportunities in re-development space, government’s initiative of
800
developing ‘Smart Cities’, and the company’s cash rich status, should aid its growth.
600
On assigning 20.0x P/E multiple to our FY2018E EPS of `54.4/share, we arrive at a
400
price target of `1,089. Given the upside, we recommend Accumulate on the stock.
200
0
Key Financials
Y/E
Sales
OPM PAT EPS ROE P/E P/BV EV/EBITDA EV/Sales
March
(` cr)
(%)
(` cr)
(`)
(%)
(x)
(x)
(x)
(x)
Source: Company, Angel Research
FY2016E
5,816
6.9
355
29.6
24.1
33.1
5.9
25.1
1.8
FY2017E
7,382
7.7
478
39.8
26.7
24.6
4.7
17.2
1.3
Source: Company, Angel Research
May 5, 2016
9
Top Picks Report | May 2016
Top Picks - Mid Cap
May 5, 2016
10
Top Picks Report | May 2016
Stock Info
Blue Star
CMP
414
BSL is one of the largest air-conditioning companies in India. With a mere
TP
481
3% penetration level of ACs vs 25% in China, the overall outlook for the room
Upside
16.2%
air-conditioner (RAC) market in India is favourable.
Sector
Cons. Durable
BSL’s RAC business has been outgrowing the industry by ~10% points over the
Market Cap (` cr)
3,724
last few quarters, resulting in the company consistently increasing its market
Beta
0.7
share (~7% in FY2014 to ~10% at present). This has resulted in the Cooling
Products Division (CPD)'s share in overall revenues increasing from~23% in
52 Week High / Low
444 / 300
FY2010 to ~42% in FY2015 (expected to improve to ~48% in FY2018E). With
strong brand equity and higher share in split ACs, we expect the CPD to
3 year-Chart
continue to drive growth.
500
450
Aided by increasing contribution from the CPD, we expect the overall top-line
400
350
to post a revenue CAGR of 11.2% over FY2015-18E and margins to improve
300
from 5.3% in FY2015 to 7.1% in FY2018E. Moreover, the proposed merger
250
200
with Blue Star Infotech will provide cash influx and thus strengthen the balance
150
sheet. We maintain our Buy recommendation on the stock.
100
50
0
Key Financials
Y/E
Sales OPM PAT EPS ROE P/E P/BV EV/EBITDA EV/Sales
March
(` cr)
(%)
(` cr)
(`)
(%)
(x)
(x)
(x)
(x)
Source: Company, Angel Research
FY2016E
3,548
6.3
123
13.7
26.1
30.2
7.6
18.0
1.1
FY2017E
3,977
6.9
164
17.2
25.4
24.1
4.9
14.2
1.0
Source: Company, Angel Research
Dewan Housing Finance
Stock Info
CMP
201
3rd largest private sector housing finance: We expect DHFL’s AUM to grow at a
TP
270
CAGR of 21% over FY2016-18, as demand for housing in the middle & low
Upside
34.4%
income group is picks up, while PAT, CAGR is expected to be 22%
Seasoned and granular loan book with stable asset quality: Individual
Sector
Financials
borrowers account for 72%, while the high yielding loan against property
Market Cap (` cr)
5,864
(LAP+SME) and projects loans account for 19% and 9% of advances Despite strong
Beta
1.60
loan growth, the GNPAs and NNPAs are likely to be at ~1.17% and 0.82%,
52 Week High / Low
268 / 140
respectively, for FY2017. Don’t expect any major deterioration in the asset quality
going ahead.
180
Lower cost of funds will help maintain NIM: Nearly 70% of the bank
3 year-Chart
borrowings are due for maturity over the next three years and swapping a part
300
of that with non-convertible debentures (NCDs), where it has ~100bp cost
250
benefit, will help DHFL in maintaining its NIM at ~2.9%.
Outlook: We expect the company to post a healthy loan book CAGR of 21%
200
over FY2015-18E, which is likely to translate in an earnings CAGR of 22%,
150
over the same period. The stock currently trades at 0.8x FY2018E ABV. We
100
recommend a Buy on the stock, with a target price of `270.
50
0
Key Financials
Y/E
Op. Inc NIM
PAT
EPS
ABV ROA ROE P/E P/ABV
March
(` cr)
(%)
(` cr)
(`)
(`)
(%)
(%)
(x)
(x)
Source: Company, Angel Research
FY2016
1,828
2.9
729
24.9
162.0
1.2
15.0
8.1
1.2
FY2017E
2,225
2.9
866
29.7
184.0
1.1
16.1
6.8
1.1
Source: Company, Angel Research
May 5, 2016
11
Top Picks Report | May 2016
Stock Info
IL&FS Transportation Networks
CMP
74
Recently, ITNL reported Commercial Operations Date (CoD) for JSEL and
TP
93
PSRDCL. Also, Completion certificate was issued for BKEL. TRDCL P-III and
CNTL are expected to commence in next 2-3 months. Further, RIDCRO P-III,
Upside
25.3%
KSEL, KNEL, and BAEL are expected to commence operations in next 9-12
Sector
Construction
months. Accordingly, we expect revenue/ day from these projects to increase
Market Cap (` cr)
2,433
by ~`4cr/day (unadj. for stake).
Beta
1.1
Interest expenses related to 3 Annuity projects- JSEL, CNTL and TRDCL P-III
52 Week High / Low
164/64
are already captured in Income statement. As a result, we expect minimal
incremental stress on profitability to be seen with the commencement of these
3 year-Chart
projects. Also, we expect ITNL to benefit from declining interest rate cycle,
300
resulting in improved cash flow cycles at the SPV level.
250
With 7 projects expected to commence in next 12 months, we expect the debt
200
repayment cycle at SPV level to commence, resulting in the overall consol. D/E
150
levels peaking out at ~4.0x. With concerns over higher D/E levels allayed up
100
to certain extent, coupled with attractive valuations of 0.3x FY2017E P/BV
multiple ITNL stock is trading, we upgrade to Buy with price target of `93.
50
0
Key Financials
Y/E
Sales
OPM PAT EPS ROE P/E P/BV EV/EBITDA EV/Sales
March
(` cr)
(%)
(` cr)
(`)
(%)
(x)
(x)
(x)
(x)
Source: Company, Angel Research
FY2016E
7,360
34.0
218
7.0
3.2
10.6
0.4
10.8
3.7
FY2017E
8,825
35.9
301
9.0
3.7
8.2
0.3
10.0
3.6
Source: Company, Angel Research
Jagran Prakashan
Stock Info
CMP
166
We expect JPL to register a net sales CAGR of ~15% over FY2015-17E, on
back of (a) strong growth in advertising revenue due to improvement in GDP
TP
205
growth, and (b) improvement in circulation revenue owing to combination of
Upside
23.5%
increase in cover price and volume growth.
Sector
Media
Further the acquisition of Radio City would also boost the company's revenue
Market Cap (` cr)
5,420
going ahead. Radio City has ~20 stations across 7 states in the country and is
second only to ENIL in all its operating circles, ie Delhi, Mumbai, Bengaluru,
Beta
0.6
Chennai, Ahmedabad, Hyderabad, Pune and Lucknow. The company covers
52 Week High / Low
177/108
~51% (~66mn people) of the total radio population.
Raw material prices have been in a declining trend. Thus, considering lower
3 year-Chart
news print costs, healthy sales, and higher margins in the radio business, we
200
expect an adj. net profit CAGR of ~20% over FY2015-17E to `325cr.
190
Considering Dainik Jagran's strong presence in the rapidly growing Hindi
180
170
markets, we expect JPL to benefit from an eventual recovery in the Indian
160
economy. Hence, we maintain an Accumulate rating on the stock with a target
150
price of stock with a target price of `205.
140
130
120
Key Financials
110
Y/E
Sales
OPM PAT EPS ROE P/E P/BV EV/EBITDA EV/Sales
100
March
(` cr)
(%)
(` cr)
(`)
(%)
(x)
(x)
(x)
(x)
FY2016E
2,170
27.2
290
8.9
20.9
18.6
3.9
8.8
2.4
FY2017E
2,355
26.2
325
9.9
20.4
16.8
3.4
8.4
2.2
Source: Company, Angel Research
Source: Company, Angel Research
May 5, 2016
12
Top Picks Report | May 2016
Mahindra Lifespace
Stock Info
CMP
426
Speedy execution & speedier sales: MLF has 13 projects under implementation
across cities. MLF has exhibited fast completion of projects (4-4.5 years in
TP
554
Mumbai, other-wise 3-3.5 years across other cities), compared to others. Sales
Upside
30.1%
cycle in ~65% of projects is faster than execution cycle, contrary to industry
trends. This fast execution and sales is optimal, as it helps MLF in revenue
Sector
Real Estate
recognition, inventory cycle (better than Oberoi, DLF), cash flows and
Market Cap (` cr)
1,747
profitability. This translates in creating virtuous cycle of continuous fast growth.
Beta
0.5
Strong revenue growth visibility in short-to-long run: MLF as of 4QFY2016 is
pursuing ~4.0mn sq. ft. of sale of the total ~15.0mn sq. ft. of saleable area.
52 Week High / Low
559 / 401
Having sold ~60% of ongoing projects, we expect MLF to launch ~2.8mn
sq.ft. of saleable area in rational way during 4QFY2016-2QFY2018E, across
3 year-Chart
6 cities. Maturity at existing projects, new launches give better revenue visibility
for medium-term. Further, MLF is sitting on land bank of 11.0mn sq.ft across
700
4 cities, which allays any concern over long-term revenue growth.
600
With Real Estate Regulatory Bill closer to realty, MLF should be minimally
500
impacted, given their strong parentage and ethically implemented processes.
400
In longer-term organized, professional run, well funded players would enjoy
300
strong trust due to reliable and fast execution strategy. With improvement in
200
company’s fundamentals, strong earnings growth visibility and long-term
growth outlook, at current valuations of 1.1x FY2017E P/BV, MLF stock looks
100
attractive. We maintain BUY on MLF with target price of `554.
0
Key Financials
Y/E
Sales
OPM PAT EPS ROE P/E P/BV EV/EBITDA EV/Sales
Source: Company, Angel Research
March
(` cr)
(%)
(` cr)
(`)
(%)
(x)
(x)
(x)
(x)
FY2016
826
20.1
93
22.6
6.0
18.8
1.1
20.3
4.0
FY2017P
1,133
21.8
121
30.7
7.4
13.9
1.0
12.7
2.7
Source: Company, Angel Research
Stock Info
Navkar
CMP
174
NCL is one of the largest and one of the three CFS at JNPT with rail
TP
265
connectivity, helping it garner high market share at the port. NCL is in a massive
Upside
52.3%
expansion mode where it is increasing its capacity by 234% to 1,036,889 TEUS
at JNPT and coming up with an ICD at Vapi (with Logistics Park).
Sector
Logistics
The ICD with rail link should benefit from first mover advantage in a region
Market Cap (` cr)
2,487
that has huge market potential and accounts for ~27% of volumes at JNPT.
Beta
0.6
The ICD should be able to capture the EXIM volumes from the region through
52 Week High / Low
221 / 151
rail link that till now was being custom cleared at JNPT (Import) or being
transported via road and consolidated at JNPT (Export). South Gujarat
volumes will now head straight to the Vapi ICD; thus the company can now
3 year-Chart
cater to bulk commodities and domestic traffic that it had been rejecting owing
to capacity constraints at CFS.
250
We expect NCL to successfully use its rail advantage and scale up its
200
utilizations at both JNPT and Vapi ICD. We have a Buy rating on the stock.
150
Key Financials
100
Y/E
Sales
OPM PAT EPS ROE P/E P/BV EV/EBITDA EV/Sales
50
March
(` cr)
(%)
(` cr)
(`)
(%)
(x)
(x)
(x)
(x)
0
FY2016E
365
38.3
80
5.6
6.3
30.9
1.9
23.2
7.6
FY2017E
436
37.5
84
5.9
6.1
29.7
1.8
20.3
6.6
Source: Company, Angel Research
Source: Company, Angel Research
May 5, 2016
13
Top Picks Report | May 2016
Radico Khaitan
Stock Info
CMP
89
The IMFL segment is under penetrated. Going forward, increase in income
TP
156
levels would lead to higher growth in IMFL brands. RKL has strong brands in
Upside
75.3%
the premium liquor category which reported a CAGR of ~26% over the last
seven-year period. We expect the growth momentum to continue.
Sector
Breweries & Distilleries
Market Cap (` cr)
1,188
We expect the price of ENA, a key raw material, to remain stable and
potentially even decline going forward due to higher sugar production and
Beta
0.8
lower demand for ethanol from Indian oil marketing companies
52 Week High / Low
131/78
We expect a significant hike in liquor prices in the coming financial year as
there haven't been any significant ones in recent times. Also, we believe that
3 year-Chart
industry leader - United Spirits would shift focus on profitability over volume
180
growth considering the debt on its balance sheet, which in turn, would lead to
160
increased scope for other liquor companies to hike prices.
140
120
On valuation basis, Radico is trading at huge discount to its close peer United
100
Spirits. We have a Buy rating on the stock and target price of `156 (22x
80
FY2017E EPS).
60
40
20
Key Financials
0
Y/E
Sales
OPM PAT EPS ROE P/E P/BV EV/EBITDA EV/Sales
March
(` cr)
(%)
(` cr)
(`)
(%)
(x)
(x)
(x)
(x)
FY2016E
1,517
12.7
78
5.8
8.6
15.3
1.3
9.9
1.3
Source: Company, Angel Research
FY2017E
1,635
13.4
95
7.1
9.6
12.6
1.2
8.6
1.2
Source: Company, Angel Research
Stock Info
Siyaram Silk Mills
CMP
1,080
SSML has strong brands which cater to premium as well as popular mass
TP
1,354
segments of the market. Further, in FY2014, SSML entered the ladies' salwar
Upside
25.4%
kameez and ethnic wear segment. Going forward, we believe that the company
would be able to leverage its brand equity and continue to post strong performance.
Sector
Textile
Market Cap (` cr)
1,013
The company has a nationwide network of about 1,600 dealers and business
Beta
0.8
partners. It has a retail network of 160 stores and plans to add another 300-
350 stores going forward. Further, the company's brands are sold across
52 Week High / Low
1,400/896
3,00,000 multi brand outlets in the country.
Going forward, we expect SSML to report a net sales CAGR of ~10% to
3 year-Chart
~`1,815cr and adj.net profit CAGR of ~11% to `98cr over FY2015-17E on
back of market leadership in blended fabrics, strong brand building, wide
1600
1400
distribution channel, strong presence in tier II and tier III cities and emphasis
1200
on latest designs and affordable pricing points. At the current market price,
1000
SSML trades at an inexpensive valuation. We have a Buy rating on the stock
800
and target price of `1,354.
600
400
Key Financials
200
0
Y/E
Sales
OPM PAT EPS ROE P/E P/BV EV/EBITDA EV/Sales
March
(` cr)
(%)
(` cr)
(`)
(%)
(x)
(x)
(x)
(x)
FY2016E
1,636
11.5
84
89.9
17.9
12.0
2.0
6.3
0.8
FY2017E
1,815
11.5
98
104.1
17.8
10.4
1.7
5.4
0.7
Source: Company, Angel Research
Source: Company, Angel Research
May 5, 2016
14
Top Picks Report | May 2016
Macro watch
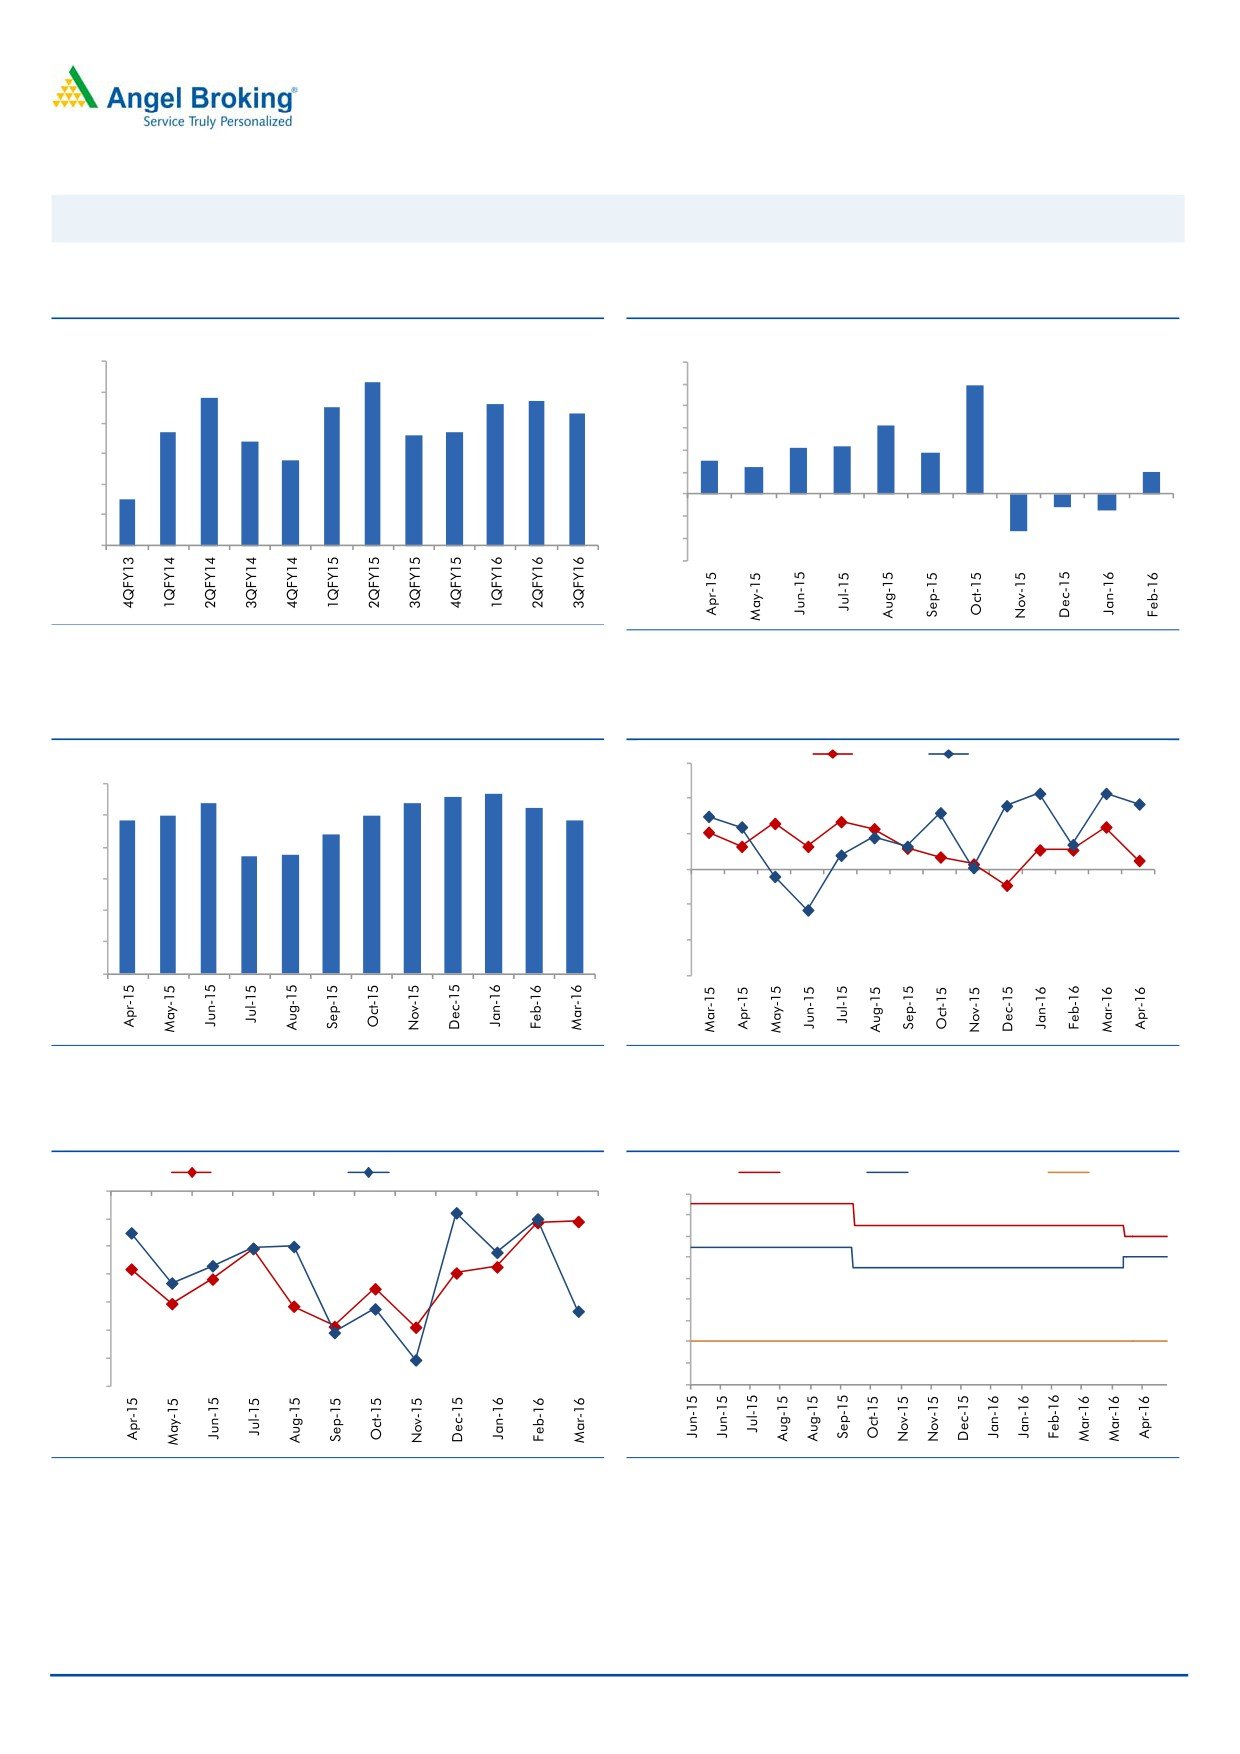
Exhibit 7: Quarterly GDP trends
Exhibit 8: IIP trends
(%)
(%)
9.0
8.3
12.0
9.9
7.8
7.7
8.0
7.5
7.6
10.0
7.3
8.0
6.3
6.7
6.6
6.7
7.0
6.4
6.0
4.2
4.3
3.7
5.8
3.0
6.0
4.0
2.5
2.0
2.0
5.0
4.5
-
4.0
(2.0)
(1.2)
(1.5)
(4.0)
3.0
(3.4)
(6.0)
Source: CSO, Angel Research
Source: MOSPI, Angel Research
Exhibit 9: Monthly CPI inflation trends
Exhibit 10: Manufacturing and services PMI
Mfg. PMI
Services PMI
(%)
56.0
5.6
5.7
6.0
5.4
5.4
5.3
5.0
5.0
54.0
4.9
4.8
5.0
4.4
3.7
3.7
52.0
4.0
50.0
3.0
48.0
2.0
1.0
46.0
-
44.0
Source: MOSPI, Angel Research
Source: Market, Angel Research; Note: Level above 50 indicates expansion
Exhibit 11: Exports and imports growth trends
Exhibit 12: Key policy rates
(%)
Exports yoy growth
Imports yoy growth
(%)
Repo rate
Reverse Repo rate
CRR
0.0
7.50
(5.0)
7.00
6.50
(10.0)
6.00
(15.0)
5.50
(20.0)
5.00
4.50
(25.0)
4.00
(30.0)
3.50
(35.0)
3.00
Source: Bloomberg, Angel Research
Source: RBI, Angel Research
May 5, 2016
15
Top Picks Report | May 2016
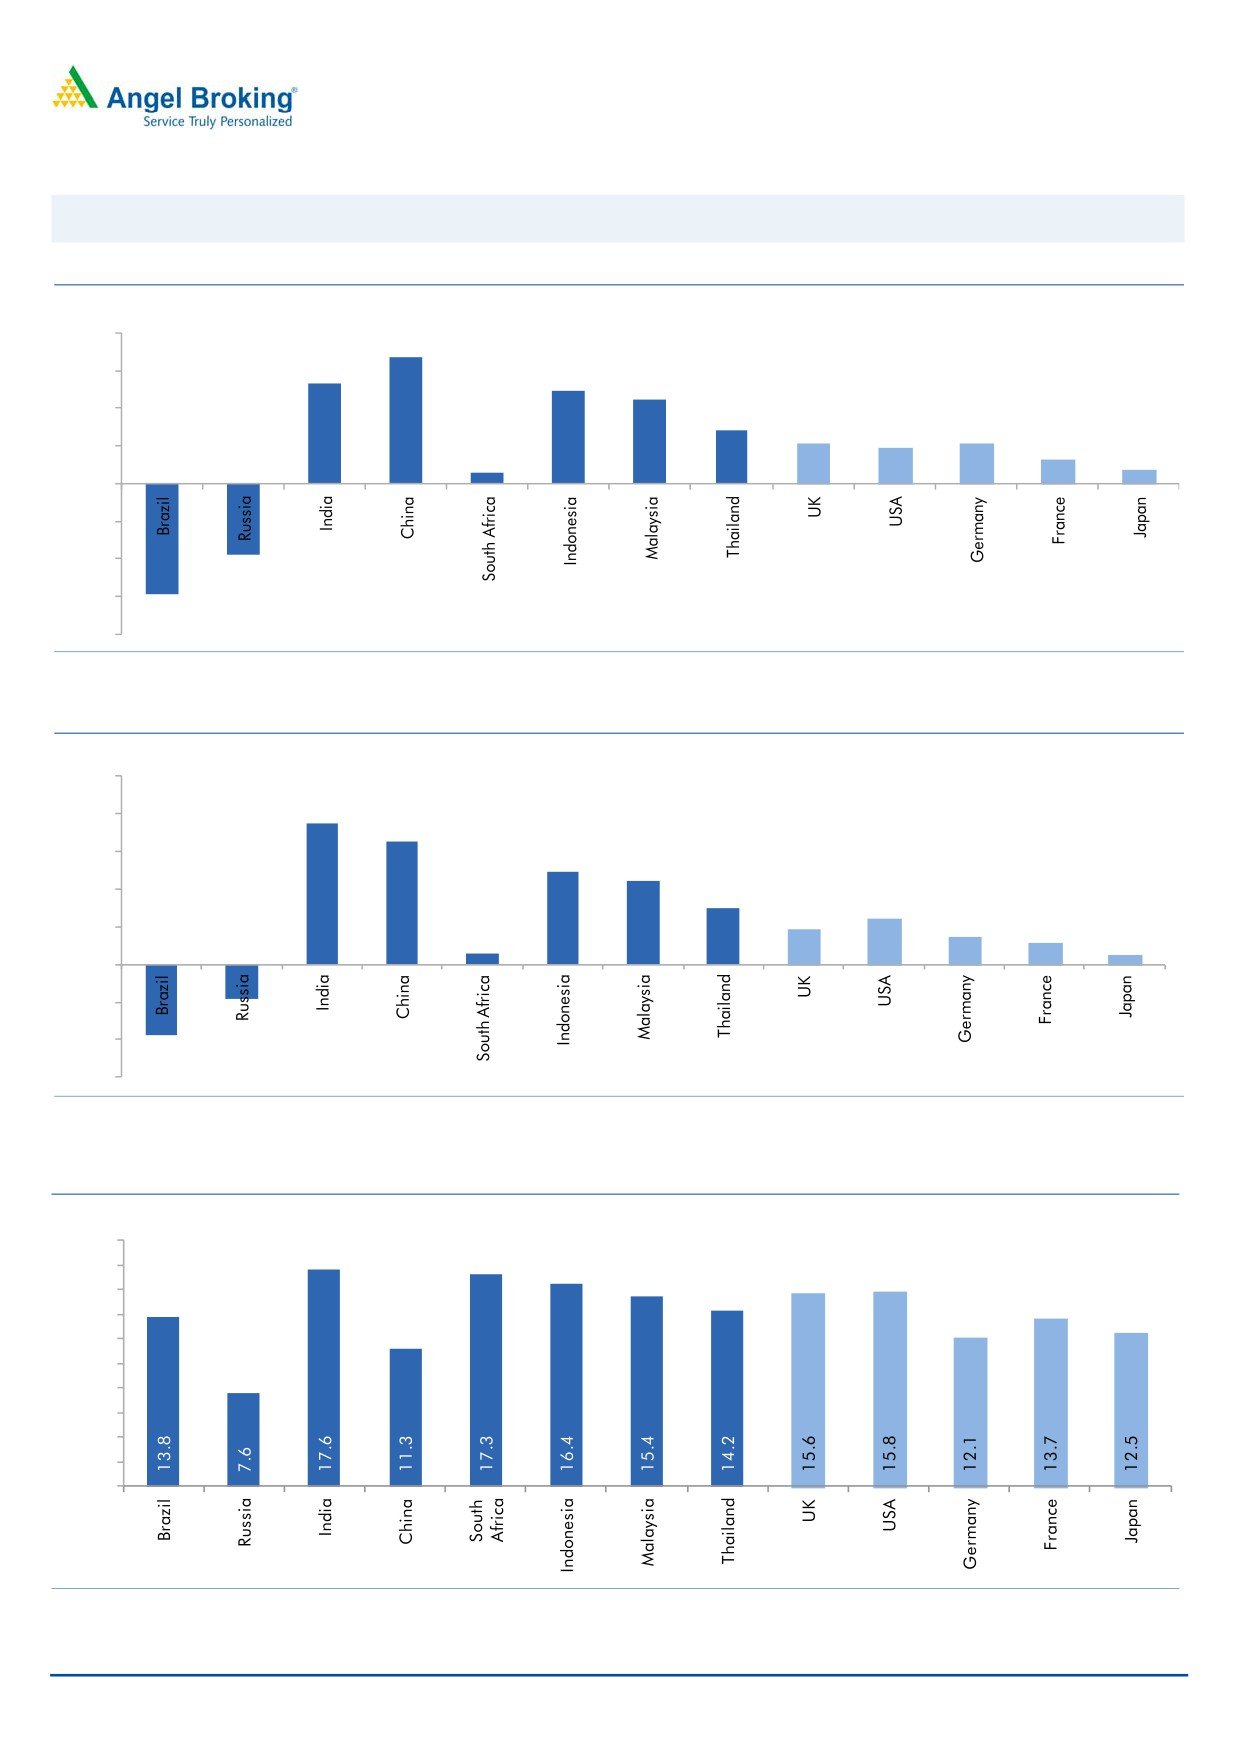
Global watch
Exhibit 1: Latest quarterly GDP Growth (%, yoy) across select developing and developed countries
(%)
8.0
6.7
6.0
5.3
4.9
4.5
4.0
2.8
2.1
1.9
2.1
2.0
1.3
0.6
0.7
-
(2.0)
(4.0)
(3.8)
(6.0)
(5.9)
(8.0)
Source: Bloomberg, Angel Research
Exhibit 2: 2015 GDP Growth projection by IMF (%, yoy) across select developing and developed countries
(%)
10.0
7.5
8.0
6.5
6.0
4.9
4.4
4.0
3.0
2.4
1.9
1.5
2.0
1.1
0.6
0.5
(3.8)
(1.8)
-
(2.0)
(4.0)
(6.0)
Source: IMF, Angel Research
Exhibit 3: One year forward P-E ratio across select developing and developed countries
(x)
20.0
18.0
16.0
14.0
12.0
10.0
8.0
6.0
4.0
2.0
-
Source: IMF, Angel Research
May 5, 2016
16
Top Picks Report | May 2016
Exhibit 4: Relative performance of indices across globe
Returns (%)
Country
Name of index
Closing price
1M
3M
1YR
Brazil
Bovespa
51,671
5.9
27.4
(7.4)
Russia
Micex
1,906
1.6
7.8
10.6
India
Nifty
7,736
0.3
2.2
(5.5)
China
Shanghai Composite
2,998
(4.6)
9.7
(34.9)
South Africa
Top 40
45,623
(1.4)
2.9
(5.4)
Mexico
Mexbol
45,148
(0.1)
4.8
0.8
Indonesia
LQ45
831
(1.4)
3.5
(12.4)
Malaysia
KLCI
1,645
(4.6)
(0.5)
(11.3)
Thailand
SET 50
882
(1.2)
9.9
(13.5)
USA
Dow Jones
17,661
0.3
8.1
(1.5)
UK
FTSE
6,117
(0.8)
3.3
(13.2)
Japan
Nikkei
16,147
(4.3)
(5.2)
(18.9)
Germany
DAX
9,852
1.6
4.1
(14.8)
France
CAC
4,319
(0.4)
0.9
(14.6)
Source: Bloomberg, Angel Research
May 5, 2016
17
Top Picks Report | May 2016
Stock Watch
May 5, 2016
18
Stock Watch | May 2016
Company Name
Reco
CMP
Target
Mkt Cap
Sales (` cr)
OPM (%)
EPS (`)
PER (x)
P/BV (x)
RoE (%)
EV/Sales (x)
(`)
Price (`)
(` cr)
FY16E
FY17E
FY16E
FY17E
FY16E
FY17E
FY16E
FY17E
FY16E
FY17E
FY16E
FY17E
FY16E
FY17E
Agri / Agri Chemical
RRallis
Neutral
196
-
3,806
1,612
1,911
13.3
13.3
7.4
9.5
26.4
20.6
4.2
3.8
16.7
18.4
2.4
2.0
United Phosphorus
Buy
592
684
25,393
13,083
15,176
18.5
18.5
31.5
37.4
18.8
15.8
3.7
3.1
21.4
21.4
2.1
1.8
Auto & Auto Ancillary
Ashok Leyland
Accumulate
103
111
29,270
17,995
21,544
11.4
11.6
3.4
4.7
30.3
21.9
5.3
4.9
17.7
22.2
1.6
1.3
Bajaj Auto
Accumulate
2,453
2,585
70,982
22,709
25,860
20.9
20.1
129.0
143.6
19.0
17.1
5.8
5.0
30.7
29.4
2.7
2.3
Bharat Forge
Accumulate
782
875
18,194
7,351
8,318
19.9
19.7
31.2
36.5
25.0
21.4
4.5
3.8
19.3
19.2
2.6
2.3
Eicher Motors
Neutral
19,687
-
53,471
15,556
16,747
15.5
17.3
464.8
597.5
42.4
32.9
15.5
11.4
36.2
34.3
3.4
3.1
Gabriel India
Accumulate
90
101
1,294
1,415
1,544
8.7
9.0
4.6
5.4
19.6
16.7
3.5
3.2
18.1
18.9
0.9
0.8
Hero Motocorp
Neutral
2,894
-
57,789
28,244
30,532
15.5
15.9
156.7
168.5
18.5
17.2
7.4
6.3
39.9
36.4
1.9
1.7
Jamna Auto Industries
Accumulate
142
160
1,131
1,281
1,473
11.2
11.5
7.6
9.2
18.6
15.4
4.7
3.9
25.4
25.2
0.9
0.8
L G Balakrishnan & Bros Neutral
455
-
714
1,254
1,394
11.6
11.8
35.9
41.7
12.7
10.9
1.7
1.5
13.5
13.8
0.7
0.6
Mahindra and Mahindra Neutral
1,321
-
82,025
38,416
42,904
13.7
13.9
54.8
63.4
24.1
20.8
3.7
3.3
15.4
15.8
1.8
1.5
Maruti
Neutral
3,840
-
1,16,000
57,865
68,104
16.4
16.7
176.3
225.5
21.8
17.0
4.2
3.6
19.4
21.2
1.8
1.5
Minda Industries
Neutral
1,013
-
1,608
2,523
2,890
8.7
9.0
55.0
65.4
18.4
15.5
3.6
2.9
19.3
18.7
0.7
0.6
Motherson Sumi
Buy
254
313
33,644
39,343
45,100
8.8
9.1
10.1
12.5
25.2
20.3
8.0
6.2
35.3
34.4
0.9
0.8
Rane Brake Lining
Buy
372
465
294
454
511
11.5
12.0
25.2
31.0
14.8
12.0
2.2
2.0
14.9
16.6
0.8
0.7
Setco Automotive
Neutral
31
-
414
594
741
12.7
13.7
1.7
3.2
18.2
9.7
1.9
1.7
10.4
16.9
1.1
0.9
Tata Motors
Neutral
391
-
1,12,947
2,59,686
2,73,957
13.0
13.4
25.9
29.5
15.1
13.3
2.0
1.7
8.0
9.0
0.6
0.6
TVS Motor
Accumulate
295
330
14,027
11,263
13,122
6.9
8.5
9.2
15.0
32.1
19.7
7.3
5.8
22.7
29.6
1.2
1.0
Amara Raja Batteries
Buy
931
1,076
15,905
4,892
5,871
17.4
17.6
28.8
37.1
32.3
25.1
7.5
6.0
23.4
24.1
3.2
2.6
Exide Industries
Accumulate
142
162
12,053
6,950
7,784
14.4
14.8
6.6
7.3
21.5
19.4
2.7
2.5
12.6
12.8
1.4
1.3
Apollo Tyres
Buy
156
183
7,920
12,056
12,714
17.2
16.4
23.0
20.3
6.8
7.7
1.2
1.0
17.7
13.6
0.7
0.7
Ceat
Accumulate
1,053
1,119
4,260
6,041
6,597
14.1
13.7
99.5
111.9
10.6
9.4
2.1
1.7
19.6
18.5
0.9
0.7
JK Tyres
Neutral
81
-
1,833
7,446
7,669
15.2
14.0
19.6
18.4
4.1
4.4
1.0
0.9
25.2
19.5
0.6
0.5
Swaraj Engines
Neutral
1,113
-
1,382
552
630
14.2
14.7
44.6
54.1
25.0
20.6
5.8
5.3
23.2
25.6
2.4
2.0
Subros
Neutral
88
-
528
1,293
1,527
11.8
11.9
4.2
6.7
21.0
13.1
1.6
1.4
7.7
11.5
0.7
0.6
Indag Rubber
Neutral
182
-
477
283
329
17.0
17.2
13.0
15.4
14.0
11.8
3.1
2.5
21.8
21.6
1.4
1.2
Banking
Allahabad Bank
Neutral
54
-
3,287
8,569
9,392
2.8
2.9
16.3
27.5
3.3
1.9
0.3
0.24
7.6
11.9
-
-
Axis Bank
Accumulate
461
494
1,10,031
26,204
29,738
3.6
3.5
34.5
35.4
13.4
13.0
2.1
1.87
16.8
14.9
-
-
Bank of Baroda
Neutral
149
-
34,274
18,802
21,088
2.0
2.2
(7.4)
13.0
-
11.4
1.2
0.9
(4.2)
7.3
-
-
Bank of India
Neutral
86
-
7,014
15,972
17,271
1.9
2.0
15.3
33.3
5.6
2.6
0.3
0.2
3.6
7.6
-
-
Canara Bank
Neutral
190
-
10,290
15,441
16,945
2.0
2.1
46.6
70.4
4.1
2.7
0.4
0.3
8.0
11.2
-
-
Dena Bank
Neutral
29
-
1,927
3,440
3,840
2.1
2.3
7.2
10.0
4.0
2.9
0.3
0.2
6.1
7.9
-
-
Dewan Housing Finance Buy
201
270
5,872
1,828
2,225
2.9
2.9
24.9
29.7
8.1
6.8
1.2
1.1
15.0
16.1
-
-
Federal Bank
Neutral
49
-
8,418
3,279
3,787
2.8
2.9
3.9
5.5
12.4
8.9
1.0
0.9
8.4
10.8
-
-
HDFC
Neutral
1,164
-
1,83,870
10,358
11,852
3.3
3.3
41.1
47.0
28.3
24.7
5.4
4.9
24.7
24.9
-
-
HDFC Bank
Accumulate
1,133
1,262
2,86,550
38,606
47,696
4.4
4.5
48.8
61.4
23.2
18.5
3.9
3.43
18.7
20.0
-
-
ICICI Bank
Buy
215
254
1,24,939
34,279
39,262
3.3
3.3
21.0
24.4
10.2
8.8
1.7
1.5
14.4
14.7
-
-
May 6, 2016
19
Stock Watch | May 2016
Company Name
Reco
CMP
Target
Mkt Cap
Sales (` cr)
OPM (%)
EPS (`)
PER (x)
P/BV (x)
RoE (%)
EV/Sales (x)
(`)
Price (`)
(` cr)
FY16E
FY17E
FY16E
FY17E
FY16E
FY17E
FY16E
FY17E
FY16E
FY17E
FY16E
FY17E
FY16E
FY17E
IDBI Bank
Neutral
66
-
13,660
9,625
10,455
1.8
1.8
8.5
14.2
7.8
4.7
0.5
0.4
5.9
9.3
-
-
Indian Bank
Neutral
92
-
4,426
6,160
6,858
2.4
2.5
24.5
29.8
3.8
3.1
0.3
0.3
7.7
8.6
-
-
LIC Housing Finance
Buy
450
592
22,712
3,179
3,758
2.6
2.6
32.9
40.6
13.7
11.1
2.5
2.1
19.6
20.7
-
-
Oriental Bank
Neutral
84
-
2,711
7,643
8,373
2.4
2.4
37.2
45.4
2.3
1.9
0.2
0.2
8.2
9.4
-
-
Punjab Natl.Bank
Neutral
82
-
16,023
23,122
26,022
2.8
2.8
7.0
21.6
11.7
3.8
0.6
0.5
3.4
10.0
-
-
South Ind.Bank
Neutral
18
-
2,404
1,965
2,185
2.5
2.5
2.5
3.3
7.1
5.4
0.7
0.6
9.5
11.6
-
-
St Bk of India
Neutral
180
-
1,40,079
79,958
86,060
2.6
2.6
13.4
20.7
13.5
8.7
1.1
1.0
11.5
12.8
-
-
Union Bank
Neutral
117
-
8,029
12,646
14,129
2.3
2.4
31.0
39.1
3.8
3.0
0.4
0.3
9.8
11.4
-
-
Vijaya Bank
Neutral
32
-
2,942
3,536
3,827
1.8
1.9
5.5
6.7
5.7
4.7
0.5
0.4
7.8
8.8
-
-
Yes Bank
Neutral
912
-
38,385
7,190
9,011
3.2
3.3
58.2
69.7
15.7
13.1
2.8
2.4
19.2
19.6
-
-
Capital Goods
ACE
Neutral
40
-
394
660
839
4.7
8.2
1.0
3.9
39.8
10.2
1.2
1.1
3.2
11.3
0.7
0.6
BEML
Buy
894
1,157
3,725
3,277
4,006
6.0
8.9
36.2
64.3
24.7
13.9
1.7
1.6
5.7
11.7
1.2
0.9
Bharat Electronics
Buy
1,147
1,414
27,516
7,737
8,634
16.8
17.2
54.0
61.5
21.2
18.6
3.0
2.7
39.3
45.6
2.7
2.3
Voltas
Buy
290
353
9,586
5,363
5,963
8.0
9.1
11.0
13.8
26.3
21.0
4.0
3.5
16.2
17.9
1.7
1.5
BGR Energy
Neutral
117
-
846
3,615
3,181
9.5
9.4
16.7
12.4
7.0
9.5
0.7
0.6
10.0
7.0
0.6
0.8
BHEL
Neutral
123
-
30,069
33,722
35,272
10.8
11.7
10.5
14.2
11.7
8.7
0.9
0.8
7.0
9.0
1.0
0.9
Blue Star
Buy
414
481
3,724
3,548
3,977
6.3
6.9
13.7
17.2
30.2
24.1
7.6
4.9
26.1
25.4
1.1
1.0
Crompton Greaves
Neutral
59
-
3,710
13,484
14,687
4.9
6.2
4.5
7.1
13.2
8.3
0.9
0.9
7.2
10.8
0.4
0.4
Greaves Cotton
Neutral
132
-
3,211
1,655
1,755
16.6
16.8
7.4
7.8
17.8
16.9
3.6
3.4
21.1
20.6
1.9
1.8
Inox Wind
Buy
291
458
6,468
4,980
5,943
17.0
17.5
26.6
31.6
11.0
9.2
3.3
2.4
35.0
30.0
1.4
1.2
KEC International
Neutral
127
-
3,277
8,791
9,716
6.1
6.8
5.4
8.2
23.6
15.5
2.4
2.2
10.0
14.0
0.6
0.5
Thermax
Neutral
742
-
8,844
6,413
7,525
7.4
8.5
30.5
39.3
24.3
18.9
3.7
3.3
15.0
17.0
1.4
1.1
VATech Wabag
Neutral
579
-
3,153
2,722
3,336
7.9
8.1
19.5
24.6
29.7
23.5
3.1
2.8
11.1
12.4
1.2
1.0
Cement
ACC
Neutral
1,396
-
26,206
13,151
14,757
16.4
18.3
63.9
83.4
21.8
16.7
2.8
2.6
13.3
16.1
1.8
1.5
Ambuja Cements
Neutral
216
-
33,544
11,564
12,556
19.4
20.7
8.9
10.1
24.3
21.4
3.0
2.9
12.8
13.8
2.5
2.3
HeidelbergCement
Neutral
92
-
2,095
1,772
1,926
13.3
15.4
1.0
3.0
92.5
30.8
2.3
2.2
2.6
7.9
1.8
1.5
India Cements
Neutral
90
-
2,751
4,216
4,840
18.0
19.5
4.0
9.9
22.4
9.0
0.9
0.8
4.0
9.5
1.0
0.8
JK Cement
Neutral
580
-
4,056
3,661
4,742
10.1
15.8
7.5
28.5
77.3
20.4
2.3
2.1
7.5
22.9
1.6
1.2
J K Lakshmi Cement
Neutral
339
-
3,985
2,947
3,616
16.7
19.9
11.5
27.2
29.4
12.5
2.8
2.4
9.8
20.8
1.8
1.4
Mangalam Cements
Neutral
267
-
713
1,053
1,347
10.5
13.3
8.4
26.0
31.8
10.3
1.3
1.2
4.3
12.5
1.1
0.8
Orient Cement
Neutral
149
-
3,042
1,854
2,524
21.2
22.2
7.7
11.1
19.3
13.4
2.8
2.4
13.3
15.7
2.4
1.7
Ramco Cements
Neutral
479
-
11,407
4,036
4,545
20.8
21.3
15.1
18.8
31.7
25.5
3.9
3.4
12.9
14.3
3.3
2.9
Shree Cement^
Neutral
12,397
-
43,187
7,150
8,742
26.7
28.6
228.0
345.5
54.4
35.9
8.0
6.7
15.7
20.3
5.8
4.7
UltraTech Cement
Neutral
3,120
-
85,627
24,669
29,265
18.2
20.6
82.0
120.0
38.1
26.0
4.1
3.6
11.3
14.7
3.5
3.0
Construction
ITNL
Buy
74
93
2,441
7,360
8,825
34.0
35.9
7.0
9.0
10.6
8.2
0.4
0.3
3.2
3.7
3.7
3.6
KNR Constructions
Buy
517
603
1,454
937
1,470
14.3
14.0
44.2
38.6
11.7
13.4
2.3
2.0
15.4
15.4
1.6
1.1
Larsen & Toubro
Neutral
1,273
-
1,18,665
58,870
65,708
8.3
10.3
42.0
53.0
30.3
24.0
2.1
1.9
8.8
11.2
2.2
2.0
Gujarat Pipavav Port
Neutral
165
-
7,960
629
684
51.0
52.2
6.4
5.9
25.7
27.9
3.4
3.1
15.9
12.7
12.3
11.1
MBL Infrastructures
Buy
141
285
586
2,313
2,797
12.2
14.6
19.0
20.0
7.4
7.1
0.8
0.7
11.3
10.6
1.0
0.9
Nagarjuna Const.
Neutral
76
-
4,247
7,892
8,842
8.8
9.1
3.0
5.3
25.5
14.4
1.3
1.2
5.0
8.5
0.8
0.7
PNC Infratech
Neutral
543
-
2,785
1,873
2,288
13.2
13.5
24.0
32.0
22.6
17.0
2.2
2.0
12.1
12.3
1.6
1.3
May 6, 2016
20
Stock Watch | May 2016
Company Name
Reco
CMP
Target
Mkt Cap
Sales (` cr)
OPM (%)
EPS (`)
PER (x)
P/BV (x)
RoE (%)
EV/Sales (x)
(`)
Price (`)
(` cr)
FY16E
FY17E
FY16E
FY17E
FY16E
FY17E
FY16E
FY17E
FY16E
FY17E
FY16E
FY17E
FY16E
FY17E
Simplex Infra
Neutral
276
-
1,365
5,955
6,829
10.3
10.5
16.0
31.0
17.2
8.9
0.9
0.8
5.3
9.9
0.7
0.6
Power Mech Projects
Neutral
599
-
881
1,539
1,801
12.8
12.7
59.0
72.1
10.2
8.3
1.5
1.3
18.6
16.8
0.6
0.5
Sadbhav Engineering
Accumulate
252
289
4,324
3,481
4,219
10.7
10.8
8.2
11.7
30.7
21.5
2.9
2.6
10.3
13.5
1.5
1.2
NBCC
Accumulate
979
1,089
11,746
5,816
7,382
6.9
7.7
29.6
39.8
33.1
24.6
5.9
4.7
24.1
26.7
1.7
1.3
MEP Infra
Neutral
41
-
673
1,956
1,876
28.1
30.5
1.3
3.0
31.8
13.8
6.7
4.5
21.2
32.8
1.8
1.7
SIPL
Neutral
98
-
3,436
675
1,042
62.4
64.7
-
-
3.7
4.2
-
-
16.8
11.3
Engineers India
Neutral
173
-
5,842
1,667
1,725
13.5
16.0
9.7
11.4
17.9
15.2
2.1
2.0
11.7
13.4
2.3
2.3
FMCG
Asian Paints
Neutral
868
-
83,292
16,553
19,160
16.0
16.2
17.7
21.5
49.1
40.4
13.0
11.7
29.4
31.2
4.9
4.2
Britannia
Neutral
2,821
-
33,846
8,481
9,795
14.0
14.1
65.5
78.3
43.1
36.0
20.4
16.7
38.3
41.2
3.9
3.4
Colgate
Neutral
846
-
23,000
4,136
4,632
22.5
23.3
22.2
25.3
38.1
33.4
23.2
20.6
68.6
67.5
5.4
4.8
Dabur India
Neutral
283
-
49,749
9,370
10,265
17.6
17.3
7.3
8.1
38.6
34.9
10.0
9.2
31.7
30.6
5.1
4.7
GlaxoSmith Con*
Neutral
5,832
-
24,525
4,519
5,142
19.6
19.8
164.3
191.2
35.5
30.5
9.8
8.4
30.8
29.9
4.8
4.2
Godrej Consumer
Neutral
1,326
-
45,153
9,003
10,335
18.1
18.7
34.1
41.8
38.9
31.7
8.4
7.2
23.9
24.8
5.2
4.5
HUL
Neutral
851
-
1,84,183
33,299
35,497
17.1
17.1
18.9
20.0
45.0
42.6
22.8
26.2
87.6
80.8
5.3
5.0
ITC
Accumulate
318
359
2,55,539
36,804
38,776
37.9
37.9
12.2
12.9
26.0
24.6
7.2
6.4
27.7
25.8
6.5
6.2
Marico
Neutral
247
-
31,829
6,151
6,966
17.2
17.3
5.4
6.4
45.7
38.5
14.3
11.3
33.2
32.4
5.1
4.5
Nestle*
Neutral
5,535
-
53,362
9,393
10,507
22.2
22.3
106.8
121.8
51.8
45.4
18.2
16.4
34.8
36.7
5.5
4.9
Tata Global
Buy
116
137
7,343
8,635
9,072
9.8
9.9
5.8
7.2
20.1
16.2
1.8
1.7
6.8
7.4
0.9
0.8
Procter & Gamble
Buy
6,392
7,369
20,748
2,588
2,939
23.3
23.2
130.2
146.2
49.1
43.7
97.9
93.9
27.6
25.3
7.6
6.6
IT
HCL Tech^
Buy
734
1,038
1,03,465
42,038
47,503
21.2
21.5
51.5
57.7
14.2
12.7
3.1
2.4
21.5
18.8
2.1
1.6
Infosys
Buy
1,192
1,374
2,74,794
62,441
70,558
27.5
27.5
59.0
65.3
20.2
18.3
4.1
3.7
22.2
22.4
3.8
3.3
TCS
Buy
2,474
3,004
4,87,484
1,08,646
1,22,770
28.3
28.3
123.7
141.0
20.0
17.5
6.6
6.1
33.1
34.6
4.0
3.5
Tech Mahindra
Accumulate
479
530
46,482
26,524
29,177
16.2
17.0
28.8
33.6
16.6
14.3
3.2
2.7
19.3
19.1
1.5
1.3
Wipro
Buy
543
680
1,34,160
50,808
56,189
23.7
23.8
37.3
40.7
14.6
13.3
2.8
2.5
19.2
17.7
2.1
1.7
Media
D B Corp
Accumulate
331
356
6,080
2,025
2,187
27.4
27.4
17.4
18.9
19.0
17.5
4.3
3.9
22.9
23.7
3.0
2.7
HT Media
Neutral
86
-
2,004
2,495
2,673
12.9
13.2
6.8
7.2
12.7
12.0
1.0
0.9
7.5
7.8
0.4
0.3
Jagran Prakashan
Buy
166
205
5,420
2,170
2,355
27.2
26.2
8.9
9.9
18.6
16.7
3.9
3.4
20.9
20.4
2.4
2.2
Sun TV Network
Neutral
355
-
13,992
2,510
2,763
71.8
71.5
21.9
24.8
16.2
14.3
3.8
3.5
22.8
24.3
5.0
4.6
Hindustan Media Vent.
Neutral
264
-
1,937
914
1,016
21.7
21.5
21.9
23.2
12.0
11.4
2.2
1.8
18.0
16.2
1.5
1.3
Metal
Coal India
Buy
282
380
1,78,058
76,167
84,130
19.9
22.3
22.4
25.8
12.6
10.9
4.5
4.4
35.5
41.0
1.7
1.5
Hind. Zinc
Neutral
168
-
70,837
14,641
14,026
50.4
50.4
17.7
16.0
9.5
10.5
1.5
1.3
16.2
13.2
2.5
2.3
Hindalco
Neutral
91
-
18,688
1,04,356
1,11,186
8.7
9.5
6.7
11.1
13.5
8.2
0.5
0.5
3.5
5.9
0.7
0.6
JSW Steel
Neutral
1,321
-
31,929
42,308
45,147
16.4
20.7
(10.3)
49.5
-
26.7
1.5
1.4
(1.0)
5.6
1.8
1.7
NMDC
Neutral
93
-
36,971
8,237
10,893
46.6
44.5
9.9
11.7
9.4
8.0
1.0
0.9
12.4
13.0
4.3
3.3
SAIL
Neutral
42
-
17,429
45,915
53,954
7.2
10.5
1.5
4.4
28.0
9.6
0.4
0.4
2.3
4.1
1.0
0.9
Vedanta
Neutral
105
-
31,040
71,445
81,910
26.2
26.2
12.9
19.2
8.1
5.5
0.6
0.5
7.2
8.9
0.9
0.7
Tata Steel
Neutral
332
-
32,244
1,26,760
1,37,307
8.9
11.3
6.4
23.1
52.2
14.4
1.0
1.0
2.0
7.1
0.8
0.8
May 6, 2016
21
Stock Watch | May 2016
Company Name
Reco
CMP
Target
Mkt Cap
Sales (` cr)
OPM (%)
EPS (`)
PER (x)
P/BV (x)
RoE (%)
EV/Sales (x)
(`)
Price (`)
(` cr)
FY16E
FY17E
FY16E
FY17E
FY16E
FY17E
FY16E
FY17E
FY16E
FY17E
FY16E
FY17E
FY16E
FY17E
Oil & Gas
Cairn India
Neutral
137
-
25,611
11,323
12,490
49.4
51.0
20.7
20.6
6.6
6.6
0.4
0.4
6.4
6.1
1.3
0.7
GAIL
Neutral
366
-
46,414
64,856
70,933
9.1
9.6
24.0
28.9
15.3
12.7
1.3
1.2
8.8
9.6
0.9
0.8
ONGC
Neutral
211
-
1,80,393
1,54,564
1,45,998
36.8
37.4
20.8
22.6
10.1
9.3
0.9
0.9
10.1
9.7
1.4
1.5
Petronet LNG
Neutral
279
-
20,944
29,691
31,188
5.8
6.2
12.8
13.4
21.8
20.8
3.3
2.9
15.8
14.8
0.8
0.7
Indian Oil Corp
Accumulate
410
455
99,582
3,59,607
4,02,760
5.9
6.1
42.5
48.7
9.7
8.4
1.3
1.1
14.1
14.3
0.4
0.3
Reliance Industries
Buy
975
1,150
3,15,953
3,04,775
3,44,392
12.6
13.4
91.3
102.6
10.7
9.5
1.2
1.1
11.8
12.0
1.0
0.8
Pharmaceuticals
Alembic Pharma
Neutral
600
-
11,319
3,274
3,802
26.9
19.4
35.0
28.7
17.2
20.9
7.6
5.7
55.6
31.2
3.4
2.9
Aurobindo Pharma
Accumulate
805
856
47,118
14,923
17,162
22.0
23.0
35.7
42.8
22.6
18.8
6.6
5.0
34.0
30.2
3.5
3.0
Aventis*
Accumulate
4,400
4,738
10,133
2,049
2,375
15.4
17.3
115.4
153.5
38.1
28.7
6.2
4.9
19.3
25.8
4.7
4.0
Cadila Healthcare
Accumulate
323
352
33,031
10,224
11,840
21.0
22.0
14.6
17.6
22.1
18.3
6.1
4.7
30.8
29.0
3.3
2.8
Cipla
Accumulate
541
605
43,479
13,979
16,447
20.2
18.6
25.7
27.5
21.1
19.7
3.4
3.0
17.6
16.1
3.1
2.6
Dr Reddy's
Buy
2,931
3,933
49,986
16,838
19,575
25.0
23.1
167.5
178.8
17.5
16.4
3.7
3.1
23.1
20.4
2.9
2.4
Dishman Pharma
Neutral
161
-
2,599
1,733
1,906
21.5
21.5
10.1
10.0
15.9
16.1
1.9
1.7
10.5
11.2
2.0
1.7
GSK Pharma*
Neutral
3,597
-
30,471
2,870
3,158
20.0
22.1
59.5
68.3
60.5
52.7
17.8
18.3
28.5
34.3
10.1
9.2
Indoco Remedies
Neutral
267
-
2,459
1,033
1,199
15.9
18.2
9.4
13.6
28.4
19.6
4.2
3.6
15.7
19.7
2.5
2.1
Ipca labs
Buy
486
750
6,134
3,363
3,909
12.9
18.6
13.4
28.0
36.3
17.4
2.6
2.3
7.4
14.0
2.1
1.8
Lupin
Neutral
1,605
-
72,350
13,092
16,561
25.0
27.0
50.4
68.3
31.9
23.5
6.6
5.2
22.8
24.7
5.2
4.0
Sun Pharma
Buy
811
950
1,95,157
28,163
32,610
25.8
30.7
17.4
26.9
46.6
30.1
4.4
3.8
13.0
16.6
6.4
5.3
Power
Tata Power
Neutral
70
-
19,014
35,923
37,402
22.6
22.8
4.1
5.2
17.3
13.6
1.3
1.2
7.5
9.3
1.5
1.4
NTPC
Neutral
139
-
1,14,901
87,271
99,297
23.4
23.5
11.7
13.3
11.9
10.5
1.3
1.2
11.5
12.2
2.3
2.1
Power Grid
Buy
143
170
74,916
20,702
23,361
86.7
86.4
12.1
13.2
11.9
10.8
1.7
1.6
15.6
15.1
8.5
7.9
Real Estate
MLIFE
Buy
426
554
1,747
826
1,133
20.1
21.8
22.6
30.7
18.8
13.9
1.1
1.0
6.0
7.4
4.0
2.7
Telecom
Bharti Airtel
Neutral
355
-
1,41,988
1,01,748
1,09,191
32.1
31.7
12.0
12.5
29.6
28.4
2.0
1.9
6.9
6.7
2.0
1.8
Idea Cellular
Neutral
114
-
40,902
34,282
36,941
32.0
31.5
5.9
6.2
19.3
18.3
1.8
1.6
9.9
9.3
1.8
1.7
Others
Abbott India
Neutral
4,660
-
9,902
2,715
3,153
14.5
14.1
134.3
152.2
34.7
30.6
8.7
7.1
27.4
25.6
3.4
2.8
Bajaj Electricals
Neutral
226
-
2,281
4,719
5,287
5.2
5.8
8.6
12.7
26.4
17.8
3.0
2.6
11.4
14.8
0.5
0.4
Banco Products (India)
Neutral
128
-
916
1,208
1,353
10.9
12.3
10.8
14.5
11.9
8.8
1.4
1.2
11.9
14.5
0.7
0.6
Coffee Day Enterprises
Neutral
267
-
5,491
2,692
2,964
17.0
18.6
-
4.7
-
56.3
3.3
3.1
0.1
5.5
2.4
2.3
Competent Automobiles Neutral
146
-
89
1,040
1,137
3.2
3.1
25.7
28.0
5.7
5.2
0.8
0.7
15.0
14.3
0.1
0.1
Elecon Engineering
Neutral
62
-
678
1,359
1,482
10.3
13.6
0.8
3.9
77.5
16.0
1.3
1.2
1.6
7.8
0.8
0.8
Finolex Cables
Neutral
274
-
4,187
2,520
2,883
12.2
12.0
12.7
14.2
21.6
19.3
2.9
2.6
13.6
13.5
1.4
1.2
Garware Wall Ropes
Buy
345
473
755
862
974
11.2
11.2
24.9
29.6
13.9
11.7
2.1
1.8
15.1
15.4
0.9
0.7
Goodyear India*
Buy
498
582
1,149
1,800
1,600
11.7
11.5
58.7
52.9
8.5
9.4
1.9
1.6
24.6
18.7
0.4
0.4
May 6, 2016
22
Stock Watch | May 2016
Company Name
Reco
CMP
Target
Mkt Cap
Sales (` cr)
OPM (%)
EPS (`)
PER (x)
P/BV (x)
RoE (%)
EV/Sales (x)
(`)
Price (`)
(` cr)
FY16E
FY17E
FY16E
FY17E FY16E
FY17E
FY16E
FY17E
FY16E
FY17E
FY16E
FY17E
FY16E
FY17E
Hitachi
Neutral
1,349
-
3,668
1,779
2,081
7.8
8.8
21.8
33.4
61.9
40.4
10.0
8.1
17.4
22.1
2.1
1.8
HSIL
Neutral
307
-
2,216
2,123
2,384
16.1
16.5
15.0
18.9
20.4
16.2
1.6
1.5
8.0
9.4
1.4
1.2
Interglobe Aviation
Neutral
1,088
-
39,221
17,022
21,122
20.7
14.5
63.9
53.7
17.0
20.3
25.5
20.9
149.9
103.2
2.3
1.9
Jyothy Laboratories
Neutral
304
-
5,506
1,620
1,847
11.5
11.5
7.3
8.5
41.7
35.9
5.4
5.0
13.3
14.4
3.3
2.8
Kirloskar Engines India
Neutral
230
-
3,331
2,403
2,554
8.6
9.9
9.2
10.5
25.1
22.0
2.4
2.3
9.7
10.7
1.0
0.9
Linc Pen & Plastics
Neutral
192
-
283
340
371
8.3
8.9
10.8
13.2
17.7
14.5
2.8
2.5
16.0
17.1
0.9
0.8
M M Forgings
Buy
475
614
573
511
615
21.7
21.6
43.1
55.8
11.0
8.5
2.0
1.6
19.9
21.2
1.3
1.0
Manpasand Bever.
Neutral
532
-
2,664
540
836
19.9
19.6
10.2
16.9
52.0
31.5
4.2
3.8
8.1
12.0
4.6
2.9
MRF
Buy
33,831
45,575
14,348
20,316
14,488
21.4
21.1
5,488.0
3,797.9
6.2
8.9
2.1
1.7
41.1
21.2
0.7
0.9
MT Educare
Neutral
169
-
671
286
366
18.3
17.7
7.7
9.4
21.8
18.0
4.6
4.0
20.2
21.1
2.2
1.7
Narayana Hrudaya
Neutral
289
-
5,902
1,603
1,873
10.9
11.5
1.0
2.6
303.2
109.2
7.3
6.7
2.4
6.1
3.8
3.2
Navkar Corporation
Buy
174
265
2,487
365
436
38.3
37.5
5.6
5.9
30.9
29.7
1.9
1.8
6.3
6.1
7.6
6.6
Navneet Education
Neutral
88
-
2,084
998
1,062
24.1
24.0
5.8
6.1
15.2
14.4
3.4
3.0
22.0
20.5
2.2
2.0
Nilkamal
Neutral
1,223
-
1,824
1,871
2,031
10.7
10.5
63.2
69.8
19.3
17.5
3.2
2.7
17.6
16.6
1.0
0.9
Page Industries
Neutral
12,566
-
14,016
1,929
2,450
19.8
20.1
229.9
299.0
54.7
42.0
24.1
16.8
52.1
47.0
7.3
5.7
Quick Heal
Neutral
267
-
1,869
339
408
27.8
27.3
7.1
7.7
37.7
34.5
3.2
3.2
8.5
9.3
4.4
3.7
Radico Khaitan
Buy
89
156
1,188
1,517
1,635
12.7
13.4
5.8
7.1
15.3
12.6
1.3
1.2
8.6
9.6
1.3
1.2
Relaxo Footwears
Neutral
492
-
5,907
1,767
2,152
12.3
12.5
19.2
25.1
25.6
19.6
6.3
4.8
27.7
27.8
3.4
2.8
S H Kelkar & Co.
Neutral
224
-
3,242
928
1,036
15.3
15.1
4.9
6.1
45.4
36.7
4.2
3.9
9.4
10.7
3.4
3.0
Siyaram Silk Mills
Buy
1,080
1,354
1,013
1,636
1,815
11.5
11.5
89.9
104.1
12.0
10.4
2.0
1.7
17.9
17.8
0.8
0.7
Styrolution ABS India*
Neutral
612
-
1,077
1,271
1,440
8.6
9.2
32.0
41.1
19.1
14.9
2.0
1.7
10.7
12.4
0.8
0.7
Surya Roshni
Buy
147
201
643
2,992
3,223
8.1
8.4
14.7
18.3
10.0
8.0
0.9
0.8
9.7
11.0
0.5
0.5
Team Lease Serv.
Neutral
926
-
1,584
2,565
3,229
1.3
1.5
15.2
22.8
61.0
40.7
4.9
4.4
8.0
10.7
0.5
0.4
The Byke Hospitality
Neutral
154
-
616
222
287
20.5
20.5
5.6
7.6
27.3
20.3
5.1
4.2
18.8
20.7
2.8
2.2
Transport Corp. of India
Neutral
263
-
1,998
2,830
3,350
8.8
9.0
14.4
18.3
18.3
14.3
2.8
2.4
15.4
17.1
0.8
0.7
TVS Srichakra
Buy
2,354
3,217
1,803
2,035
2,252
15.9
15.3
248.6
268.1
9.5
8.8
4.1
3.0
43.6
33.9
0.9
0.8
UFO Moviez
Neutral
519
-
1,427
558
619
32.0
33.2
22.5
30.0
23.0
17.3
2.8
2.4
12.0
13.8
2.4
2.0
Visaka Industries
Buy
119
143
189
1,020
1,120
8.7
9.1
13.9
20.1
8.5
5.9
0.5
0.5
6.4
8.7
0.4
0.4
VRL Logistics
Neutral
393
-
3,588
1,725
1,902
16.5
16.7
12.2
14.6
32.3
27.0
6.7
5.9
20.8
21.9
2.2
2.0
Wonderla Holidays
Neutral
388
-
2,194
206
308
44.0
43.6
9.0
12.9
43.1
30.1
5.9
5.3
13.7
17.8
10.5
7.0
Source: Company, Angel Research, Note: *December year end; #September year end;
&October year end; ^June year end; Price as of May 5, 2016
May 6, 2016
23
Top Picks Report | May 2016
Research Team Tel: 022 - 39357800
DISCLAIMER
Angel Broking Private Limited (hereinafter referred to as “Angel”) is a registered Member of National Stock Exchange of India Limited,
Bombay Stock Exchange Limited and Metropolitan Stock Exchange of India Limited. It is also registered as a Depository Participant with
CDSL and Portfolio Manager with SEBI. It also has registration with AMFI as a Mutual Fund Distributor. Angel Broking Private Limited is
a registered entity with SEBI for Research Analyst in terms of SEBI (Research Analyst) Regulations, 2014 vide registration number
INH000000164. Angel or its associates has not been debarred/ suspended by SEBI or any other regulatory authority for accessing
/dealing in securities Market. Angel or its associates including its relatives/analyst do not hold any financial interest/beneficial
ownership of more than 1% in the company covered by Analyst. Angel or its associates/analyst has not received any compensation /
managed or co-managed public offering of securities of the company covered by Analyst during the past twelve months. Angel/analyst
has not served as an officer, director or employee of company covered by Analyst and has not been engaged in market making activity
of the company covered by Analyst.
This document is solely for the personal information of the recipient, and must not be singularly used as the basis of any investment
decision. Nothing in this document should be construed as investment or financial advice. Each recipient of this document should
make such investigations as they deem necessary to arrive at an independent evaluation of an investment in the securities of the
companies referred to in this document (including the merits and risks involved), and should consult their own advisors to determine
the merits and risks of such an investment.
Reports based on technical and derivative analysis center on studying charts of a stock's price movement, outstanding positions and
trading volume, as opposed to focusing on a company's fundamentals and, as such, may not match with a report on a company's
fundamentals.
The information in this document has been printed on the basis of publicly available information, internal data and other reliable
sources believed to be true, but we do not represent that it is accurate or complete and it should not be relied on as such, as this
document is for general guidance only. Angel Broking Pvt. Limited or any of its affiliates/ group companies shall not be in any way
responsible for any loss or damage that may arise to any person from any inadvertent error in the information contained in this report.
Angel Broking Pvt. Limited has not independently verified all the information contained within this document. Accordingly, we cannot
testify, nor make any representation or warranty, express or implied, to the accuracy, contents or data contained within this document.
While Angel Broking Pvt. Limited endeavors to update on a reasonable basis the information discussed in this material, there may be
regulatory, compliance, or other reasons that prevent us from doing so.
This document is being supplied to you solely for your information, and its contents, information or data may not be reproduced,
redistributed or passed on, directly or indirectly.
Neither Angel Broking Pvt. Limited, nor its directors, employees or affiliates shall be liable for any loss or damage that may arise from
or in connection with the use of this information.
Note: Please refer to the important ‘Stock Holding Disclosure' report on the Angel website (Research Section). Also, please refer to the
latest update on respective stocks for the disclosure status in respect of those stocks. Angel Broking Pvt. Limited and its affiliates may
have investment positions in the stocks recommended in this report.
May 5, 2016
24