Angel Top Picks - July 2016
Angel Top Picks - July 2016
The Indian equity market has shown good strength, with it having recovered from
The strength in the recovery post
the recent correction which was in the wake of global sell-off caused by Britain’s
BREXIT clearly indicates that India is in
surprise vote to exit the EU in the referendum election a.k.a. the BREXIT. The
a far favorable situation vis-a-vis other
strength in the recovery clearly indicates that India is in a favorable situation vis-a-
global markets, especially emerging
markets.
vis other countries, especially other emerging markets.
Positive sentiments in favor of India’s prospects stem from an expected
Positive sentiments in favour of India’s
improvement in corporate earnings over FY2016-17. The improvement is
prospects
stem
from
expected
expected to be driven by higher consumption as well as higher government
improvement in corporate earnings over
spends on infrastructure and rural economy, with the latter expected to further
FY2016-17.
benefit from an above-normal monsoon this year which is widely anticipated.
The monsoon which started late this year was lagging initially but has caught up
pace in the last few weeks. The turnaround seen in the last few weeks has resulted
in cumulative rainfall till date turning into surplus of 1.3% over long period
average and in comparison to 11.1% deficit witnessed initially. The predicted
above normal monsoon will ensure adequate crop production and hence food
inflation will remain under check which will provide relief to the already stressed
rural economy. Two consecutive years of drought like situation had resulted in
depressed rural consumption which should bounce back this year.
In addition to this, implementation of the Seventh Pay Commission will result in
higher disposable incomes in the hands of consumers which backs our
constructive opinion about the consumption theme of India.
Implementation of the Seventh Pay
Our top-picks are focused on companies that will benefit from this trend of strong
Commission will result in higher
consumption and government spending on infrastructure. Our consumption
disposable incomes in the hands of
based plays include Blue Star, Voltas, Bajaj Electricals, Siyaram Silk Mills and
consumers and hence we remain
Radico Khaitan. We have added Goodyear India in our top picks as it is a likely
constructive about the consumption
beneficiary of a good monsoon due to its large presence in the tractor tyre
theme of India.
segment. Our picks that will benefit from higher government focus to lower
borrowing costs include LIC Housing Finance, Equitas Holdings, Dewan Housing
Finance, Mahindra Lifespace, NBCC and IL&FS Transportation Networks.
Large Cap
EPS
PER
EV/Sales
ROE
Company
Sector
Rating
CMP (`) Target (`) Upside (%) FY17E FY18E FY17E FY18E FY17E FY18E FY17E FY18E
Amara Raja
Auto Ancill.
Buy
837
1,076
28.6
35.3
43.5
23.7
19.3
2.6
2.1
25.9
26.0
BEL
Capital Goods
Buy
1,171
1,414
20.8
58.7
62.4
19.9
18.8
2.5
2.3
*44.6
*46.3
HCL Tech
IT
Buy
717
1,000
39.5
55.7
64.1
12.9
11.2
1.6
1.1
20.3
17.9
HDFC Bank
Financials
Accumulate
1,185
1,262
6.5
61.4
78.3
19.3
15.1
-
-
18.5
21.7
Infosys
IT
Buy
1,157
1,374
18.6
65.3
72.5
17.7
15.9
3.2
2.8
22.2
22.4
LIC Housing Fin.Financials
Buy
498
592
18.8
40.6
47.8
12.3
10.4
-
-
20.7
20.5
NBCC
Construction
Accumulate
215
242
12.6
8.2
11.0
26.2
19.5
1.4
1.0
28.2
28.7
Voltas
Capital Goods
Buy
315
407
29.2
12.9
16.3
24.4
19.3
1.7
1.5
16.7
18.5
Source: Angel Research; *Note- Adj. RoEs
Please refer to important disclosures at the end of this report
1
Top Picks Report | July 2016
Mid Cap
EPS
PER
EV/Sales
ROE
Company
Sector
Rating
CMP (`) Target (`) Upside (%) FY17E FY18E FY17E FY18E FY17E FY18E FY17E FY18E
Bajaj Electricals
Cons. Durable Accumulate
248
268
7.9
12.4
15.7
20.1
15.8
0.5
0.4
14.4
16.1
Blue Star
Cons. Durable Accumulate
435
495
13.7
17.2
20.6
25.4
21.1
0.9
0.8
23.1
24.1
Dewan Housing Financials
Buy
212
270
27.4
29.7
34.6
7.1
6.1
-
-
16.1
16.8
Equitas Holdings Financials
Buy
185
235
27.0
6.7
9.4
27.6
19.7
-
-
12.4
12.9
Goodyear India Tyre
Buy
526
631
20.1
49.4
52.6
10.6
10.0
0.4
0.4
18.2
17.0
IL&FS Transport. Infra
Accumulate
82
93
14.1
8.6
5.6
9.5
14.6
3.5
3.4
2.5
2.2
Jagran Prakashan Media
Accumulate
183
205
12.0
10.8
12.5
16.9
14.6
2.6
2.2
21.7
21.7
Mahindra LifespaceReal Estate
Buy
466
554
18.9
30.7
36.3
15.2
12.8
3.1
2.1
7.4
8.5
Navkar Corp.
Logistics
Buy
214
265
23.6
6.8
11.5
31.6
18.6
8.4
5.6
6.9
10.5
Radico Khaitan
Breweries & Dist.
Buy
95
125
32.0
6.3
7.4
15.0
12.9
1.2
1.1
8.6
9.3
Siyaram Silk Mills Textile
Buy
1,080
1,347
24.7
104.9
122.4
10.3
8.8
0.8
0.7
16.4
16.4
Source: Angel Research
July 8, 2016
2
Top Picks Report | July 2016
Top Picks - Large Cap
July 8, 2016
3
Top Picks Report | July 2016
Stock Info
Amara Raja Batteries
CMP
837
Amara Raja Batteries Ltd (ARBL) is the second largest lead acid storage battery
TP
1,076
manufacturer in the country. ARBL has been outpacing market leader Exide
Upside
28.6%
(ARBL grew at a 24% CAGR over FY2010-15 as compared to Exide's growth of
13%), leading to its market share improving from 25% in FY10 to about 35%
Sector
Auto Ancillary
currently. ARBL's outperformance has been mainly on back of its association
Market Cap (` cr)
14,293
with global battery leader Johnson Controls Inc (which also holds 26% stake in
Beta
0.831
ARBL) for manufacturing ducts.
52 Week High / Low
1,132 / 773
With the automotive OEMs following a policy of having multiple vendors and
with ARBL’s products enjoying a strong brand recall in the replacement
segment, the company is well poised to gain further market share. Given the
3 year-Chart
economic recovery and market share gains, the company is expected to grow at
a CAGR of 18% over the next two years as against industry growth of 10-12%.
1,200
1,000
ARBL is a well diversified auto ancillary player having presence across the
automotive and the industrial segment and a broad OEM as well as
800
replacement customer base. We believe ARBL is a high quality stock to play
600
the auto sector revival. We maintain our Buy rating on the stock.
400
200
Key Financials
-
Y/E
Sales
OPM PAT EPS ROE P/E P/BV EV/EBITDA EV/Sales
March
(` cr)
(%)
(` cr)
(`)
(%)
(x)
(x)
(x)
(x)
FY2017E
5,429
17.5
604
35.3
25.9
23.7
5.6
14.8
2.6
Source: Company, Angel Research
FY2018E
6,471
17.6
742
43.5
26.0
19.3
4.6
12.1
2.1
Source: Company, Angel Research
Stock Info
Bharat Electronics (BEL)
CMP
1,171
High priority to the defense sector in the government’s ‘Make in India’
TP
1,414
campaign, with (1) emphasis on indigenization, (2) increase in FDI limits from
26% to 49%, and (3) Over $50bn worth of projects cleared by Defense
Upside
20.8%
Acquisition Council (DAC) in the last 25 months, indicate at the sector being at
Sector
Capital Goods
an inflexion point where Indian defense capex cycle is entering a new era of
Market Cap (` cr)
30,241
growth. The current bid pipeline could lead to strong award activity for the
next few years and BEL could emerge as a beneficiary.
Beta
1.1
BEL in FY2016 had ~35% market share in the defense electronics space.
52 Week High / Low
1,417 / 983
Considering (1) bid-pipeline of Indian Air Force and Navy’s platform projects,
which have high defense electronic component, (2) BEL’s in-house R&D
capabilities, and (3) its zero debt status, we believe that BEL would maintain its
3 year-Chart
strong market positioning in the defense electronics space.
1,600
1,400
We expect BEL to trade at a premium to its historical valuations on account of
1,200
uptick in investment cycle. Current low competitive intensity which should
1,000
enable BEL to justifiably command scarcity premium, coupled with the fact that
800
the company is the largest listed defense player, makes the stock more
600
attractive. We maintain BUY rating on the stock with price target of `1,414.
400
200
Key Financials
-
Y/E
Sales
OPM PAT EPS Adj. ROE P/E P/BV EV/EBITDA EV/Sales
March
(` cr)
(%)
(` cr)
(`)
(%)
(x)
(x)
(x)
(x)
FY2017E
8,137
16.8
1,410
58.7
44.6
20.0
2.7
16.4
2.5
Source: Company, Angel Research
FY2018E
9,169
17.2
1,499
62.4
46.3
18.8
2.6
14.8
2.3
Source: Company, Angel Research
July 8, 2016
4
Top Picks Report | July 2016
Stock Info
HCL Technologies
CMP
717
Healthy pipeline: The company’s engineering services has been seeing lumpy
TP
1,000
growth over the last few quarters. This is however largely a function of the
Upside
39.5%
timing of large transformational deals. 6-8 of the large deals signed a few
Sector
IT
quarters ago will aid the company to continue to post industry leading growth.
We expect HCL Tech to post a USD and INR revenue CAGR of 16.3% and
Market Cap (` cr)
1,01,151
18.0%, respectively, over FY2016-18E (inclusive of the acquisition of
Beta
0.8
Geometric Software and the Volvo deal).
52 Week High / Low
1,005 / 707
Robust outlook: HCL Tech signed 7 transformational deals during the quarter
with TCV of more than US$2bn, taking the number of transformational
engagements during the nine month financial year to 25 with TCV of more
3 year-Chart
than US$4bn. These wins were broad-based across service lines and industry
1200
verticals, led by the company’s Next-generation offerings - BEYONDigital, IoT
1000
WoRKS and Next-Gen ITO.
800
Outlook and Valuations: The stock is attractively valued at the current market
600
price and hence we maintain our Buy with a price target of `1,000.
400
Key Financials
200
Y/E
Sales
OPM PAT EPS ROE P/E P/BV EV/EBITDA EV/Sales
0
June
(`cr)
(%)
(`cr)
(`)
(%)
(x)
(x)
(x)
(x)
FY2017E
49,242
20.5
7,862
55.7
20.3
12.9
2.6
7.6
1.6
FY2018E
57,168
20.5
9,037
64.1
17.9
11.2
2.0
5.6
1.1
Source: Company, Angel Research
Source: Company, Angel Research
Stock Info
HDFC Bank
CMP
1,185
Strong capital adequacy will enable continued growth going ahead: HDFC
TP
1,262
Bank continued to report strong loan growth of 27% yoy and with capital
Upside
6.5%
adequacy ratio of 15.5% at the end of 4QFY2016, the bank has enough
Sector
Financials
scope to continue to grow its loan book and increase its market share.
Market Cap (` cr)
3,00,074
Asset quality rock-solid: The bank has been able to maintain its asset quality
Beta
0.8
consistently. Asset quality continued to remain healthy with the Gross NPA
52 Week High / Low
1,195 / 929
ratio and the Net NPA ratio at 0.94% and 0.28%, respectively, as of
4QFY2016, in a challenging macro environment.
Outlook: Credit and deposit growth beat the industry growth rate, driven by
3 year-Chart
strong retail business, healthy CASA and continued network expansion. This
1,400
1,200
provides strong visibility for a robust 20% earnings trajectory, coupled with
1,000
high quality of earnings. This in our view justifies a premium valuation
800
multiple. At the current market price, the bank is trading at 3.0x its FY2018E
600
ABV. We recommend an Accumulate rating on the stock, with a target price of
400
`1,262.
200
-
Key Financials
Y/E
Op. Inc NIM
PAT
EPS
ABV ROA ROE P/E P/ABV
March
(` cr)
(%)
(` cr)
(`)
(`)
(%)
(%)
(x)
(x)
Source: Company, Angel Research
FY2017E
47,696
4.5
15,514
61.4
330.3
2.0
18.5
19.3
3.6
FY2018E
58,038
4.5
19,790
78.3
391.5
2.0
21.7
15.1
3.0
Source: Company, Angel Research
July 8, 2016
5
Top Picks Report | July 2016
Stock Info
Infosys
CMP
1,157
Strong revenue guidance for FY2017: The Management has guided towards
TP
1,374
higher revenue growth for FY2017, ie of 11.5-13.5% in CC terms and 12.7-
Upside
18.8%
14.7% in INR terms (exchange rate as on March 31, 2016). For FY2016, the
Sector
IT
company posted a 13.3% growth in CC terms V/s a guidance of 12.8-13.2%
growth (in CC). We expect the company to post ~13.0% USD revenue growth
Market Cap (` cr)
2,65,802
in FY2017.
Beta
0.8
Aims to be US$20bn company by FY2020: The company expects its revenue
52 Week High / Low
1,278 / 933
to rise to US$20bn by FY2020, up from US$8.7bn in FY2015, as it focuses on
acquisitions and winning more new technology services, implying a
14%
CAGR over the period. Over the near term, we expect Infosys to post a 13.0%
3 year-Chart
USD revenue growth in FY2017. Over FY2016-18E, we expect USD and INR
1400
revenue to grow at a CAGR of 13.0% and 13.0%, respectively.
1200
Outlook and Valuations: The stock trades at a valuation of 15.9x FY2018E
1000
earnings. We recommend Buy on the stock with a price target of `1,374.
800
Key Financials
600
Y/E
Sales
OPM PAT EPS ROE P/E P/BV EV/EBITDA EV/Sales
400
March
(` cr)
(%)
(` cr)
(`)
(%)
(x)
(x)
(x)
(x)
FY2017E
70,558
27.5
14,999
65.3
22.2
17.7
3.9
11.7
3.2
FY2018E
79,731
27.5
16,657
72.5
22.4
15.9
3.6
10.2
2.8
Source: Company, Angel Research
Source: Company, Angel Research
Stock Info
LIC Housing Finance
CMP
498
Significant under penetration of mortgages in India: India is expected to
TP
592
witness a robust housing finance growth going forward as the mortgage
Upside
18.8%
penetration in India remains at very low levels at 9% to GDP as compared to
Sector
Financials
the developed countries where it is in the range of 60-100%.
Market Cap (` cr)
25,117
NIM expansion visible: LICHF is able to raise funds from low-cost NCDs due
Beta
1.4
to its strong AAA credit rating and backing by strong promoters like LIC. In a
declining interest rate environment, NBFC's like LICHF are well-placed to
52 Week High / Low
526 / 389
witness margin improvement in our view.
Outlook: For companies like LICHF, the funding environment has eased; thus
3 year-Chart
it will lead to lower cost of borrowing, while outlook for growth in retail
600
housing loans remains positive, going forward. We expect the company to
500
post a healthy loan book CAGR of 19% over FY2016-18E, which is likely to
400
reflect in earnings CAGR of 21.0%, over the same period. The stock currently
300
trades at 2.3x FY2018E ABV. We maintain our Buy rating on the stock, with a
target price of `592.
200
100
Key Financials
-
Y/E
Op. Inc NIM
PAT
EPS
ABV ROA ROE P/E P/ABV
March
(` cr)
(%)
(` cr)
(`)
(`)
(%)
(%)
(x)
(x)
FY2017E
3,758
2.6
2,052
40.6
209.9
1.5
20.7
12.3
2.2
Source: Company, Angel Research
FY2018E
4,448
2.6
2,415
47.8
247.0
1.5
20.5
1.9
Source: Company, Angel Research
July 8, 2016
6
Top Picks Report | July 2016
Stock Info
National Buildings Construction Corporation (NBCC)
CMP
215
NBCC reported an order book of over
`37,000cr at 4QFY2016-end.
TP
242
Considering the bid pipeline for re-development works from Delhi and other
Upside
12.6%
state governments, and with ‘Smart City’ projects to take-off shortly, we expect
NBCC’s order-book to grow 1.6x during FY2016-18E to `59,710cr.
Sector
Construction
We expect NBCC to report 27.9% revenue CAGR during FY2016-18E (to
Market Cap (` cr)
13,242
`9,549cr), mainly driven by 30.9% revenue CAGR from PMC segment, where
Beta
1.1
re-development projects would contribute the maximum. We expect NBCC to
52 Week High / Low
243/ 162
report 53.2% EBITDA CAGR during the same period, led by increased
contribution from PMC segment, which is likely to experience margin
expansion. Owing to lower other income growth assumption, we expect NBCC
3 year-Chart
to report 45.5% PAT CAGR during FY2016-18E to `659cr.
250
We have a strong positive view on NBCC, given its growth prospects as
200
reflected by its strong order book of `37,000cr (6.3x OB to LTM revenues).
Also, emerging opportunities in re-development space, government’s initiative of
150
developing ‘Smart Cities’, and the company’s cash rich status, should aid its growth.
100
On assigning 22.0x P/E multiple to our FY2018E EPS of `11.0/share, we arrive at a
price target of `242. Given the upside, we recommend Accumulate on the stock.
50
-
Key Financials
Y/E
Sales
OPM PAT EPS ROE P/E P/BV EV/EBITDA EV/Sales
March
(` cr)
(%)
(` cr)
(`)
(%)
(x)
(x)
(x)
(x)
Source: Company, Angel Research
FY2017E
7,428
7.9
490
8.2
28.2
23.9
6.0
17.1
1.3
FY2018E
9,549
8.6
659
11.0
28.7
17.8
5.1
11.7
0.9
Source: Company, Angel Research
Stock Info
Voltas
CMP
315
Growth in UCP segment to continue: Voltas has maintained 20%+ market
TP
407
share in domestic air-conditioning market despite stiff competition from MNC
Upside
29.2%
players. With economic indicators turning favorable, the company’s
competitive positioning should help its UCP segment to report a 19.5% top-
Sector
Construction & Eng.
line and 16.6% EBIT CAGR, respectively, during FY2016-18E.
Market Cap (` cr)
11,058
Gradual recovery in EMP business: In the run-up to the Qatar World Cup
Beta
1.4
2022 and Dubai Expo 2020, we expect international awarding activity to
52 Week High / Low
349/ 211
catch-up from FY2017E onwards. Surge in order book should translate to
uptick in execution (10.7% top-line CAGR during FY2016-18E). With legacy
projects completed and contribution of high margin projects kicking-in, we
3 year-Chart
expect segment margins to expand from 1.4% in FY2016 to 5.0% in FY2018E.
400
Strong growth Outlook: On the back of strong 13.3% top-line and 18.1%
350
bottom-line CAGR during FY2016-18E, we expect Voltas to report strong
300
16.7%/18.5% RoE for FY2017/18E, respectively. Considering the positive cues,
250
200
case for improvement in business segments’ performances and growth potential, we
150
expect improved profitability and better investment return ratios, going forward. We
100
assign 25.0x PE multiple to our FY2018E EPS estimate of `16.3/share and arrive at
50
a price target of `407. Given the upside, we recommend Buy on the stock.
-
Key Financials
Y/E
Sales
OPM PAT EPS ROE P/E P/BV EV/EBITDA EV/Sales
March
(` cr)
(%)
(` cr)
(`)
(%)
(x)
(x)
(x)
(x)
Source: Company, Angel Research
FY2017E
6,511
7.9
427
12.9
16.7
24.4
4.0
21.4
1.7
FY2018E
7,514
8.7
538
16.3
18.5
19.3
3.5
16.8
1.5
Source: Company, Angel Research
July 8, 2016
7
Top Picks Report | July 2016
Top Picks - Mid Cap
July 8, 2016
8
Top Picks Report | July 2016
Stock Info
Bajaj Electricals
CMP
248
The company is among the top 4 players in the consumer durables space
TP
268
across all its product categories (leader in small appliances; number-4 in fans
Upside
7.9`%
and lighting). It has a strong distribution reach with 4,000 distributors
Sector
Cons. Durable
reaching out to 400,000 retailers.
Market Cap (` cr)
2,504
In the 3 years preceding FY2016, the company’s E&P segment had been
Beta
0.9
underperforming owing to cost overruns and delays in project executions.
However, the segment has turned around in FY2016 on the profitability front
52 Week High / Low
300 / 155
and delivered a healthy EBIT margin of ~6% for the year. Currently the
segment’s order book stands at `2,480cr.
3 year-Chart
With expectation of timely execution of new projects in the E&P segment and
400
350
with the Lighting and Consumer Durables segments expected to benefit from
300
an improvement in consumer sentiments going forward, we expect the
250
company’s top-line to grow at a CAGR of ~15% to `6,098cr and bottom-line
200
to grow at a CAGR of 29% to `159cr over FY2016-FY2018E. We recommend
150
a Buy rating on the stock.
100
50
Key Financials
0
Y/E
Sales OPM PAT EPS ROE P/E P/BV EV/EBITDA EV/Sales
March
(` cr)
(%)
(` cr)
(`)
(%)
(x)
(x)
(x)
(x)
FY2017E
5,351
5.6
125
12.4
14.4
20.1
2.9
8.5
0.5
Source: Company, Angel Research
FY2018E
6,098
5.9
159
15.7
16.1
15.8
2.5
7.2
0.4
Source: Company, Angel Research
Stock Info
Blue Star
CMP
435
BSL is one of the largest air-conditioning companies in India. With a mere
TP
495
3% penetration level of ACs vs 25% in China, the overall outlook for the room
Upside
13.7%
air-conditioner (RAC) market in India is favourable.
Sector
Cons. Durable
BSL’s RAC business has been outgrowing the industry by ~10% points over the
Market Cap (` cr)
3,918
last few quarters, resulting in the company consistently increasing its market
share (~7% in FY2014 to 10.5% at present). This has resulted in the Cooling
Beta
0.6
Products Division (CPD)'s share in overall revenues increasing from~23% in
52 Week High / Low
449 / 306
FY2010 to ~42% in FY2016 (expected to improve to ~47% in FY2018E). With
180
strong brand equity and higher share in split ACs, we expect the CPD to
3 year-Chart
continue to drive growth.
500
Aided by increasing contribution from the CPD, we expect the overall top-line
400
to post a revenue CAGR of ~15% over FY2016-18E and margins to improve
from 5.7% in FY2015 to 7.1% in FY2018E. Moreover, the merger with Blue
300
Star Infotech has infused cash and strengthened the balance sheet. We have
200
an Accumulate recommendation on the stock.
100
Key Financials
-
Y/E
Sales OPM PAT EPS ROE P/E P/BV EV/EBITDA EV/Sales
March
(` cr)
(%)
(` cr)
(`)
(%)
(x)
(x)
(x)
(x)
FY2017E
4,351
6.4
164
17.2
23.1
25.4
5.5
14.7
0.9
Source: Company, Angel Research
FY2018E
5,024
7.1
197
20.6
24.1
21.1
4.7
11.5
0.8
Source: Company, Angel Research
July 8, 2016
9
Top Picks Report | July 2016
Stock Info
Dewan Housing Finance
CMP
212
3rd largest private sector housing finance company: We expect DHFL’s AUM to
TP
270
grow at a CAGR of 21% over FY2016-18, as demand for housing in the
Upside
27.4%
middle & low income group picks up, while PAT CAGR is expected to be 22%
Seasoned and granular loan book with stable asset quality: Individual
Sector
Financials
borrowers account for 72%, while the high yielding loan against property
Market Cap (` cr)
6,200
(LAP+SME) and projects loans account for 19% and 9% of advances respectively.
Beta
1.6
Despite strong loan growth, the GNPAs and NNPAs are likely to be at ~1.17% and
52 Week High / Low
268 / 141
0.82%, respectively, for FY2017. We don’t expect any major deterioration in the
asset quality going ahead.
Lower cost of funds will help maintain NIM: Nearly 70% of the bank
3 year-Chart
borrowings are due for maturity over the next three years and swapping a part
300
of that with non-convertible debentures (NCDs), where it has ~100bp cost
250
benefit, will help DHFL in maintaining its NIM at ~2.9%.
200
Outlook: We expect the company to post a healthy loan book CAGR of 21%
over FY2015-18E, which is likely to translate in an earnings CAGR of 22%,
150
over the same period. The stock currently trades at 0.9x FY2018E ABV. We
100
recommend a Buy on the stock, with a target price of `270.
50
-
Key Financials
Y/E
Op. Inc NIM
PAT
EPS
ABV ROA ROE P/E P/ABV
March
(` cr)
(%)
(` cr)
(`)
(`)
(%)
(%)
(x)
(x)
Source: Company, Angel Research
FY2017E
2,225
2.9
866
29.7
184.0
1.1
16.1
7.1
1.2
FY2018E
2,688
2.9
1,084
34.6
215.3
1.2
16.8
6.1
1.0
Source: Company, Angel Research
Stock Info
Equitas Holdings
CMP
185
Early mover advantage in the SFB category: Equitas was one of the ten NBFCs
TP
235
to get the license to start a small finance bank (SFB). As the entire book of
Upside
27.0%
Equitas qualifies for PSL, meeting the 75% PSL target will not be a challenge.
Sizeable and diversified loan book will keep it ahead of other upcoming SFBs.
Sector
Financials
Asset quality and return ratios are likely to remain stable: Equitas will have to
Market Cap (` cr)
6,221
maintain CRR & SLR going ahead; hence yield on total assets is likely to come
Beta
0.9
down. However, as a bank it will be able to raise deposits and hence there will
52 Week High / Low
194 / 134
be reduction in cost of funds. As a result, spreads may not decline much which
in turn will help in maintaining the ROE & ROA which although could undergo
3 year-Chart
a marginal decline. Also we don’t expect any major deterioration in the asset
220
quality going ahead.
200
NIM likely to remain healthy : Equitas will be able to take deposits after it
formally starts banking operations leading to ~250bp reduction in cost of
180
funds. Hence we expect the NIM to remain strong at ~11%, going ahead.
160
Outlook: We expect the company to post a strong loan book & earnings
140
CAGR of 38% & 37% over FY2016-18E. The stock currently trades at 2.2x
120
FY2018E BV. We recommend a Buy on the stock, with a target price of `235.
100
Key Financials
Y/E
Op. Inc NIM
PAT
EPS
ABV ROA ROE P/E P/ABV
March
(` cr)
(%)
(` cr)
(`)
(`)
(%)
(%)
(x)
(x)
Source: Company, Angel Research
FY2017E
1,076
11.7
224
6.7
68.2
2.8
12.4
27.6
2.7
FY2018E
1,465
11.4
315
9.4
77.6
2.8
12.9
19.7
2.3
Source: Company, Angel Research
July 8, 2016
10
Top Picks Report | July 2016
Stock Info
IL&FS Transportation Networks
CMP
82
ITNL reported Commercial Operations Date (CoD) for JSEL and PSRDCL. Also,
TP
93
Completion certificate was issued for BKEL. TRDCL P-III and CNTL are
Upside
14.1%
expected to commence in the next few months. Further, RIDCRO P-III, KSEL,
Sector
Construction
KNEL, and BAEL are expected to commence operations in the next 9-12
months. Accordingly, we expect revenue from these projects to increase by
Market Cap (` cr)
2,755
~`4cr/day (unadj. for stake).
Beta
1.0
Strategic initiatives like stake sale at SPV level, listing of operational BOT
52 Week High / Low
152/64
projects under InvITs, and re-financing of BOT projects should help the
company unlock value. Money raised from these initiatives could be used to
3 year-Chart
lower debt and improve the profitability.
300
With 7 projects expected to commence in the next 12 months, we expect the
250
debt repayment cycle at SPV level to commence, resulting in the overall consol.
200
D/E levels peaking out at ~4.0x. With concerns over higher D/E levels allayed
150
to a certain extent, coupled with the attractive valuations of 0.3x FY2017E
100
P/BV multiple that the ITNL stock is trading at, we maintain our Buy on the
50
stock with price target of `93.
-
Key Financials
Y/E
Sales
OPM PAT EPS ROE P/E P/BV EV/EBITDA EV/Sales
March
(` cr)
(%)
(` cr)
(`)
(%)
(x)
(x)
(x)
(x)
Source: Company, Angel Research
FY2017E
8,682
32.2
285
8.6
2.5
9.5
0.3
11.6
3.5
FY2018E
10,135
33.3
185
5.6
2.2
14.6
0.3
11.2
3.4
Source: Company, Angel Research
Stock Info
Goodyear India
CMP
526
Normal monsoon to energize stagnant tractor demand: Goodyear India (GIL)
TP
631
is a leader in the tractor tyre segment in India with tractor tyres accounting for
Upside
20.1%
~50% of its overall revenues. GIL’s performance on the top-line front has
been under pressure on account of below par monsoon over the past two
Sector
Tyres
years. As tractor sales have strong correlation with monsoons, the normal
Market Cap (` cr)
1,213
monsoon this year should translate into a higher demand for tractor tyres.
Beta
0.6
Strong finances and Balance Sheet: GIL is a debt free-cash rich company with
52 Week High / Low
662 / 443
RoIC estimated at ~84% for FY2018. The company’s cash and equivalents
are `334cr for FY2016, which amount to ~28% of the current market cap.
3 year-Chart
Outlook and valuation: On an adjusted basis (for FY end March), we expect
800
the top-line to post a CAGR of 7.5% over FY2016-18E to `1,704cr mainly on
700
account of rebound in tractor tyre volumes and expect net profit to improve to
600
500
`121cr in FY2018E. At the current market price, the stock is trading at a PE of
400
10.0x its FY2018E earnings. We have a Buy rating on the stock and assign a
300
target price of `631 based on a target PE of 12.0x for FY2018E.
200
100
Key Financials
-
Y/E
Sales
OPM PAT EPS ROE P/E P/BV EV/EBITDA EV/Sales
March
(` cr)
(%)
(` cr)
(`)
(%)
(x)
(x)
(x)
(x)
FY2017E
1,598
10.4
114
49.4
18.2
10.6
1.8
4.2
0.4
Source: Company, Angel Research
FY2018E
1,704
10.2
121
52.6
17.0
10.0
1.6
3.5
0.4
Source: Company, Angel Research
July 8, 2016
11
Top Picks Report | July 2016
Stock Info
Jagran Prakashan
CMP
183
We expect JPL to register a net sales CAGR of ~12% over FY2016-18E, on
TP
205
back of (a) strong growth in advertising revenue due to improvement in GDP
growth, and (b) improvement in circulation revenue owing to combination of
Upside
12.0%
increase in cover price and volume growth.
Sector
Media
Further the acquisition of Radio City would also boost the company's revenue
Market Cap (` cr)
5,973
going ahead. Radio City has ~20 stations across 7 states in the country and is
second only to ENIL in all its operating circles, ie Delhi, Mumbai, Bengaluru,
Beta
0.6
Chennai, Ahmedabad, Hyderabad, Pune and Lucknow. The company covers
52 Week High / Low
189/110
~51% (~66mn people) of the total radio population.
Raw material prices have been in a declining trend. Thus, considering lower
3 year-Chart
news print costs, healthy sales, and higher margins in the radio business, we
expect an adj. net profit CAGR of ~12% over FY2016-18E to `409cr.
200
180
Considering Dainik Jagran's strong presence in the rapidly growing Hindi
160
markets, we expect JPL to benefit from an eventual recovery in the Indian
140
economy. Hence, we maintain an Accumulate rating on the stock with a target
120
100
price of stock with a target price of `205.
80
60
Key Financials
40
20
Y/E
Sales
OPM PAT EPS ROE P/E P/BV EV/EBITDA EV/Sales
0
March
(` cr)
(%)
(` cr)
(`)
(%)
(x)
(x)
(x)
(x)
FY2017E
2,355
28.0
353
10.8
21.7
16.9
3.7
9.1
2.6
FY2018E
2,635
28.0
409
12.5
21.7
14.6
3.2
8.0
2.2
Source: Company, Angel Research
Source: Company, Angel Research
Stock Info
Mahindra Lifespace
CMP
466
Speedy execution & speedier sales: MLF has 13 projects under implementation
TP
554
across cities. MLF has exhibited fast completion of projects (4-4.5 years in
Mumbai, other-wise 3-3.5 years across other cities), compared to others. Sales
Upside
18.9%
cycle in ~65% of projects is faster than execution cycle, contrary to industry
Sector
Real Estate
trends. This fast execution and sales is optimal, as it helps MLF in revenue
Market Cap (` cr)
1,792
recognition, inventory cycle (better than Oberoi, DLF), cash flows and
profitability. This translates in creating a virtuous cycle of continuous fast growth.
Beta
0.4
Strong revenue growth visibility in short-to-long run: MLF as of 4QFY2016 is
52 Week High / Low
559 / 401
pursuing ~4.0mn sq. ft. of sale of the total ~15.0mn sq. ft. of saleable area.
Having sold ~60% of ongoing projects, we expect MLF to launch ~2.8mn
3 year-Chart
sq.ft. of saleable area in rational way during 4QFY2016-2QFY2018E, across
700
6 cities. Maturity at existing projects, new launches give better revenue visibility
600
for medium-term. Further, MLF is sitting on land bank of 11.0mn sq.ft across
500
4 cities, which allays any concern over long-term revenue growth.
400
With Real Estate Regulatory Bill closer to realty, MLF should be minimally
300
impacted, given their strong parentage and ethically implemented processes.
200
In the longer-term organized, professionally run, well funded players would
100
enjoy strong trust due to reliable and fast execution strategies. With
-
improvement in company’s fundamentals, strong earnings growth visibility
and long-term growth outlook, at current valuations of 1.1x FY2017E P/BV,
MLF stock looks attractive. We maintain BUY on MLF with target price of `554.
Source: Company, Angel Research
Key Financials
Y/E
Sales
OPM PAT EPS ROE P/E P/BV EV/EBITDA EV/Sales
March
(` cr)
(%)
(` cr)
(`)
(%)
(x)
(x)
(x)
(x)
FY2017E
1,011
21.9
125
30.7
7.4
15.2
1.2
12.5
3.1
FY2018E
1,303
22.5
149
36.3
8.5
12.8
1.1
10.0
2.1
Source: Company, Angel Research
July 8, 2016
12
Top Picks Report | July 2016
Stock Info
Navkar
CMP
214
NCL is one of the largest and one of the three CFS at JNPT with rail
TP
265
connectivity, helping it garner high market share at the port. NCL is in a massive
Upside
23.6%
expansion mode where it is increasing its capacity by 234% to 1,036,889 TEUs
at JNPT and coming up with an ICD at Vapi (with Logistics Park).
Sector
Logistics
Market Cap (` cr)
3,051
The ICD with rail link should benefit from first mover advantage in a region
that has huge market potential and accounts for ~27% of volumes at JNPT.
Beta
0.6
The ICD should be able to capture the EXIM volumes from the region through
52 Week High / Low
224 / 151
rail link that till now was being custom cleared at JNPT (Import) or being
transported via road and consolidated at JNPT (Export). South Gujarat
3 year-Chart
volumes will now head straight to the Vapi ICD; thus the company can now
250
cater to bulk commodities and domestic traffic that it had been rejecting owing
to capacity constraints at CFS.
200
150
We expect NCL to successfully use its rail advantage and scale up its
utilizations at both JNPT and Vapi ICD. We have a Buy rating on the stock.
100
50
Key Financials
Y/E
Sales
OPM PAT EPS ROE P/E P/BV EV/EBITDA EV/Sales
0
March
(` cr)
(%)
(` cr)
(`)
(%)
(x)
(x)
(x)
(x)
FY2017E
408
42.9
97
6.8
6.9
31.6
2.2
19.5
8.4
FY2018E
612
42.3
164
11.5
10.5
18.6
2.0
13.2
5.6
Source: Company, Angel Research
Source: Company, Angel Research
Stock Info
Radico Khaitan
CMP
95
The IMFL segment is under penetrated. Going forward, increase in income
TP
125
levels would lead to higher growth in IMFL brands. RKL has strong brands in
Upside
32.0%
the premium liquor category which reported a CAGR of ~26% over the last
Sector
Breweries & Distilleries
seven-year period. We expect the growth momentum to continue.
Market Cap (` cr)
1,264
We expect the price of ENA, a key raw material, to remain stable and
Beta
0.8
potentially even decline going forward due to higher sugar production and
lower demand for ethanol from Indian oil marketing companies
52 Week High / Low
131/81
We expect a significant hike in liquor prices in the coming financial year as
3 year-Chart
there haven't been any significant ones in recent times. Also, we believe that
180
industry leader - United Spirits would shift focus on profitability over volume
160
growth considering the debt on its balance sheet, which in turn, would lead to
140
increased scope for other liquor companies to hike prices.
120
100
On valuation basis, Radico is trading at huge discount to its close peer United
80
Spirits. We have a Buy rating on the stock and target price of `125
60
40
(18x FY2018E EPS)
20
0
Key Financials
Y/E
Sales
OPM PAT EPS ROE P/E P/BV EV/EBITDA EV/Sales
March
(` cr)
(%)
(` cr)
(`)
(%)
(x)
(x)
(x)
(x)
Source: Company, Angel Research
FY2017E
1,659
13.0
84
6.3
8.6
15.0
1.3
9.2
1.2
FY2018E
1,802
13.2
98
7.4
9.3
12.9
1.2
8.2
1.1
Source: Company, Angel Research
July 8, 2016
13
Top Picks Report | July 2016
Stock Info
Siyaram Silk Mills
CMP
1,080
SSML has strong brands which cater to premium as well as popular mass
TP
1,347
segments of the market. Further, in FY2014, SSML entered the ladies' salwar
Upside
24.7%
kameez and ethnic wear segment. Going forward, we believe that the company
Sector
Textile
would be able to leverage its brand equity and continue to post strong performance.
Market Cap (` cr)
1,013
The company has a nationwide network of about 1,600 dealers and business
Beta
0.8
partners. It has a retail network of 160 stores and plans to add another 300-
350 stores going forward. Further, the company's brands are sold across
52 Week High / Low
1,400/896
3,00,000 multi brand outlets in the country.
Going forward, we expect SSML to report a net sales CAGR of ~12% to
3 year-Chart
~`2,040cr and adj.net profit CAGR of ~14% to `115cr over FY2016-18E on
1600
back of market leadership in blended fabrics, strong brand building, wide
1400
distribution channel, strong presence in tier II and tier III cities and emphasis
1200
on latest designs and affordable pricing points. At the current market price,
1000
SSML trades at an inexpensive valuation. We have a Buy rating on the stock
800
and target price of `1,347.
600
400
Key Financials
200
0
Y/E
Sales
OPM PAT EPS ROE P/E P/BV EV/EBITDA EV/Sales
March
(` cr)
(%)
(` cr)
(`)
(%)
(x)
(x)
(x)
(x)
FY2017E
1,799
11.6
98
104.9
16.4
10.3
1.7
6.5
0.8
FY2018E
2,040
11.7
115
122.4
16.4
8.8
1.4
5.7
0.7
Source: Company, Angel Research
Source: Company, Angel Research
July 8, 2016
14
Top Picks Report | July 2016
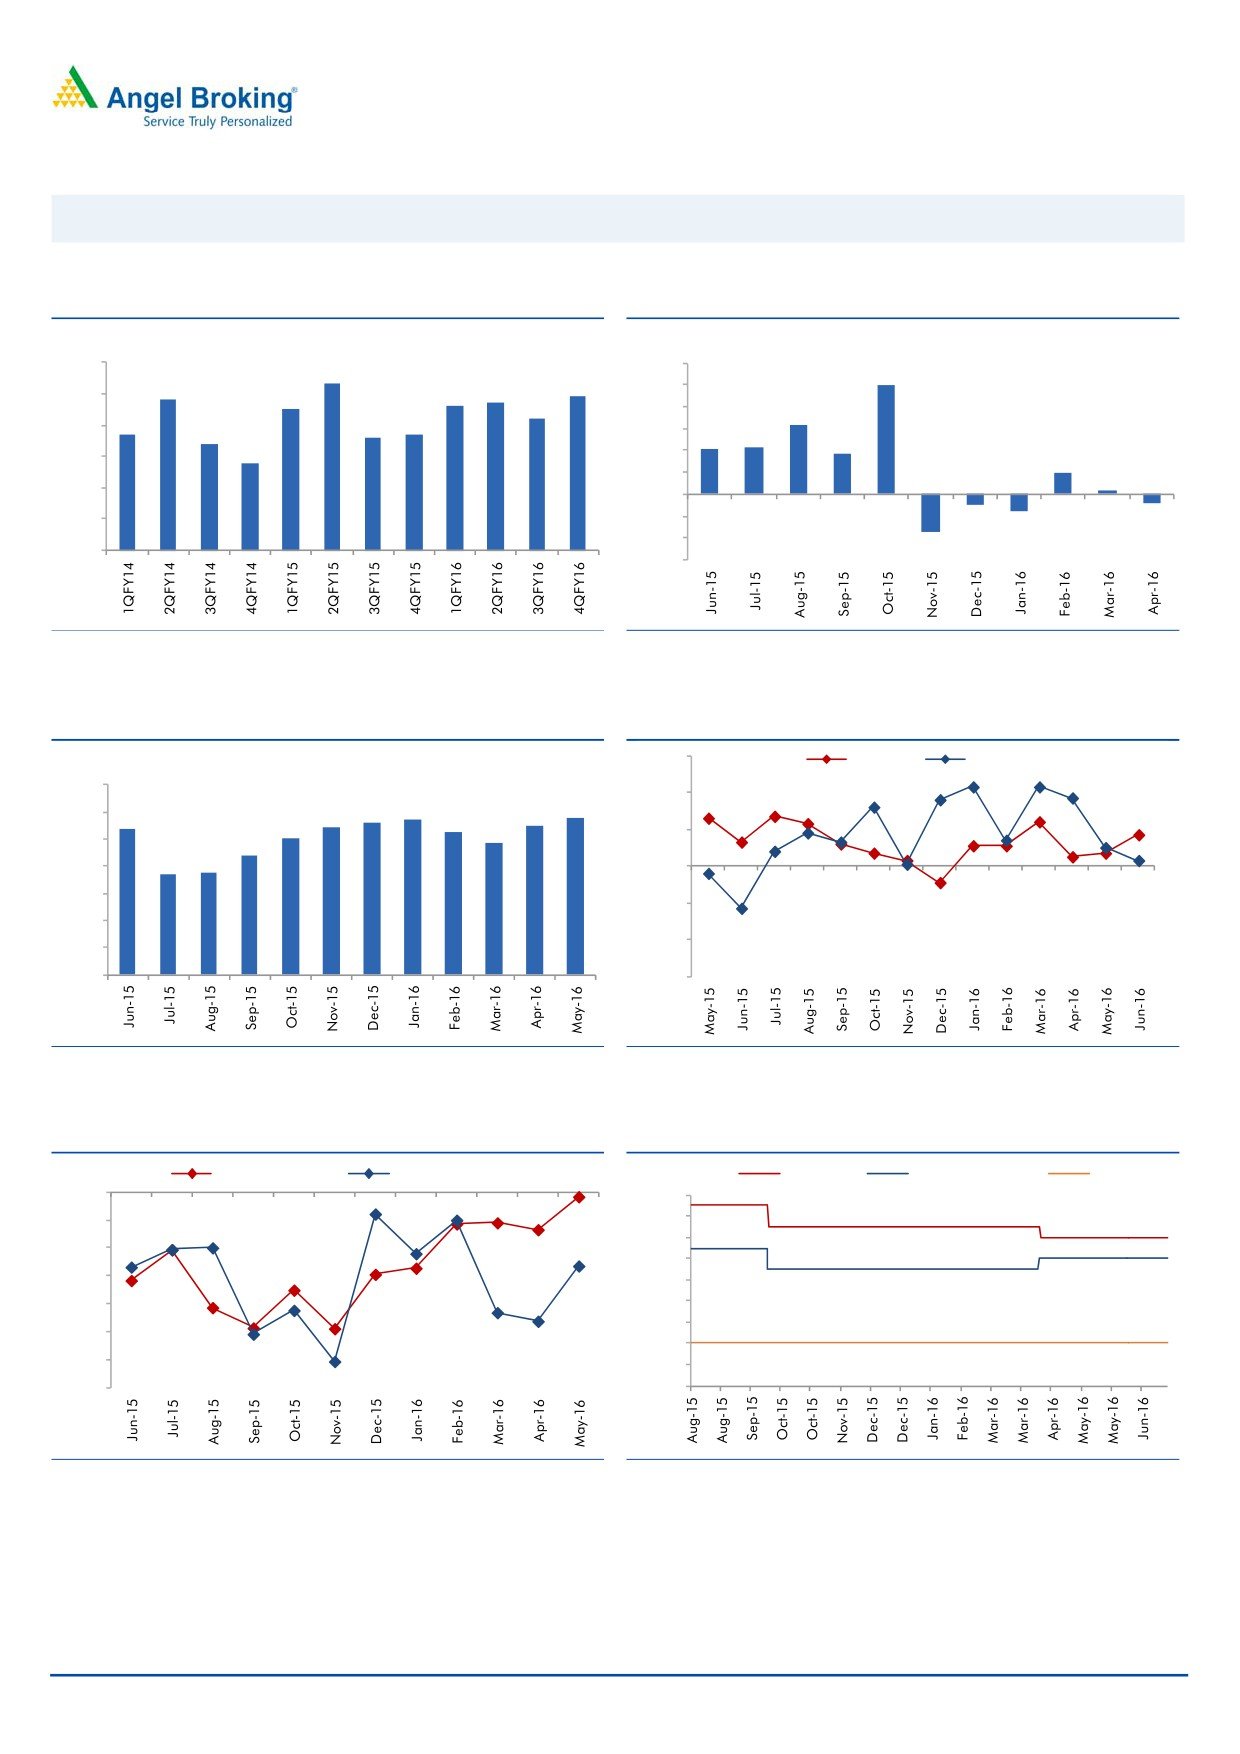
Macro watch
Exhibit 1: Quarterly GDP trends
Exhibit 2: IIP trends
(%)
(%)
9.0
12.0
8.3
9.9
7.8
7.7
7.9
10.0
8.0
7.5
7.6
7.2
8.0
6.3
6.7
6.6
6.7
7.0
6.4
6.0
4.2
4.3
3.7
5.8
4.0
6.0
2.0
2.0
0.3
5.0
-
4.0
(2.0)
(0.9)
(0.8)
(1.6)
(4.0)
3.0
(3.4)
(6.0)
Source: CSO, Angel Research
Source: MOSPI, Angel Research
Exhibit 3: Monthly CPI inflation trends
Exhibit 4: Manufacturing and services PMI
56.0
Mfg. PMI
Services PMI
(%)
7.0
54.0
5.7
5.8
5.4
5.4
5.6
5.5
6.0
5.3
5.0
4.8
52.0
5.0
4.4
3.7
3.7
4.0
50.0
3.0
48.0
2.0
46.0
1.0
-
44.0
Source: MOSPI, Angel Research
Source: Market, Angel Research; Note: Level above 50 indicates expansion
Exhibit 5: Exports and imports growth trends
Exhibit 6: Key policy rates
(%)
Exports yoy growth
Imports yoy growth
(%)
Repo rate
Reverse Repo rate
CRR
0.0
7.50
(5.0)
7.00
6.50
(10.0)
6.00
(15.0)
5.50
(20.0)
5.00
4.50
(25.0)
4.00
(30.0)
3.50
(35.0)
3.00
Source: Bloomberg, Angel Research
Source: RBI, Angel Research
July 8, 2016
15
Top Picks Report | July 2016
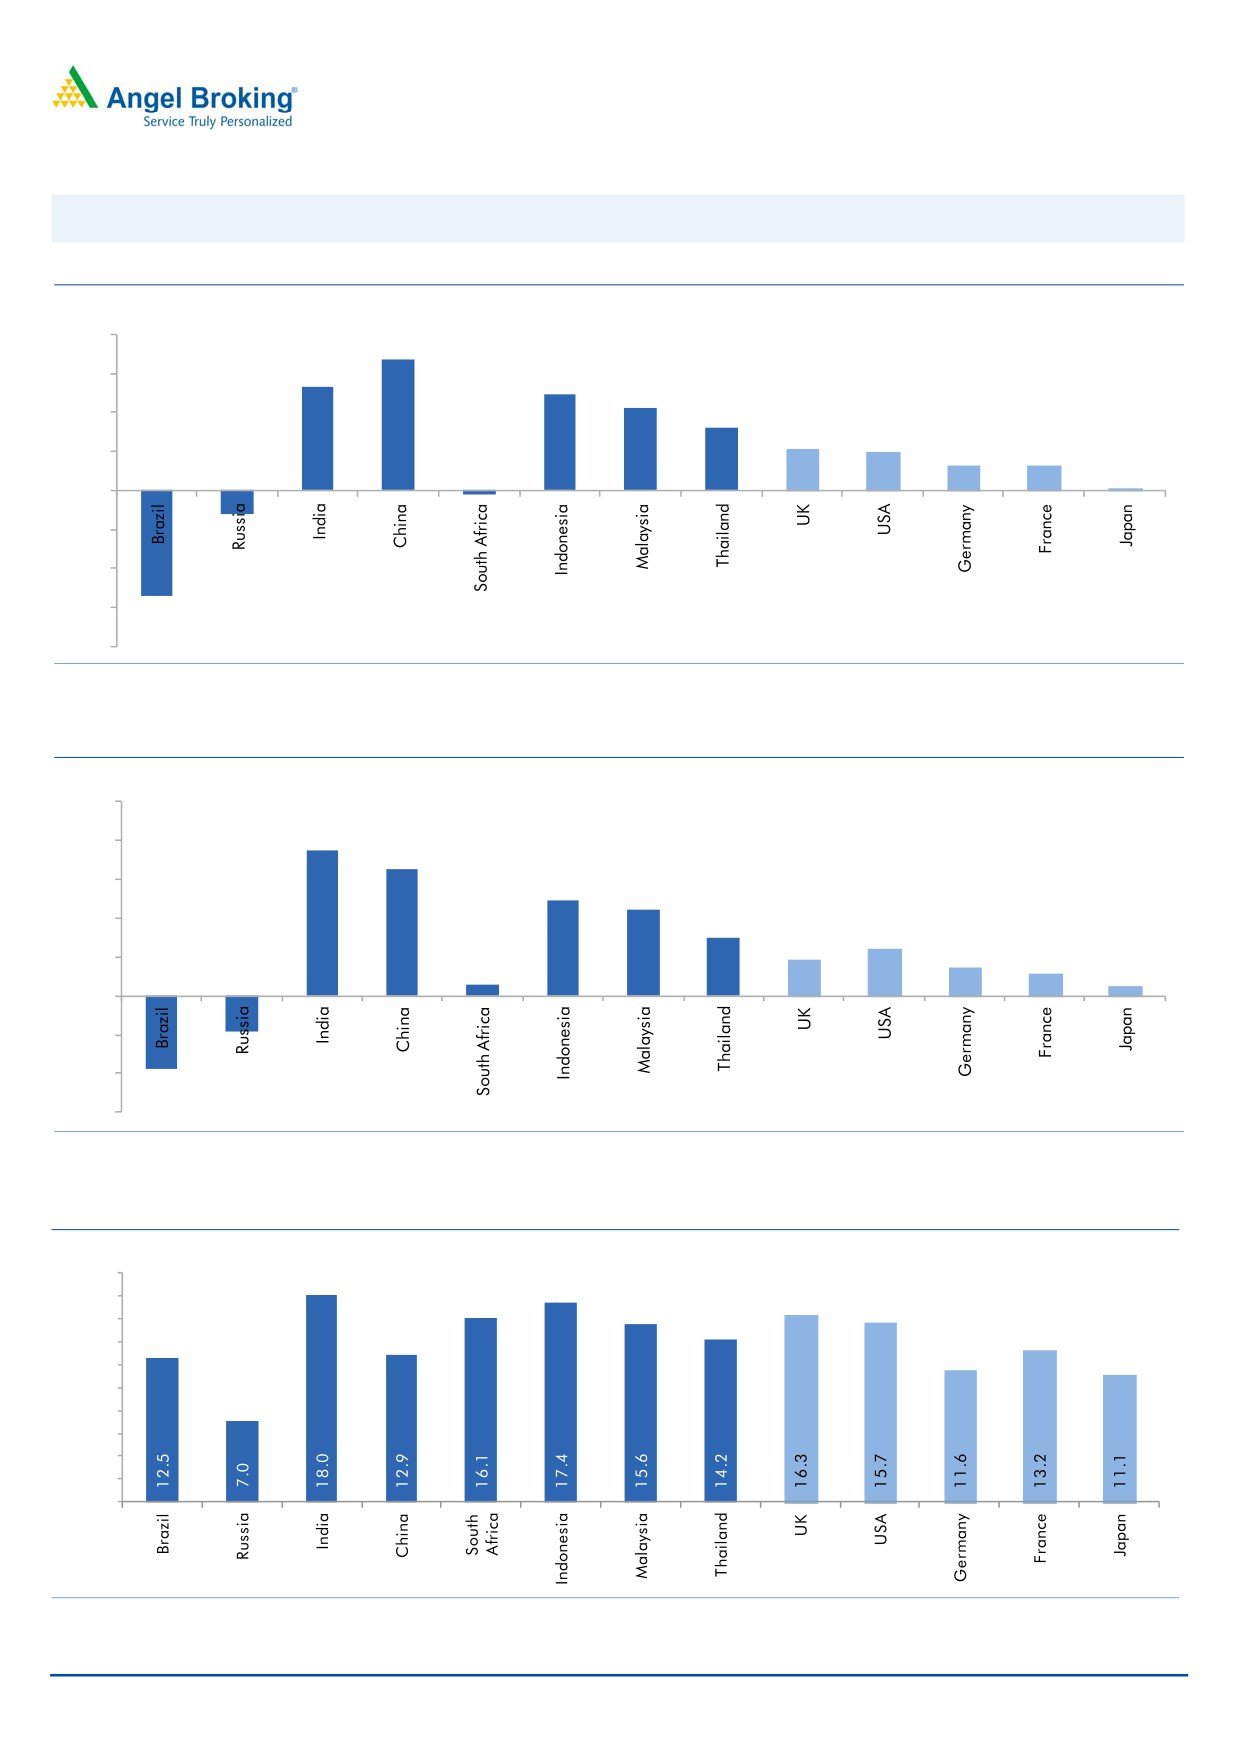
Global watch
Exhibit 1: Latest quarterly GDP Growth (%, yoy) across select developing and developed countries
(%)
8.0
6.7
6.0
5.3
4.9
4.2
4.0
3.2
2.1
2.0
2.0
1.3
1.3
0.1
-
(2.0)
(4.0)
(1.2)
(6.0)
(0.2)
(5.4)
(8.0)
Source: Bloomberg, Angel Research
Exhibit 2: 2015 GDP Growth projection by IMF (%, yoy) across select developing and developed countries
(%)
10.0
7.5
8.0
6.5
6.0
4.9
4.4
4.0
3.0
2.4
1.9
1.5
2.0
1.1
0.6
0.5
(3.8)
(1.8)
-
(2.0)
(4.0)
(6.0)
Source: IMF, Angel Research
Exhibit 3: One year forward P-E ratio across select developing and developed countries
(x)
20.0
18.0
16.0
14.0
12.0
10.0
8.0
6.0
4.0
2.0
-
Source: IMF, Angel Research
July 8, 2016
16
Top Picks Report | July 2016
Exhibit 4: Relative performance of indices across globe
Returns (%)
Country
Name of index
Closing price
1M
3M
1YR
Brazil
Bovespa
50,620
(3.1)
12.8
(6.7)
Russia
Micex
1,887
(3.4)
2.3
15.8
India
Nifty
8,221
6.7
16.9
(2.5)
China
Shanghai Composite
2,939
(1.8)
2.8
(40.5)
South Africa
Top 40
48,084
5.5
9.8
4.3
Mexico
Mexbol
45,928
1.3
2.9
3.1
Indonesia
LQ45
831
0.5
(0.7)
(9.8)
Malaysia
KLCI
1,636
(1.3)
(3.3)
(6.4)
Thailand
SET 50
917
3.3
7.7
(8.0)
USA
Dow Jones
17,807
0.3
5.1
(0.2)
UK
FTSE
6,210
0.4
0.9
(8.5)
Japan
Nikkei
16,642
(0.1)
3.8
(18.6)
Germany
DAX
10,103
1.8
3.3
(8.2)
France
CAC
4,422
2.3
0.1
(9.8)
Source: Bloomberg, Angel Research
July 8, 2016
17
Top Picks Report | July 2016
Stock Watch
July 8, 2016
18
Stock Watch | July 2016
Company Name
Reco
CMP
Target
Mkt Cap
Sales (` cr)
OPM (%)
EPS (`)
PER (x)
P/BV (x)
RoE (%)
EV/Sales (x)
(`)
Price (`)
(` cr)
FY16E
FY17E
FY16E
FY17E
FY16E
FY17E
FY16E
FY17E
FY16E
FY17E
FY16E
FY17E
FY16E
FY17E
Agri / Agri Chemical
Rallis
Neutral
214
-
4,162
1,612
1,911
13.3
13.3
7.4
9.5
28.9
22.5
4.6
4.1
16.7
18.4
2.6
2.2
United Phosphorus
Buy
555
684
23,766
13,083
15,176
18.5
18.5
31.5
37.4
17.6
14.8
3.5
2.9
21.4
21.4
2.0
1.7
Auto & Auto Ancillary
Ashok Leyland
Buy
93
111
26,495
17,995
21,544
11.4
11.6
3.4
4.7
27.4
19.8
4.8
4.4
17.7
22.2
1.4
1.2
Bajaj Auto
Neutral
2,610
-
75,536
22,709
25,860
20.9
20.1
129.0
143.6
20.2
18.2
6.2
5.3
30.7
29.4
2.9
2.5
Bharat Forge
Buy
742
875
17,283
7,351
8,318
19.9
19.7
31.2
36.5
23.8
20.3
4.3
3.6
19.3
19.2
2.5
2.2
Eicher Motors
Neutral
19,593
-
53,217
15,556
16,747
15.5
17.3
464.8
597.5
42.2
32.8
15.4
11.3
36.2
34.3
3.3
3.1
Gabriel India
Neutral
100
-
1,441
1,415
1,544
8.7
9.0
4.6
5.4
21.8
18.6
4.0
3.5
18.1
18.9
1.0
0.9
Hero Motocorp
Neutral
3,101
-
61,929
28,244
30,532
15.5
15.9
156.7
168.5
19.8
18.4
7.9
6.7
39.9
36.4
2.0
1.8
Jamna Auto Industries
Neutral
168
-
1,345
1,281
1,473
11.2
11.5
7.6
9.2
22.2
18.3
5.6
4.6
25.4
25.2
1.1
1.0
L G Balakrishnan & Bros Neutral
479
-
752
1,254
1,394
11.6
11.8
35.9
41.7
13.4
11.5
1.8
1.6
13.5
13.8
0.7
0.6
Mahindra and Mahindra Neutral
1,456
-
90,437
38,416
42,904
13.7
13.9
54.8
63.4
26.6
23.0
4.1
3.6
15.4
15.8
2.0
1.7
Maruti
Neutral
4,141
-
125,090
57,865
68,104
16.4
16.7
176.3
225.5
23.5
18.4
4.6
3.9
19.4
21.2
1.9
1.6
Minda Industries
Neutral
1,150
-
1,825
2,523
2,890
8.7
9.0
55.0
65.4
20.9
17.6
4.0
3.3
19.3
18.7
0.8
0.7
Motherson Sumi
Accumulate
278
313
36,746
39,343
45,100
8.8
9.1
10.1
12.5
27.5
22.2
8.7
6.8
35.3
34.4
1.0
0.9
Rane Brake Lining
Accumulate
414
465
328
454
511
11.5
12.0
25.2
31.0
16.4
13.4
2.5
2.2
14.9
16.6
0.8
0.8
Setco Automotive
Neutral
49
-
651
594
741
12.7
13.7
1.7
3.2
28.7
15.2
3.0
2.6
10.4
16.9
1.5
1.3
Tata Motors
Neutral
455
-
131,440
259,686
273,957
13.0
13.4
25.9
29.5
17.6
15.4
2.3
2.0
8.0
9.0
0.7
0.7
TVS Motor
Accumulate
300
330
14,243
11,263
13,122
6.9
8.5
9.2
15.0
32.6
20.0
7.4
5.9
22.7
29.6
1.2
1.0
Amara Raja Batteries
Buy
837
1,076
14,293
4,690
5,429
17.5
17.5
28.4
35.3
29.4
23.7
6.8
5.6
23.1
25.9
3.0
2.6
Exide Industries
Neutral
176
-
14,981
6,950
7,784
14.4
14.8
6.6
7.3
26.7
24.1
3.4
3.1
12.6
12.8
1.9
1.7
Apollo Tyres
Buy
151
183
7,663
12,056
12,714
17.2
16.4
23.0
20.3
6.5
7.4
1.2
1.0
17.7
13.6
0.7
0.7
Ceat
Buy
854
1,119
3,455
6,041
6,597
14.1
13.7
99.5
111.9
8.6
7.6
1.7
1.4
19.6
18.5
0.7
0.6
JK Tyres
Neutral
93
-
2,103
7,446
7,669
15.2
14.0
19.6
18.4
4.7
5.0
1.2
1.0
25.2
19.5
0.7
0.6
Swaraj Engines
Neutral
1,180
-
1,466
552
630
14.2
14.7
44.6
54.1
26.5
21.8
6.2
5.6
23.2
25.6
2.5
2.1
Subros
Neutral
91
-
547
1,293
1,527
11.8
11.9
4.2
6.7
21.7
13.6
1.6
1.5
7.7
11.5
0.7
0.6
Indag Rubber
Neutral
189
-
496
283
329
17.0
17.2
13.0
15.4
14.6
12.2
3.2
2.6
21.8
21.6
1.5
1.2
Banking
Allahabad Bank
Neutral
76
-
5,524
8,569
9,392
2.8
2.9
16.3
27.5
4.7
2.8
0.4
0.34
7.6
11.9
-
-
Axis Bank
Neutral
542
-
129,470
26,204
29,738
3.6
3.5
34.5
35.4
15.7
15.3
2.5
2.20
16.8
14.9
-
-
Bank of Baroda
Neutral
158
-
36,417
18,802
21,088
2.0
2.2
(7.4)
13.0
-
12.1
1.3
1.0
(4.2)
7.3
-
-
Bank of India
Neutral
109
-
10,218
15,972
17,271
1.9
2.0
15.3
33.3
7.1
3.3
0.3
0.3
3.6
7.6
-
-
Canara Bank
Neutral
230
-
12,489
15,441
16,945
2.0
2.1
46.6
70.4
4.9
3.3
0.4
0.4
8.0
11.2
-
-
Dena Bank
Neutral
43
-
2,834
3,440
3,840
2.1
2.3
7.2
10.0
5.9
4.2
0.4
0.4
6.1
7.9
-
-
Dewan Housing Finance Buy
213
270
6,201
1,828
2,225
2.9
2.9
24.9
29.7
8.5
7.2
1.3
1.2
15.0
16.1
-
-
Equitas Holdings
Buy
185
235
6,198
679
1,076
12.4
11.7
6.2
6.7
29.8
27.6
3.7
2.7
13.3
12.5
-
-
Federal Bank
Neutral
60
-
10,318
3,279
3,787
2.8
2.9
3.9
5.5
15.2
10.9
1.2
1.1
8.4
10.8
-
-
HDFC
Neutral
1,291
-
204,095
10,358
11,852
3.3
3.3
41.1
47.0
31.4
27.4
6.0
5.4
24.7
24.9
-
-
HDFC Bank
Accumulate
1,184
1,262
299,682
38,606
47,696
4.4
4.5
48.8
61.4
24.3
19.3
4.1
3.58
18.7
20.0
-
-
ICICI Bank
Neutral
244
-
142,195
34,279
39,262
3.3
3.3
21.0
24.4
11.6
10.0
2.0
1.7
14.4
14.7
-
-
July 8, 2016
19
Stock Watch | July 2016
Company Name
Reco
CMP
Target
Mkt Cap
Sales (` cr)
OPM (%)
EPS (`)
PER (x)
P/BV (x)
RoE (%)
EV/Sales (x)
(`)
Price (`)
(` cr)
FY16E
FY17E
FY16E
FY17E
FY16E
FY17E
FY16E
FY17E
FY16E
FY17E
FY16E
FY17E
FY16E
FY17E
IDBI Bank
Neutral
75
-
15,431
9,625
10,455
1.8
1.8
8.5
14.2
8.8
5.3
0.5
0.5
5.9
9.3
-
-
Indian Bank
Neutral
151
-
7,252
6,160
6,858
2.4
2.5
24.5
29.8
6.2
5.1
0.5
0.4
7.7
8.6
-
-
LIC Housing Finance
Buy
498
592
25,117
3,179
3,758
2.6
2.6
32.9
40.6
15.1
12.3
2.8
2.4
19.6
20.7
-
-
Oriental Bank
Neutral
121
-
4,187
7,643
8,373
2.4
2.4
37.2
45.4
3.2
2.7
0.3
0.3
8.2
9.4
-
-
Punjab Natl.Bank
Neutral
117
-
22,964
23,122
26,022
2.8
2.8
7.0
21.6
16.7
5.4
0.8
0.8
3.4
10.0
-
-
South Ind.Bank
Neutral
22
-
3,004
1,965
2,185
2.5
2.5
2.5
3.3
8.9
6.7
0.9
0.8
9.5
11.6
-
-
St Bk of India
Neutral
221
-
171,169
79,958
86,060
2.6
2.6
13.4
20.7
16.5
10.7
1.3
1.3
11.5
12.8
-
-
Union Bank
Neutral
133
-
9,140
12,646
14,129
2.3
2.4
31.0
39.1
4.3
3.4
0.5
0.4
9.8
11.4
-
-
Vijaya Bank
Neutral
43
-
4,270
3,536
3,827
1.8
1.9
5.5
6.7
7.7
6.4
0.6
0.6
7.8
8.8
-
-
Yes Bank
Neutral
1,112
-
46,823
7,190
9,011
3.2
3.3
58.2
69.7
19.1
16.0
3.4
2.9
19.2
19.6
-
-
Capital Goods
ACE
Neutral
47
-
462
660
839
4.7
8.2
1.0
3.9
46.7
12.0
1.5
1.3
3.2
11.3
0.8
0.7
BEML
Buy
894
1,157
3,722
3,277
4,006
6.0
8.9
36.2
64.3
24.7
13.9
1.7
1.6
5.7
11.7
1.2
0.9
Bharat Electronics
Accumulate
1,270
1,414
30,478
7,295
8,137
20.0
16.8
56.5
58.7
22.5
21.6
3.4
3.0
42.1
44.6
3.4
2.9
Voltas
Buy
315
407
10,425
5,857
6,511
7.5
7.9
11.7
12.9
26.9
24.4
4.4
3.9
17.1
16.7
1.8
1.6
BGR Energy
Neutral
127
-
919
3,615
3,181
9.5
9.4
16.7
12.4
7.6
10.3
0.7
0.7
10.0
7.0
0.7
0.8
BHEL
Neutral
140
-
34,279
33,722
35,272
10.8
11.7
10.5
14.2
13.3
9.9
1.0
0.9
7.0
9.0
1.1
1.0
Blue Star
Accumulate
435
495
3,918
3,770
4,351
5.7
6.4
11.4
17.2
38.1
25.4
5.9
5.5
18.4
23.1
1.1
0.9
Crompton Greaves
Neutral
73
-
4,591
13,484
14,687
4.9
6.2
4.5
7.1
16.3
10.3
1.1
1.1
7.2
10.8
0.5
0.4
Greaves Cotton
Neutral
138
-
3,371
1,655
1,755
16.6
16.8
7.4
7.8
18.7
17.7
3.7
3.5
21.1
20.6
2.0
1.9
Inox Wind
Buy
234
286
5,193
4,406
5,605
15.5
15.7
20.4
24.8
11.5
9.4
2.6
1.9
27.9
25.9
1.4
1.1
KEC International
Neutral
144
-
3,698
8,791
9,716
6.1
6.8
5.4
8.2
26.6
17.5
2.7
2.4
10.0
14.0
0.6
0.6
Thermax
Neutral
893
-
10,639
6,413
7,525
7.4
8.5
30.5
39.3
29.3
22.7
4.5
3.9
15.0
17.0
1.6
1.3
VATech Wabag
Accumulate
598
681
3,259
2,722
3,336
7.9
8.1
19.5
24.6
30.7
24.3
3.2
2.8
11.1
12.4
1.3
1.0
Cement
ACC
Neutral
1,603
-
30,110
13,151
14,757
16.4
18.3
63.9
83.4
25.1
19.2
3.2
3.0
13.3
16.1
2.1
1.8
Ambuja Cements
Neutral
257
-
39,884
11,564
12,556
19.4
20.7
8.9
10.1
28.9
25.4
3.6
3.4
12.8
13.8
3.1
2.8
HeidelbergCement
Neutral
115
-
2,602
1,772
1,926
13.3
15.4
1.0
3.0
114.8
38.3
2.9
2.7
2.6
7.9
2.0
1.8
India Cements
Neutral
117
-
3,588
4,216
4,840
18.0
19.5
4.0
9.9
29.2
11.8
1.2
1.1
4.0
9.5
1.2
1.0
JK Cement
Neutral
712
-
4,982
3,661
4,742
10.1
15.8
7.5
28.5
95.0
25.0
2.9
2.5
7.5
22.9
1.8
1.4
J K Lakshmi Cement
Neutral
403
-
4,746
2,947
3,616
16.7
19.9
11.5
27.2
35.1
14.8
3.3
2.9
9.8
20.8
2.0
1.6
Mangalam Cements
Neutral
303
-
809
1,053
1,347
10.5
13.3
8.4
26.0
36.1
11.7
1.5
1.4
4.3
12.5
1.1
0.9
Orient Cement
Neutral
179
-
3,664
1,854
2,524
21.2
22.2
7.7
11.1
23.2
16.1
3.3
2.9
13.3
15.7
2.7
1.9
Ramco Cements
Neutral
575
-
13,699
4,036
4,545
20.8
21.3
15.1
18.8
38.1
30.6
4.7
4.1
12.9
14.3
3.9
3.4
Shree Cement^
Neutral
15,542
-
54,143
7,150
8,742
26.7
28.6
228.0
345.5
68.2
45.0
10.0
8.4
15.7
20.3
7.3
5.9
UltraTech Cement
Neutral
3,379
-
92,742
24,669
29,265
18.2
20.6
82.0
120.0
41.2
28.2
4.4
3.9
11.3
14.7
3.8
3.2
Construction
ITNL
Accumulate
82
93
2,681
7,360
8,682
34.0
32.2
7.0
8.6
11.6
9.5
0.4
0.4
3.2
2.5
3.7
3.6
KNR Constructions
Accumulate
570
603
1,603
937
1,470
14.3
14.0
44.2
38.6
12.9
14.8
2.6
2.2
15.4
15.4
1.8
1.2
Larsen & Toubro
Accumulate
1,554
1,700
144,839
58,870
65,708
8.3
10.3
42.0
53.0
37.0
29.3
2.6
2.3
8.8
11.2
2.7
2.4
Gujarat Pipavav Port
Neutral
170
-
8,214
629
684
51.0
52.2
6.4
5.9
26.5
28.8
3.5
3.2
15.9
12.7
12.7
11.5
MBL Infrastructures
Buy
139
285
576
2,313
2,797
12.2
14.6
19.0
20.0
7.3
7.0
0.8
0.7
11.3
10.6
1.0
0.9
Nagarjuna Const.
Neutral
76
-
4,242
7,892
8,842
8.8
9.1
3.0
5.3
25.4
14.4
1.3
1.2
5.0
8.5
0.8
0.6
PNC Infratech
Accumulate
571
647
2,930
1,873
2,288
13.2
13.5
24.0
32.0
23.8
17.8
2.3
2.1
12.1
12.3
1.7
1.4
July 8, 2016
20
Stock Watch | July 2016
Company Name
Reco
CMP
Target
Mkt Cap
Sales (` cr)
OPM (%)
EPS (`)
PER (x)
P/BV (x)
RoE (%)
EV/Sales (x)
(`)
Price (`)
(` cr)
FY16E
FY17E
FY16E
FY17E
FY16E
FY17E
FY16E
FY17E
FY16E
FY17E
FY16E
FY17E
FY16E
FY17E
Simplex Infra
Neutral
310
-
1,531
5,955
6,829
10.3
10.5
16.0
31.0
19.3
10.0
1.0
0.9
5.3
9.9
0.8
0.6
Power Mech Projects
Neutral
571
-
841
1,539
1,801
12.8
12.7
59.0
72.1
9.7
7.9
1.5
1.2
18.6
16.8
0.5
0.5
Sadbhav Engineering
Neutral
291
-
4,986
3,186
3,598
10.2
10.3
8.0
9.0
36.3
32.3
3.4
3.0
9.4
9.9
1.9
1.7
NBCC
Neutral
216
-
12,933
5,838
7,428
6.0
7.9
5.2
8.2
41.5
26.3
1.3
1.0
21.9
28.2
2.0
1.5
MEP Infra
Neutral
43
-
702
1,956
1,876
28.1
30.5
1.3
3.0
33.2
14.4
7.0
4.7
21.2
32.8
1.8
1.8
SIPL
Neutral
102
-
3,605
675
1,042
62.4
64.7
-
-
3.8
4.4
-
-
17.0
11.5
Engineers India
Neutral
209
-
7,052
1,667
1,725
13.5
16.0
9.7
11.4
21.6
18.4
2.5
2.5
11.7
13.4
3.0
3.0
FMCG
Asian Paints
Neutral
987
-
94,711
15,534
17,445
17.7
16.8
18.4
19.6
53.8
50.4
19.0
17.9
34.6
35.6
6.0
5.3
Britannia
Neutral
2,812
-
33,738
8,481
9,795
14.0
14.1
65.5
78.3
42.9
35.9
20.3
16.7
38.3
41.2
3.9
3.4
Colgate
Neutral
945
-
25,708
4,136
4,632
22.5
23.3
22.2
25.3
42.6
37.4
25.9
23.1
68.6
67.5
6.1
5.4
Dabur India
Neutral
315
-
55,343
9,370
10,265
17.6
17.3
7.3
8.1
42.9
38.8
11.1
10.2
31.7
30.6
5.7
5.2
GlaxoSmith Con*
Neutral
6,164
-
25,922
4,519
5,142
19.6
19.8
164.3
191.2
37.5
32.2
10.4
8.8
30.8
29.9
5.1
4.5
Godrej Consumer
Neutral
1,631
-
55,555
9,003
10,335
18.1
18.7
34.1
41.8
47.9
39.0
10.3
8.9
23.9
24.8
6.3
5.5
HUL
Neutral
917
-
198,537
33,299
35,497
17.1
17.1
18.9
20.0
48.6
45.9
42.5
37.0
87.6
80.8
5.8
5.4
ITC
Neutral
247
-
297,545
36,837
39,726
38.8
38.7
8.1
9.0
30.2
27.5
8.4
7.4
27.8
26.9
7.6
7.0
Marico
Neutral
269
-
34,667
6,151
6,966
17.2
17.3
5.4
6.4
49.8
42.0
15.6
12.3
33.2
32.4
5.5
4.9
Nestle*
Neutral
6,509
-
62,754
9,393
10,507
22.2
22.3
106.8
121.8
60.9
53.4
21.4
19.3
34.8
36.7
6.5
5.8
Tata Global
Neutral
134
-
8,486
8,635
9,072
9.8
9.9
5.8
7.2
23.2
18.7
2.1
2.0
6.8
7.4
1.0
1.0
Procter & Gamble
Buy
6,280
7,369
20,385
2,588
2,939
23.3
23.2
130.2
146.2
48.2
43.0
96.2
92.2
27.6
25.3
7.5
6.5
IT
HCL Tech^
Buy
717
1,000
101,151
37,061
30,781
21.5
20.5
51.4
40.0
13.9
17.9
3.6
2.6
20.1
20.3
2.5
2.6
Infosys
Buy
1,157
1,374
265,802
62,441
70,558
27.5
27.5
59.0
65.3
19.6
17.7
3.9
3.6
22.2
22.4
3.7
3.2
TCS
Buy
2,429
3,004
478,627
108,646
122,770
28.3
28.3
123.7
141.0
19.6
17.2
6.5
6.0
33.1
34.6
3.9
3.4
Tech Mahindra
Buy
504
700
48,919
26,494
30,347
16.3
17.0
32.2
37.5
15.6
13.4
3.4
2.9
21.7
21.8
1.6
1.3
Wipro
Buy
559
680
138,088
50,808
56,189
23.7
23.8
37.3
40.7
15.0
13.7
2.9
2.6
19.2
17.7
2.2
1.8
Media
D B Corp
Neutral
383
-
7,042
2,025
2,187
27.4
27.4
17.4
18.9
22.0
20.3
5.0
4.5
22.9
23.7
3.5
3.2
HT Media
Neutral
83
-
1,926
2,495
2,673
12.9
13.2
6.8
7.2
12.2
11.5
0.9
0.9
7.5
7.8
0.4
0.3
Jagran Prakashan
Accumulate
183
205
5,973
2,107
2,355
33.5
28.0
10.0
10.8
18.2
16.9
4.2
3.7
23.3
21.7
2.9
2.5
Sun TV Network
Neutral
382
-
15,038
2,510
2,763
71.8
71.5
21.9
24.8
17.4
15.4
4.1
3.7
22.8
24.3
5.4
4.9
Hindustan Media
Neutral
272
-
1,993
914
1,016
21.7
21.5
21.9
23.2
12.4
11.7
2.2
1.9
18.0
16.2
1.6
1.4
Metal
Coal India
Buy
315
380
199,250
76,167
84,130
19.9
22.3
22.4
25.8
14.1
12.2
5.1
4.9
35.5
41.0
1.9
1.7
Hind. Zinc
Neutral
187
-
78,887
14,641
14,026
50.4
50.4
17.7
16.0
10.6
11.7
1.6
1.5
16.2
13.2
3.0
2.9
Hindalco
Neutral
128
-
26,380
104,356
111,186
8.7
9.5
6.7
11.1
19.0
11.6
0.7
0.7
3.5
5.9
0.8
0.7
JSW Steel
Neutral
1,463
-
35,364
42,308
45,147
16.4
20.7
(10.3)
49.5
-
29.6
1.6
1.6
(1.0)
5.6
1.9
1.8
NMDC
Neutral
96
-
37,942
8,237
10,893
46.6
44.5
9.9
11.7
9.6
8.2
1.1
0.9
12.4
13.0
4.4
3.3
SAIL
Neutral
47
-
19,453
45,915
53,954
7.2
10.5
1.5
4.4
31.3
10.8
0.5
0.4
2.3
4.1
1.1
0.9
Vedanta
Neutral
143
-
42,529
71,445
81,910
26.2
26.2
12.9
19.2
11.1
7.5
0.8
0.7
7.2
8.9
1.0
0.8
Tata Steel
Neutral
318
-
30,851
126,760
137,307
8.9
11.3
6.4
23.1
49.9
13.8
1.0
1.0
2.0
7.1
0.8
0.8
July 8, 2016
21
Stock Watch | July 2016
Company Name
Reco
CMP
Target
Mkt Cap
Sales (` cr)
OPM (%)
EPS (`)
PER (x)
P/BV (x)
RoE (%)
EV/Sales (x)
(`)
Price (`)
(` cr)
FY16E
FY17E
FY16E
FY17E
FY16E
FY17E
FY16E
FY17E
FY16E
FY17E
FY16E
FY17E
FY16E
FY17E
Oil & Gas
Cairn India
Neutral
150
-
28,189
11,323
12,490
49.4
51.0
20.7
20.6
7.3
7.3
0.5
0.4
6.4
6.1
1.6
0.9
GAIL
Neutral
385
-
48,779
64,856
70,933
9.1
9.6
24.0
28.9
16.0
13.3
1.4
1.3
8.8
9.6
0.9
0.8
ONGC
Neutral
227
-
193,910
154,564
145,998
36.8
37.4
20.8
22.6
10.9
10.0
1.0
1.0
10.1
9.7
1.5
1.6
Petronet LNG
Neutral
294
-
22,061
29,691
31,188
5.8
6.2
12.8
13.4
23.0
21.9
3.4
3.1
15.8
14.8
0.8
0.8
Indian Oil Corp
Neutral
473
-
114,927
359,607
402,760
5.9
6.1
42.5
48.7
11.1
9.7
1.5
1.3
14.1
14.3
0.4
0.4
Reliance Industries
Neutral
988
-
320,321
304,775
344,392
12.6
13.4
91.3
102.6
10.8
9.6
1.2
1.1
11.8
12.0
1.0
0.8
Pharmaceuticals
Alembic Pharma
Neutral
580
-
10,936
3,145
3,483
31.9
16.2
38.2
18.7
15.2
31.0
6.8
5.8
57.9
20.1
3.4
3.1
Aurobindo Pharma
Neutral
763
-
44,654
13,651
15,702
21.7
21.7
33.9
38.4
22.5
19.9
6.3
4.9
32.5
27.7
3.5
3.1
Aventis*
Neutral
4,570
-
10,525
2,049
2,375
15.4
17.3
115.4
153.5
39.6
29.8
6.5
5.0
19.3
25.8
4.9
4.1
Cadila Healthcare
Buy
343
400
35,094
9,469
11,246
21.2
22.0
14.9
17.1
23.0
20.0
6.6
5.1
28.8
26.6
3.7
3.1
Cipla
Neutral
513
-
41,243
13,372
15,378
16.4
17.4
18.8
21.6
27.3
23.8
3.5
3.1
13.3
13.7
3.1
3.0
Dr Reddy's
Neutral
3,525
-
60,118
15,471
17,479
24.6
24.6
138.2
152.4
25.5
23.1
4.7
4.0
19.7
18.7
3.8
3.4
Dishman Pharma
Neutral
135
-
2,183
1,733
1,906
21.5
21.5
10.1
10.0
13.4
13.5
1.6
1.4
10.5
11.2
1.8
1.5
GSK Pharma*
Neutral
3,512
-
29,746
2,741
3,528
16.5
18.9
44.2
60.1
79.5
58.4
17.5
17.4
21.2
29.9
10.5
8.2
Indoco Remedies
Neutral
285
-
2,623
977
1,112
14.9
18.2
9.0
13.2
31.6
21.6
4.5
3.8
15.1
19.2
2.8
2.5
Ipca labs
Buy
474
613
5,977
2,844
3,799
10.6
15.3
10.6
17.3
44.7
27.4
2.6
2.4
5.9
9.1
2.2
1.7
Lupin
Accumulate
1,657
1,809
74,718
13,702
15,912
23.7
26.4
50.5
58.1
32.8
28.5
6.8
5.5
22.9
21.4
5.9
4.7
Sun Pharma
Buy
777
944
187,108
27,744
31,129
26.0
30.0
22.0
28.0
35.3
27.8
5.1
4.3
18.3
18.7
6.6
5.7
Power
Tata Power
Neutral
74
-
19,893
35,923
37,402
22.6
22.8
4.1
5.2
18.1
14.3
1.4
1.3
7.5
9.3
1.5
1.4
NTPC
Neutral
153
-
125,991
87,271
99,297
23.4
23.5
11.7
13.3
13.0
11.5
1.5
1.4
11.5
12.2
2.5
2.2
Power Grid
Neutral
163
-
85,432
20,702
23,361
86.7
86.4
12.1
13.2
13.5
12.4
2.0
1.8
15.6
15.1
9.0
8.4
Real Estate
MLIFE
Buy
467
554
1,916
826
1,011
20.1
21.9
22.7
30.7
20.6
15.2
1.2
1.1
6.0
7.4
4.2
3.2
Telecom
Bharti Airtel
Neutral
363
-
145,226
101,748
109,191
32.1
31.7
12.0
12.5
30.3
29.1
2.1
2.0
6.9
6.7
2.1
1.9
Idea Cellular
Neutral
105
-
37,772
34,282
36,941
32.0
31.5
5.9
6.2
17.8
16.9
1.6
1.5
9.9
9.3
1.7
1.6
Others
Abbott India
Neutral
4,760
-
10,115
2,715
3,153
14.5
14.1
134.3
152.2
35.5
31.3
8.8
7.3
27.4
25.6
3.4
2.9
Bajaj Electricals
Accumulate
248
268
2,505
4,612
5,351
5.6
5.7
9.5
12.4
26.2
20.1
3.3
2.9
12.5
14.4
0.5
0.5
Banco Products (India)
Neutral
154
-
1,102
1,208
1,353
10.9
12.3
10.8
14.5
14.3
10.6
1.6
1.5
11.9
14.5
0.9
0.8
Coffee Day Enterprises
Neutral
253
-
5,210
2,692
2,964
17.0
18.6
-
4.7
-
53.4
3.1
2.9
0.1
5.5
2.3
2.2
Competent Automobiles Neutral
147
-
90
1,040
1,137
3.2
3.1
25.7
28.0
5.7
5.3
0.9
0.8
15.0
14.3
0.1
0.1
Elecon Engineering
Neutral
65
-
705
1,359
1,482
10.3
13.6
0.8
3.9
80.6
16.6
1.3
1.3
1.6
7.8
0.9
0.8
Finolex Cables
Neutral
373
-
5,699
2,520
2,883
12.2
12.0
12.7
14.2
29.4
26.2
4.0
3.6
13.6
13.5
2.0
1.7
Garware Wall Ropes
Buy
390
460
854
828
898
11.2
10.3
28.3
29.0
13.8
13.4
2.3
2.0
16.8
14.9
1.0
0.9
Goodyear India*
Buy
526
631
1,213
1,750
1,598
11.3
10.4
53.7
49.4
9.8
10.6
2.1
1.8
23.0
18.2
0.5
0.4
July 8, 2016
22
Stock Watch | July 2016
Company Name
Reco
CMP
Target
Mkt Cap
Sales (` cr)
OPM (%)
EPS (`)
PER (x)
P/BV (x)
RoE (%)
EV/Sales (x)
(`)
Price (`)
(` cr)
FY16E
FY17E
FY16E
FY17E FY16E
FY17E
FY16E
FY17E
FY16E
FY17E
FY16E
FY17E
FY16E
FY17E
Hitachi
Neutral
1,346
-
3,659
1,779
2,081
7.8
8.8
21.8
33.4
61.7
40.2
10.0
8.1
17.4
22.1
2.1
1.8
HSIL
Accumulate
280
310
2,024
2,123
2,384
16.1
16.5
15.0
18.9
18.6
14.8
1.4
1.3
8.0
9.4
1.3
1.1
Interglobe Aviation
Neutral
1,013
-
36,504
17,022
21,122
20.7
14.5
63.9
53.7
15.9
18.9
23.8
19.5
149.9
103.2
2.2
1.7
Jyothy Laboratories
Neutral
301
-
5,448
1,620
1,847
11.5
11.5
7.3
8.5
41.3
35.5
5.3
4.9
13.3
14.4
3.2
2.7
Kirloskar Engines India
Neutral
267
-
3,855
2,403
2,554
8.6
9.9
9.2
10.5
29.0
25.4
2.8
2.7
9.7
10.7
1.2
1.1
Linc Pen & Plastics
Neutral
242
-
358
344
382
9.1
9.1
12.4
13.1
19.5
18.5
3.5
3.1
18.0
16.7
1.1
1.0
M M Forgings
Buy
431
546
520
511
615
21.7
21.6
43.1
55.8
10.0
7.7
1.8
1.5
19.9
21.2
1.2
0.9
Manpasand Bever.
Neutral
590
-
2,953
540
836
19.9
19.6
10.2
16.9
57.6
34.9
4.7
4.2
8.1
12.0
5.1
3.3
MRF
Buy
35,109
45,575
14,890
20,316
14,488
21.4
21.1
5,488.0
3,797.9
6.4
9.2
2.2
1.8
41.1
21.2
0.7
0.9
MT Educare
Neutral
165
-
657
286
366
18.3
17.7
7.7
9.4
21.4
17.6
4.5
3.9
20.2
21.1
2.2
1.7
Narayana Hrudaya
Neutral
311
-
6,352
1,603
1,873
10.9
11.5
1.0
2.6
326.3
117.5
7.9
7.2
2.4
6.1
4.1
3.5
Navkar Corporation
Buy
213
265
3,037
347
408
43.2
42.9
6.7
6.8
31.9
31.4
2.3
2.2
7.3
6.9
9.2
8.3
Navneet Education
Neutral
101
-
2,399
998
1,062
24.1
24.0
5.8
6.1
17.5
16.5
3.9
3.4
22.0
20.5
2.5
2.3
Nilkamal
Neutral
1,222
-
1,824
1,871
2,031
10.7
10.5
63.2
69.8
19.3
17.5
3.2
2.7
17.6
16.6
1.0
0.9
Page Industries
Neutral
13,492
-
15,049
1,929
2,450
19.8
20.1
229.9
299.0
58.7
45.1
25.9
18.0
52.1
47.0
7.8
6.1
Parag Milk Foods
Accumulate
311
336
2,618
1,645
1,919
9.0
9.3
6.7
9.4
46.3
33.0
6.1
5.1
13.1
15.5
1.8
1.5
Quick Heal
Neutral
293
-
2,049
339
408
27.8
27.3
7.1
7.7
41.4
37.8
3.5
3.5
8.5
9.3
5.0
4.2
Radico Khaitan
Buy
95
125
1,264
1,543
1,659
12.6
13.0
5.8
6.3
16.4
15.0
1.4
1.3
8.5
8.6
1.3
1.2
Relaxo Footwears
Neutral
478
-
5,735
1,767
2,152
12.3
12.5
19.2
25.1
24.8
19.1
6.1
4.7
27.7
27.8
3.3
2.7
S H Kelkar & Co.
Neutral
221
-
3,192
928
1,036
15.3
15.1
4.9
6.1
44.7
36.1
4.2
3.9
9.4
10.7
3.3
2.9
Siyaram Silk Mills
Buy
1,080
1,347
1,013
1,619
1,799
11.6
11.6
93.5
104.9
11.6
10.3
2.0
1.7
17.1
16.4
0.9
0.8
Styrolution ABS India*
Neutral
644
-
1,132
1,271
1,440
8.6
9.2
32.0
41.1
20.1
15.7
2.1
1.8
10.7
12.4
0.9
0.7
Surya Roshni
Buy
166
201
728
2,992
3,223
8.1
8.4
14.7
18.3
11.3
9.1
1.1
1.0
9.7
11.0
0.5
0.5
Team Lease Serv.
Neutral
1,101
-
1,883
2,565
3,229
1.3
1.5
15.2
22.8
72.6
48.4
5.8
5.2
8.0
10.7
0.6
0.5
The Byke Hospitality
Neutral
159
-
639
222
287
20.5
20.5
5.6
7.6
28.3
21.1
5.3
4.4
18.8
20.7
2.9
2.2
Transport Corporation
Neutral
329
-
2,520
2,830
3,350
8.8
9.0
14.4
18.3
22.9
18.0
3.5
3.1
15.4
17.1
1.0
0.9
TVS Srichakra
Buy
2,407
2,932
1,843
2,035
2,252
15.9
15.3
248.6
268.1
9.7
9.0
4.2
3.0
43.6
33.9
0.9
0.8
UFO Moviez
Neutral
546
-
1,506
558
619
32.0
33.2
22.5
30.0
24.2
18.2
2.9
2.5
12.0
13.8
2.6
2.1
Visaka Industries
Neutral
159
-
252
1,020
1,120
8.7
9.1
13.9
20.1
11.4
7.9
0.7
0.7
6.4
8.7
0.5
0.4
VRL Logistics
Neutral
312
-
2,844
1,725
1,902
16.5
16.7
12.2
14.6
25.6
21.4
5.3
4.7
20.8
21.9
1.8
1.6
Wonderla Holidays
Neutral
398
-
2,250
206
308
44.0
43.6
9.0
12.9
44.3
30.9
6.0
5.5
13.7
17.8
10.8
7.2
Source: Company, Angel Research, Note: *December year end; #September year end;
&October year end; ^June year end; Price as of July 7, 2016
July 8, 2016
23
Top Picks Report | July 2016
Research Team Tel: 022 - 39357800
DISCLAIMER
Angel Broking Private Limited (hereinafter referred to as “Angel”) is a registered Member of National Stock Exchange of India Limited,
Bombay Stock Exchange Limited and Metropolitan Stock Exchange of India Limited. It is also registered as a Depository Participant with
CDSL and Portfolio Manager with SEBI. It also has registration with AMFI as a Mutual Fund Distributor. Angel Broking Private Limited is
a registered entity with SEBI for Research Analyst in terms of SEBI (Research Analyst) Regulations, 2014 vide registration number
INH000000164. Angel or its associates has not been debarred/ suspended by SEBI or any other regulatory authority for accessing
/dealing in securities Market. Angel or its associates including its relatives/analyst do not hold any financial interest/beneficial
ownership of more than 1% in the company covered by Analyst. Angel or its associates/analyst has not received any compensation /
managed or co-managed public offering of securities of the company covered by Analyst during the past twelve months. Angel/analyst
has not served as an officer, director or employee of company covered by Analyst and has not been engaged in market making activity
of the company covered by Analyst.
This document is solely for the personal information of the recipient, and must not be singularly used as the basis of any investment
decision. Nothing in this document should be construed as investment or financial advice. Each recipient of this document should
make such investigations as they deem necessary to arrive at an independent evaluation of an investment in the securities of the
companies referred to in this document (including the merits and risks involved), and should consult their own advisors to determine
the merits and risks of such an investment.
Reports based on technical and derivative analysis center on studying charts of a stock's price movement, outstanding positions and
trading volume, as opposed to focusing on a company's fundamentals and, as such, may not match with a report on a company's
fundamentals.
The information in this document has been printed on the basis of publicly available information, internal data and other reliable
sources believed to be true, but we do not represent that it is accurate or complete and it should not be relied on as such, as this
document is for general guidance only. Angel Broking Pvt. Limited or any of its affiliates/ group companies shall not be in any way
responsible for any loss or damage that may arise to any person from any inadvertent error in the information contained in this report.
Angel Broking Pvt. Limited has not independently verified all the information contained within this document. Accordingly, we cannot
testify, nor make any representation or warranty, express or implied, to the accuracy, contents or data contained within this document.
While Angel Broking Pvt. Limited endeavors to update on a reasonable basis the information discussed in this material, there may be
regulatory, compliance, or other reasons that prevent us from doing so.
This document is being supplied to you solely for your information, and its contents, information or data may not be reproduced,
redistributed or passed on, directly or indirectly.
Neither Angel Broking Pvt. Limited, nor its directors, employees or affiliates shall be liable for any loss or damage that may arise from
or in connection with the use of this information.
Note: Please refer to the important ‘Stock Holding Disclosure' report on the Angel website (Research Section). Also, please refer to the
latest update on respective stocks for the disclosure status in respect of those stocks. Angel Broking Pvt. Limited and its affiliates may
have investment positions in the stocks recommended in this report.
July 8, 2016
24