Angel Top Picks - January 2016
Angel Top Picks - January 2016
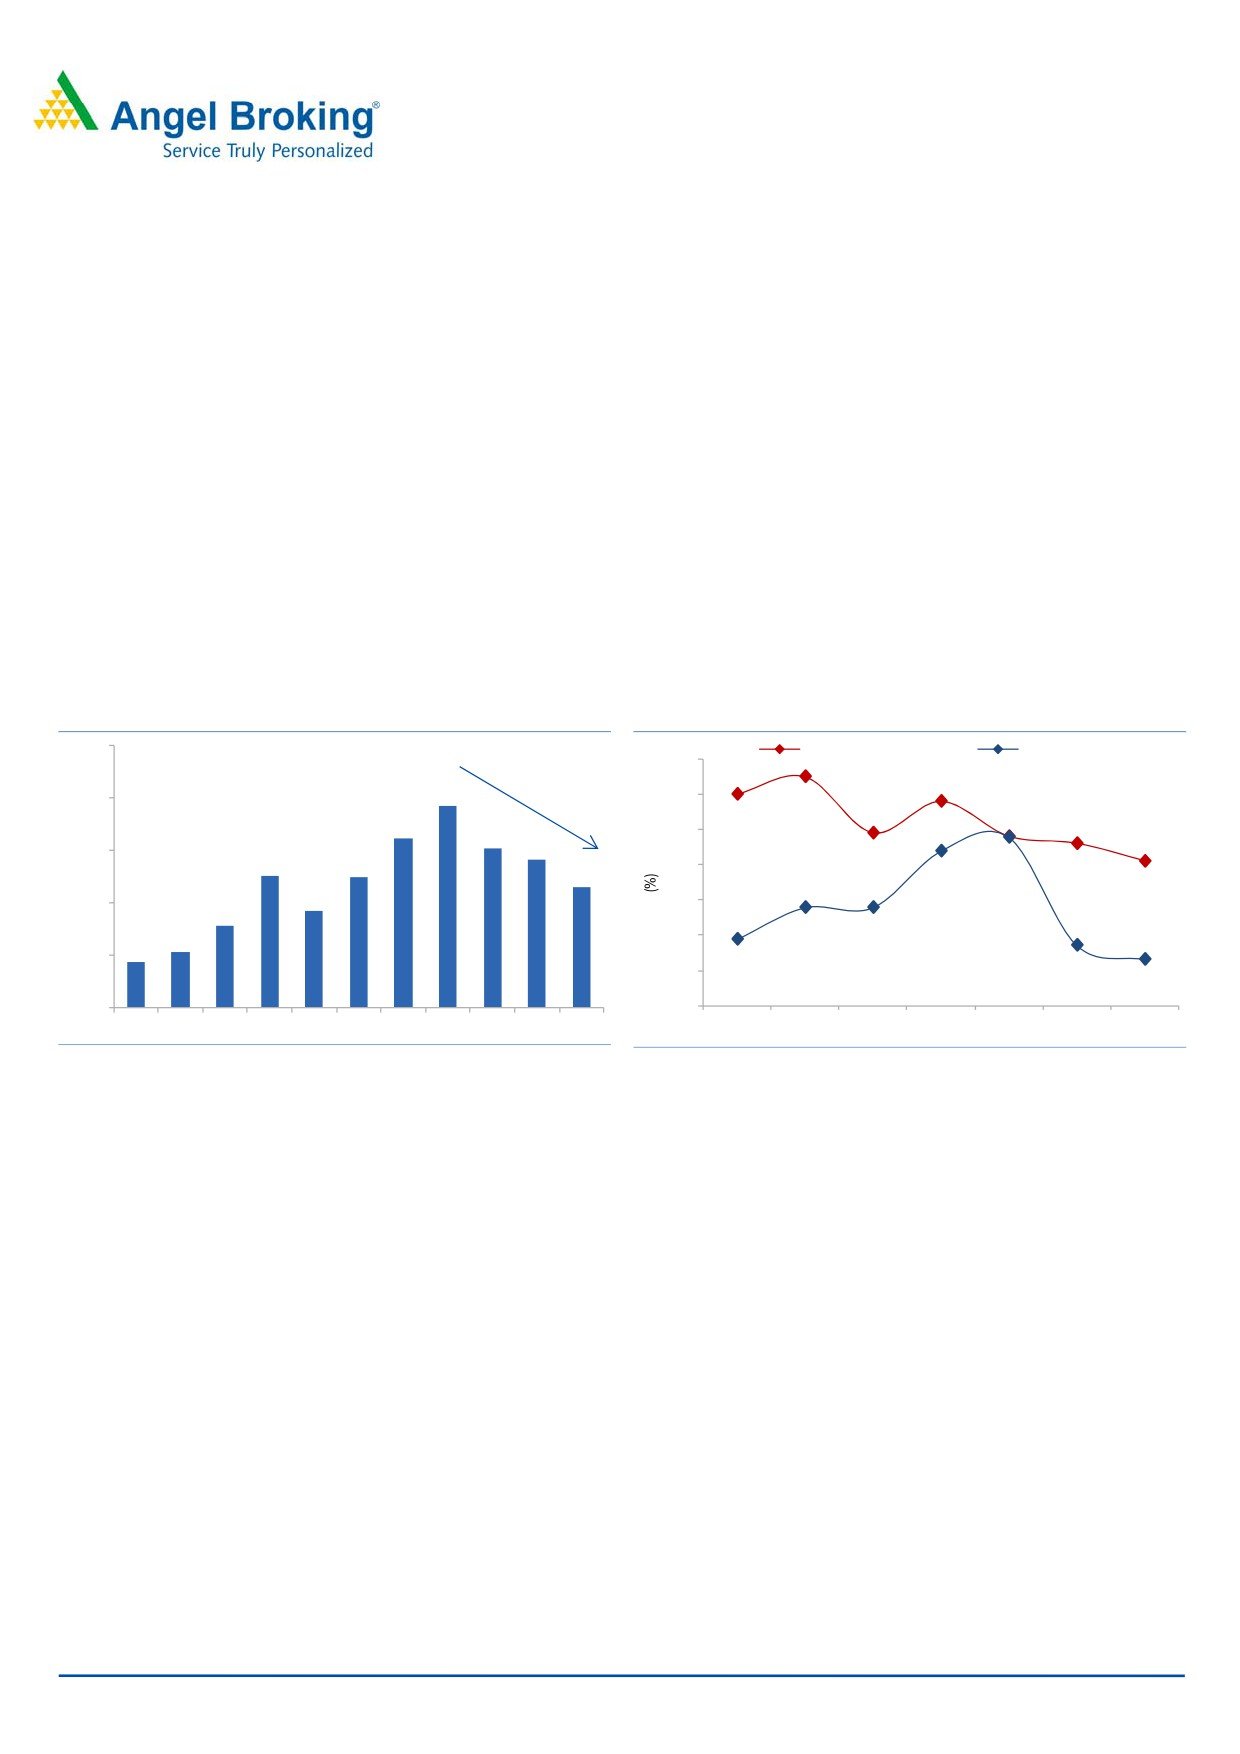
A lot of macro factors are falling in place to create the right conditions for the
markets to rally in the coming year. Brent crude oil prices have declined ~66%
over the last two years to $33 as against ~$99 at the end of CY2013, resulting in
significant savings for the government. Led by lower crude prices, the net import
bill has reduced at a CAGR of 16% to $115bn in CY2015 as against $192 bn in
CY2012, resulting in a steep decline in the current account deficit.
With these savings, the government has also been able to maintain fiscal
discipline, despite an increase in infrastructure spending. We are already seeing a
strong bid pipeline of `120,000cr from the NHAI and of over `244,000cr from
the defense sector, expected to get tendered over the next
12 months.
Accordingly, we expect uptick in government spending to result in private sector
capex cycle revival. We believe the revival in the investment cycle will be the key to
push the earnings trajectory upwards over the next few years led by the multiplier
effect of infrastructure spending.
Net imports ($ Bn)
Twin deficits on the decline
250
Fiscal Deficit (% of GDP)
CAD (% of GDP)
7.0
6.0
192
200
162
151
5.0
140
150
126
124
4.0
115
92
100
3.0
78
53
2.0
44
50
1.0
-
-
2005 2006 2007
2008
2009 2010 2011 2012 2013 2014 2015
CY2009
CY2010
CY2011
CY2012
CY2013
CY2014
CY2015
Source: Company, Angel Research, Bloomberg
Source: Company, Angel Research, Bloomberg
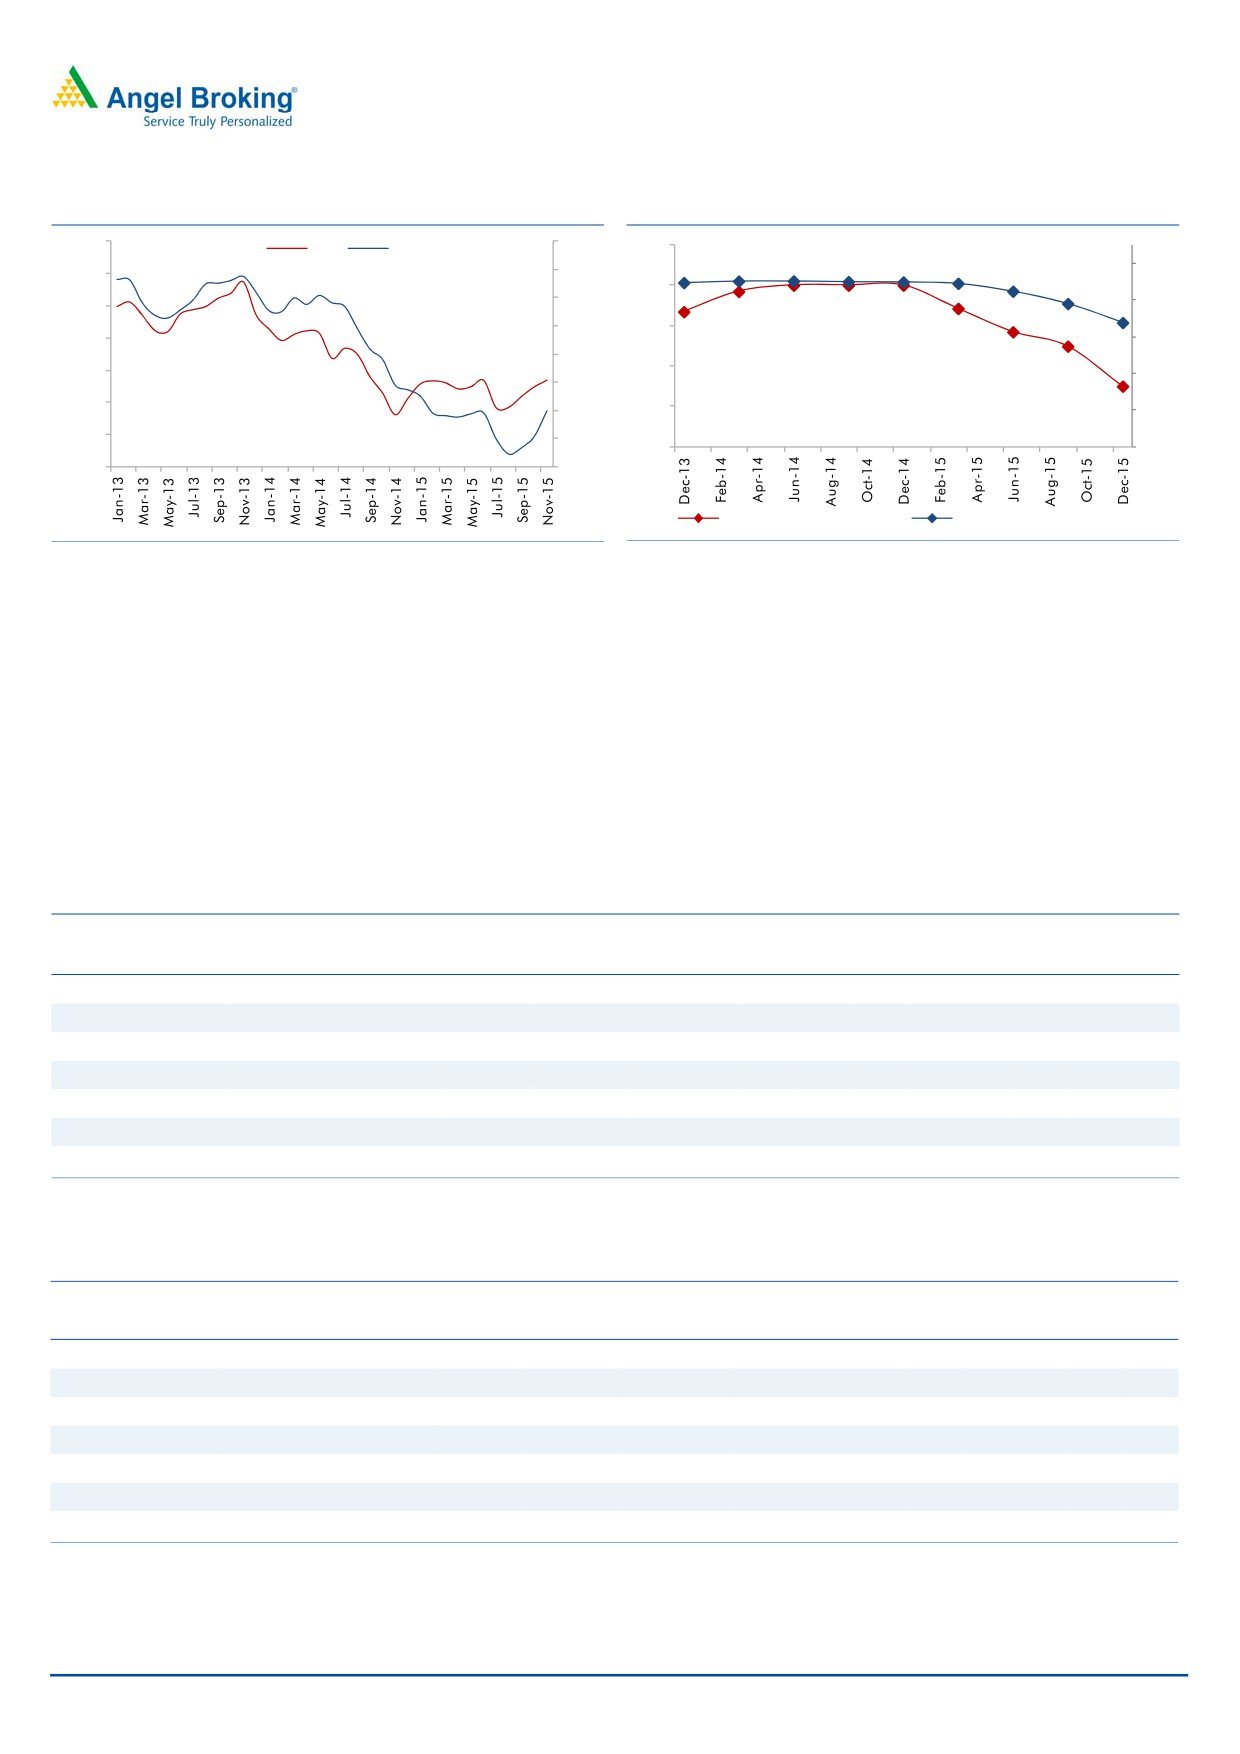
Inflation too has been on a firm downtrend with the CPI averaging 4.8% between
Jan-Nov CY2015, as against 6.7% in CY2014, while the WPI has remained
negative. Despite a seasonal uptick in inflation, lower crude prices and sufficient
foodgrains stocks, will help keep overall inflation on the downtrend. With inflation
under check, we believe the RBI will have enough headroom to reduce policy
rates further. Also with banks now beginning to transmit these lower rates, we
expect lending rates to decline by ~100-125bps over the coming year, acting as
a strong catalyst for earnings growth in CY2016.
With growth expected to pick up, India is in fact the best placed among emerging
economies to continue attracting higher fund inflows over the long term as China
continues to grapple with a slowdown in economy and lower commodity prices
will hurt Brazil and Russia. Confidence among domestic investors also continues
to remain strong with strong mutual fund inflows of over `70,000cr in CY2015.
Please refer to important disclosures at the end of this report
1
Top Picks Report | January 2016
Inflation trajectory firmly on the downtrend
Large headroom for further cuts in lending rates
14.0
10.0
8.5
CPI
WPI
1
0.2
10.3
10.3
10.2
10.2
10.2
10.5
12.0
8.0
10.1
8.0
9.9
6.0
9.7
10.0
10.0
8.0
8.0
8.0
7.9
4.0
7.5
8.0
7.7
7.7
9.5
2.0
7.4
7.0
6.0
7.2
9.0
0.0
4.0
6.5
(2.0)
6.8
8.5
2.0
(4.0)
6.0
8.0
-
(6.0)
RBI Average Policy Rate (%)
Banks Base Rate Average (%)
Source: Angel Research, Bloomberg
Source: Angel Research, Bloomberg
Within large caps we continue to like sectors where earnings growth continues to
remain strong such as automobiles and IT. With falling rates and huge under-
penetration, we believe retail finance companies, especially players focused on
housing finance, are also likely to perform well. From a bottom-up perspective, we
continue to like select emerging midcap companies with strong brands,
entrepreneurial success and healthy growth outlook. We expect Sensex earnings to
increase at a CAGR of 17% over FY2016-18 to ~`1,993. Based on our estimates
our one year Sensex target works out to 31,500, implying a 24% upside from the
current levels.
Large Cap
EPS
PER
EV/Sales
ROE
Company
Sector
Rating
CMP (`) Target (`) Upside (%) FY16 FY17 FY16 FY17 FY16 FY17 FY16 FY17
Amara Raja
Auto & Auto Ancill. Buy
862
1,040
20.6
28.8
37.1
29.9
23.2
3.0
2.4
23.4
24.1
Ashok Leyland
Auto & Auto Ancill. Buy
93
111
19.9
3.4
4.7
27.2
19.7
1.4
1.2
17.7
22.2
HCL Tech^
IT
Buy
840
1,132
34.7
55.8
62.9
15.1
13.4
2.4
1.9
23.0
19.8
HDFC Bank
Financials
Buy
1,065
1,262
18.5
49.3
61.0
21.6
17.4
-
-
18.5
19.7
Infosys
IT
Buy
1,069
1,306
22.1
56.4
63.7
19.0
16.8
3.3
2.9
20.4
19.8
Larsen & Toubro
Construction
Buy
1,240
1,646
32.8
61.5
65.6
20.2
18.9
2.0
1.7
13.4
14.0
LIC Housing Finance Financials
Buy
500
592
18.4
33.0
40.2
15.2
12.4
-
-
19.7
20.5
Source: Angel Research
Mid Cap
EPS
PER
EV/Sales
ROE
Company
Sector
Rating
CMP (`) Target (`) Upside (%) FY16 FY17 FY16 FY17 FY16 FY17 FY16 FY17
Blue Star
Capital Goods
Buy
377
439
16.5
13.7
17.2
27.5
22.0
1.0
0.9
26.1
25.4
Garware Wall RopesOthers
Buy
411
473
15.0
24.9
29.6
16.5
13.9
1.1
0.9
14.6
14.9
Jagran Prakashan Media
Accumulate
169
189
12.0
8.9
9.9
19.0
17.1
2.4
2.2
20.9
20.4
Navkar Corp.
Others
Buy
207
265
28.1
5.6
5.9
36.7
35.2
8.9
7.6
6.3
6.1
Radico Khaitan
Others
Buy
112
156
39.3
5.7
7.1
19.6
15.7
1.4
1.3
8.3
9.6
Siyaram Silk Mills Others
Buy
1,176
1,354
15.2
89.9
104.1
13.1
11.3
0.8
0.7
17.9
17.8
Surya Roshni
Others
Buy
165
201
21.5
14.7
18.3
11.3
9.0
0.5
0.5
9.7
11.0
Source: Angel Research
January 7, 2016
2
Top Picks Report | January 2016
Top Picks - Large Cap
January 7, 2016
3
Top Picks Report | January 2016
Stock Info
Amara Raja Batteries
CMP
862
Amara Raja Batteries Ltd (ARBL) is the second largest lead acid storage battery
TP
1,040
manufacturer. ARBL has been outpacing market leader Exide (ARBL grew 24%
Upside
21%
CAGR over FY2010-15 as compared to Exide's growth of 13%), leading to
Sector
Auto Ancillary
market share improving from 25% in FY10 to about current 35% . ARBL's
outperformance is mainly due to of ducts developed with from global battery
Market Cap (` cr)
14,728
leader Johnson Controls Inc (which also holds 26% stake in ARBL).
Beta
0.8
With the automotive OEM policy of having multiple vendors and a strong
52 Week High / Low
1,132 / 778
brand recall in the replacement segment, ARBL is well poised to further gain
market share. Given the economic recovery and market share gains, 18% over
3 year-Chart
the next two years as against industry growth of 10-12%.
1,200
ARBL is a well diversified auto ancillary player having presence across the
1,000
automotive and the industrial segment and a broad OEM as well as
800
replacement customer base. We believe ARBL is a high quality stock to play
600
the auto sector revival. We assign a P/E multiple of 28x to FY2017E earnings
400
and arrive at a target price of `1,040/share.
200
Key Financials
0
Y/E
Sales
OPM PAT EPS ROE P/E P/BV EV/EBITDA EV/Sales
March
(` cr)
(%)
(` cr)
(`)
(%)
(x)
(x)
(x)
(x)
FY2016E
4,892
17.4
493
28.8
23.4
29.9
7.0
17.3
3.0
FY2017E
5,871
17.6
634
37.1
24.1
23.2
5.6
14.0
2.4
Source: Company, Angel Research
Stock Info
Ashok Leyland
CMP
93
Ashok Leyland Ltd (ALL) is the second largest medium and heavy commercial
TP
111
vehicle (MHCV) manufacturer in the country, commanding a market share of
Upside
19%
about 28%. The MHCV industry is expected to remain in an uptrend (we
expect 15% growth over the next two years) given the better economic growth,
Sector
Automobile
improvement in fleet operators profitability on account of firm freight rates and
Market Cap (` cr)
26,339
decline in diesel prices and increased infrastructure investments.
Beta
1.2
In order to reduce cyclicality, ALL is also focusing on increasing light
52 Week High / Low
100 /56
commercial vehicles (LCVs) and exports. ALL-Nissan JV developed LCV - "Dost"
has been received well and has captured a market share of 6% within three years
3 year-Chart
of its launch. Also, ALL is targeting new markets in Africa and Middle East to
120
increase export contribution from the current 15% to 33% over the next five years.
100
ALL's margins are likely to improve by 400bp yoy over FY2015-17 period on
80
account of double-digit growth in MHCVs and reduced discounting.
60
We are positive on ALL, given the cyclical upturn in MHCVs and additional
40
growth avenues. We assign a multiple of 13x to FY2017E EBIDTA to arrive at
20
a target price of `111/share.
0
Key Financials
Y/E
Sales
OPM PAT EPS ROE P/E P/BV EV/EBITDA EV/Sales
March
(` cr)
(%)
(` cr)
(`)
(%)
(x)
(x)
(x)
(x)
FY2016E
17,995
11.4
979
3.4
17.7
27.2
4.8
13.7
1.4
FY2017E
21,544
11.6
1,331
4.7
22.2
19.7
4.4
11.0
1.2
Source: Company, Angel Research
January 7, 2016
4
Top Picks Report | January 2016
Stock Info
HCL Technologies
CMP
840
Healthy pipeline: In terms of order flow in FY2015, HCL Tech has signed 58
TP
1,132
transformational engagements with US$5bn+ of TCV. During 1QFY2016, the
Upside
35%
company has signed in excess of US$1bn worth of orders and has indicated
Sector
IT
that its order book is 10% higher than its highest order book. These bookings
saw significant momentum driven by Next-gen ITO, Engineering Services
Market Cap (` cr)
118,439
Outsourcing, Digital and Modern Apps deals, each of which had a component
Beta
0.6
of new technology constructs like Digitalization, Cloud etc.
52 Week High / Low
1,058 / 747
Robust outlook: We expect HCL Tech to post a USD and INR revenue CAGR of
13.0% and 13.2%, respectively, over FY2015-17E. On the operating front,
3 year-Chart
HCL Tech's EBIT margin has been around 22.3% in FY2015, a dip of 185bp
1,200.0
over the previous financial year. Going ahead, the Management expects EBIT
1,000.0
margins to sustain at 21-22%. We expect the EBIT and PAT to post a 12.9%
800.0
and 10.6% CAGR, respectively, over FY2015-17E.
600.0
Outlook and Valuations: At current valuations, the stock is attractively valued
400.0
and hence we maintain our buy with a price target of `1,132.
200.0
Key Financials
0.0
Y/E
Sales
OPM PAT EPS ROE P/E P/BV EV/EBITDA EV/Sales
March
(` cr)
(%)
(` cr)
(`)
(%)
(x)
(x)
(x)
(x)
FY2016E
42,038
23.2
7,869
55.8
23.0
15.1
3.5
10.4
2.4
FY2017E
47,503
23.5
8,879
62.9
19.8
13.4
2.7
8.2
1.9
Source: Company, Angel Research
Stock Info
HDFC Bank
CMP
1,065
Strong capital adequacy, expanding network, to sustain traction in market
TP
1,262
share: HDFC Bank’s capital adequacy ratio as of 2QFY2016 stood strong at
Upside
19%
15.5%, with Tier1 ratio at 12.8%, which positions the bank to continue on its
growth path and increase its market share.
Sector
Financials
Market Cap (` cr)
268,997
Asset quality rock-solid: The bank has been able to maintain its asset quality
consistently. Asset quality continued to remain healthy with the Gross NPA
Beta
0.89
ratio and the Net NPA ratio at 0.91% and 0.25%, respectively, as of
52 Week High / Low
1,128 / 932
2QFY2016, in a challenging macro environment.
Outlook: The bank’s credit and deposit growth continues to beat the industry
3 year-Chart
growth rate, driven by dominant market position in most retail business,
1,200
healthy CASA and continued network expansion. This provides strong visibility
for robust 20% earnings trajectory, coupled with high quality of earnings, and
1,000
its focus on high quality retail business as well as strategic focus on short-term
800
highly rated corporate business. This in our view justifies a premium valuation
multiple. At the current market price, the bank is trading at 3.2x FY2017E
600
ABV. We recommend a Buy rating on the stock, with a target price of `1,262.
Key Financials
400
Y/E
Op. Inc NIM
PAT
EPS ABV ROA ROE
P/E
P/ABV
March
(` cr)
(%)
(` cr)
(`)
(`)
(%)
(%)
(x)
(x)
FY2016E
38,309
4.3
12,363
49.3
285.4
1.9
18.5
21.6
3.7
FY2017E
47,302
4.3
15,302
61.0
332.2
1.9
19.7
17.4
3.2
Source: Company, Angel Research
January 7, 2016
5
Top Picks Report | January 2016
Stock Info
Infosys
CMP
1,069
Guidance - to achieve a 10-12% CC growth in FY2016: During 2QFY2016
TP
1,306
Infosys has reinforced its USD revenue growth guidance of 10-12% on CC
Upside
22%
basis in FY2016; it has decreased its growth guidance for the current financial
Sector
IT
year from 7.2%-9.2% in US$ terms (given in 1QFY2016) to 6.4%-8.4% in US$
terms. This change in the dollar revenue is mainly to factor in the anticipated
Market Cap (` cr)
245,647
currency movement. We expect the company to post ~10.7% USD revenue
Beta
0.7
growth in FY2016.
52 Week High / Low
1,219 / 933
Aims to be US$20bn company by FY2020: The company expects its revenue
to rise to US$20bn by FY2020, up from US$8.7bn now, as it focuses on
3 year-Chart
acquisitions and win more new technology services, implying a 14% CAGR
1,400
over the period. Over the near term, we expect Infosys to post a 10.7% USD
1,200
revenue growth in FY2016. Over FY2015-17E, we expect USD and INR
1,000
revenue to grow at a CAGR of 10.9% and 12.1%, respectively.
800
Outlook and Valuations: The stock trades at current valuations of 16.8x FY2017E
600
earnings. We recommend a Buy on the stock with a price target of `1,306.
400
Key Financials
200
Y/E
Sales
OPM PAT EPS ROE P/E P/BV EV/EBITDA EV/Sales
0
March
(` cr)
(%)
(` cr)
(`)
(%)
(x)
(x)
(x)
(x)
FY2016E
60,250
27.0
12,955
56.4
20.4
19.0
3.9
12.4
3.3
FY2017E
66,999
28.0
14,629
63.7
19.8
16.8
3.3
10.2
2.9
Source: Company, Angel Research
Stock Info
Larsen & Toubro
CMP
1,240
L&T's management sees a bid pipeline of `3,70,000cr, which are at different
TP
1,646
stages of awarding. Considering the bid-pipeline and its presence across sub-
Upside
33%
verticals, it should attain its 5-7% order inflow growth guidance for FY2016E.
L&T as of 2QFY2016-end, is sitting on order book of `2,44,097cr, which
Sector
Infrastructure
gives revenue visibility for 30+ months. Considering its huge order book, we
Market Cap (` cr)
112,584
expect L&T to report 12.5% yoy top-line growth for FY2016E.
Beta
1.2
With legacy Hydro-carbons projects in Middle-East nearing completion, we
52 Week High / Low
1,893/1,237
expect Hydro-carbons business to show signs of turn-around by 4QFY2016.
Accordingly, consol. EBITDA margins could expand from here-on.
3 year-Chart
Standalone D/E ratio (2QFY2016) stands at 0.41x. Divestment of non-
2,000
strategic holdings, further equity infusion in infra projects and listing of L&T
1,800
InfoTech would address the IDPL equity requirements up to certain extent.
1,600
Ascribing separate values to parent business (on P/E basis) and investments in
1,400
subsidiaries (using P/E, P/BV and M-cap basis), we arrive at FY2017E based
1,200
Target price of `1,646. At the current market price of `1,257, standalone
1,000
entity is trading at implied P/E multiple of 12x (FY2017E), which is attractive.
800
We are of the view that L&T is a proxy play for investors wanting to ride on
600
Indian infrastructure growth story. We recommend a Buy on the stock.
Key Financials
Y/E
Sales
OPM PAT EPS ROE P/E P/BV EV/EBITDA EV/Sales
March
(` cr)
(%)
(` cr)
(`)
(%)
(x)
(x)
(x)
(x)
FY2016E
64,148
11.5
5,776
61.5
13.4
20.2
2.0
17.5
2.0
FY2017E
73,241
11.7
6,155
65.6
14.0
18.9
1.9
15.2
1.7
Source: Company, Angel Research
January 7, 2016
6
Top Picks Report | January 2016
Stock Info
LIC Housing Finance
CMP
500
Significant under penetration of mortgages in India: India is expected to
TP
592
witness a robust housing finance growth going forward as the mortgage
Upside
18%
penetration in India remains at very low levels at 8% to GDP as compared to
Sector
Financials
the developed countries where it is in the range of 60-100%.
Market Cap (` cr)
25,210
NIM expansion visible: LIC Housing Finance is able to raise funds from low-
Beta
1.35
cost NCDs due to its strong AAA credit rating and backing by strong
52 Week High / Low
526 / 389
promoters like LIC. In a declining interest rate environment, NBFC's like LIC
Housing are well-placed to increase margins in our view.
3 year-Chart
Outlook: Despite competition in mortgages, volume growth in the individual
600
loans segment remains fairly strong. LICHF continues to grow its retail loan
500
book at a healthy pace with healthy asset quality. We expect the company to
post a healthy loan book CAGR of 18.7% over 2015-17E which is likely to
400
reflect in an earnings CAGR of 20.5%, over the same period. At the current
300
market price, it is trading at 2.4x FY2017E ABV. We recommend a Buy rating
200
on the stock, with a target price of `592.
100
Key Financials
0
Y/E
Op. Inc NIM
PAT
EPS ABV ROA ROE
P/E
P/ABV
March
(` cr)
(%)
(` cr)
(`)
(`)
(%)
(%)
(x)
(x)
FY2016E
3,101
2.5
1,664
33.0
176.7
1.4
19.7
15.2
2.8
FY2017E
3,745
2.5
2,029
40.2
207.6
1.4
20.5
12.5
2.4
Source: Company, Angel Research
January 7, 2016
7
Top Picks Report | January 2016
Top Picks - Mid Cap
January 7, 2016
8
Top Picks Report | January 2016
Stock Info
Blue Star
CMP
377
BSL is one of the largest air-conditioning companies in India. With a mere 3%
TP
439
penetration level vs 25% in China, the overall outlook for the room air-
Upside
17%
conditioner (RAC) market in India is favourable.
Sector
Cons. Durable
BSL’s RAC business has been outgrowing the industry by ~10% points over the
Market Cap (` cr)
3,388
last few quarters, resulting in the company consistently increasing its market
Beta
0.7
share (~7% in FY2014 to 10% at present). This has resulted in CPD's share in
52 Week High / Low
398 / 274
overall revenues increasing from~23% in FY2010 to ~42% in FY2015
(expected to improve to ~48% in FY2018E). With strong brand equity and
3 year-Chart
higher share in split ACs, we expect the CPD to continue to drive growth.
500
Aided by increasing contribution from the CPD, we expect the overall top-line
400
to post a revenue CAGR of 11.2% over FY2015-18E and margins to improve
300
from 5.3% in FY2015 to 7.1% in FY2018E. Moreover, the proposed merger
with Blue Star Infotech will provide cash influx and thus strengthen the balance
200
sheet. We maintain our Buy recommendation on the stock.
100
Key Financials
-
Y/E
Sales
OPM PAT EPS ROE P/E P/BV EV/EBITDA EV/Sales
March
(` cr)
(%)
(` cr)
(`)
(%)
(x)
(x)
(x)
(x)
FY2016E
3,548
6.3
123
13.7
26.1
27.5
6.9
16.6
1.0
FY2017E
3,977
6.9
164
17.2
25.4
22.0
4.5
13.0
0.9
Source: Company, Angel Research
Stock Info
Garware Wall Ropes
CMP
411
We expect Garware Wall Ropes (GWRL) to report a healthy top-line CAGR of
TP
473
~11% over FY2015-17E, on the back of higher growth in exports. Going
Upside
15%
forward, we expect GWRL to report export sales CAGR of ~23% over FY2015-
Sector
Textile
17E on back of higher demand for aquaculture and sports products globally.
Market Cap (` cr)
899
Going forward, we believe that the company would be able to increase its
Beta
1.0
operating margins owing to (a) easing raw material prices including that of
52 Week High / Low
438/165
High Density Polyethylene, Polyethylene, Nylon etc. which are crude based raw
materials, and (b) higher contribution of exports which is a high margin
3 year-Chart
business.
500
GWRL has been consistently repaying debt over the past four years, resulting
400
in debt having come down from ~ `140cr in FY2012 to `45cr in FY2015.
Going forward, we believe the company will continue repaying debt with
300
strong cash flows, which in turn will lead to reduction in interest cost. Hence,
200
we recommend a Buy rating on the stock with a target price of `473.
100
Key Financials
0
Y/E
Sales
OPM PAT EPS ROE P/E P/BV EV/EBITDA EV/Sales
March
(` cr)
(%)
(` cr)
(`)
(%)
(x)
(x)
(x)
(x)
FY2016E
861
10.9
54
24.9
14.6
16.5
2.5
9.3
1.1
FY2017E
967
10.9
65
29.6
14.9
13.9
2.2
7.9
0.9
Source: Company, Angel Research
January 7, 2016
9
Top Picks Report | January 2016
Stock Info
Jagran Prakashan
CMP
169
We expect JPL to register a net sales CAGR of ~15% over FY2015-17E, on
TP
189
back of (a) strong growth in advertising revenue due to improvement in GDP
Upside
12%
growth, (b) improvement in circulation revenue owing to combination of
Sector
Media
increase in cover price and volume growth.
Market Cap (` cr)
5,518
Further the acquisition of Radio City would also boost the company's revenue
Beta
0.6
going ahead. Radio City has ~20 stations across 7 states in the country and is
second only to ENIL in all its operating circles, ie Delhi, Mumbai, Bengaluru,
52 Week High / Low
172/108
Chennai, Ahmedabad, Hyderabad, Pune and Lucknow. The company covers
~51% (~66mn people) of the total radio population.
3 year-Chart
Raw material prices have been in a declining trend. Thus, considering lower
180
news print costs, healthy sales, and higher margins in the radio business, we
160
expect an adj. net profit CAGR of ~20% over FY2015-17E to `325cr.
140
Considering Dainik Jagran's strong presence in the rapidly growing Hindi
120
markets, we expect JPL to benefit from an eventual recovery in the Indian
100
economy. Hence, we maintain an Accumulate rating on the stock with a target
80
price of stock with a target price of `189.
60
Key Financials
Y/E
Sales
OPM PAT EPS ROE P/E P/BV EV/EBITDA EV/Sales
March
(` cr)
(%)
(` cr)
(`)
(%)
(x)
(x)
(x)
(x)
FY2016E
2,170
27.2
290
8.9
20.9
19.0
4.0
8.8
2.4
FY2017E
2,355
26.2
325
9.9
20.5
17.1
3.5
8.4
2.2
Source: Company, Angel Research
Stock Info
Navkar
CMP
207
NCL is one of the largest and one of the three CFS at JNPT with rail
TP
265
connectivity, helping garner high market share at the port. NCL is in a massive
Upside
28%
expansion mode where it is increasing its capacity by 234% to 1,036,889
Sector
Logistics
TEUS at JNPT and coming up with an ICD at Vapi (with Logistics Park).
Market Cap (` cr)
2,951
The ICD with rail link should benefit from first mover advantage in a region
Beta
0.6
that has huge market potential and accounts for ~27% of volumes at JNPT.
52 Week High / Low
221 / 151
The ICD should be able to capture the EXIM volumes from the region through
rail link that till now was being custom cleared at JNPT (Import) or being
transported via road and consolidated at JNPT (Export). Although, South
3 year-Chart
Gujarat volume will now head straight to Vapi ICD, the company can now
220
cater to bulk commodities and domestic traffic that it had been rejecting owing
200
to capacity constraints at CFS.
180
We expect NCL to successfully use its rail advantage and scale up its
utilisations at both JNPT and Vapi ICD. We have a Buy rating on the stock.
160
Key Financials
140
Y/E
Sales
OPM PAT EPS ROE P/E P/BV EV/EBITDA EV/Sales
120
March
(` cr)
(%)
(` cr)
(`)
(%)
(x)
(x)
(x)
(x)
FY2016E
365
38.3
80
5.6
6.3
36.7
2.3
23.2
8.9
FY2017E
436
37.5
84
5.9
6.1
35.2
2.2
20.3
7.6
Source: Company, Angel Research
January 7, 2016
10
Top Picks Report | January 2016
Stock Info
Radico Khaitan
CMP
112
The IMFL segment is under penetrated. Going forward, increase in income
TP
156
levels would lead to higher growth in IMFL brands. RKL has strong brands in
Upside
39%
the premium liquor category which reported a CAGR of ~26% over the last
seven-year period. We expect the growth momentum to continue.
Sector
Breweries & Distilleries
Market Cap (` cr)
1,485
We expect the price of ENA, a key raw material, to remain stable and
potentially even decline going forward due to higher sugar production and
Beta
0.8
lower demand for ethanol from Indian oil marketing companies
52 Week High / Low
131/78
We expect a significant hike in liquor prices in the coming financial year as
there haven't been any significant ones in recent times. Also, we believe that
3 year-Chart
industry leader - United Spirit would shift focus on profitability over volume
170
growth considering the debt on its Balance Sheet, which in turn, would lead to
150
increased scope for other liquor companies to hike prices.
130
RKL is trading at 1-year forward EV/Sales multiple of 1.3x, which is at huge
discount to its close peer, United Spirits (4.6x). We have a Buy rating on the
110
stock and target price of and target price of `156 (22x FY2017E EPS).
90
Key Financials
70
Y/E
Sales
OPM PAT EPS ROE P/E P/BV EV/EBITDA EV/Sales
March
(` cr)
(%)
(` cr)
(`)
(%)
(x)
(x)
(x)
(x)
FY2016E
1,565
12.2
75
5.7
8.3
19.6
1.7
11.8
1.4
FY2017E
1,687
13.0
95
7.1
9.6
15.7
1.5
10.1
1.3
Source: Company, Angel Research
Stock Info
Siyaram Silk Mills
CMP
1,176
SSML has strong brands which cater to premium as well as popular mass
TP
1,354
segments of the market. Further, in FY2014, SSML entered the ladies' salwar
Upside
15%
kameez and ethnic wear segment. Going forward, we believe that the
Sector
Textile
company would be able to leverage its brand equity and continue to post
strong performance.
Market Cap (` cr)
1,102
The company has a nationwide network of about 1,600 dealers and business
Beta
0.8
partners. It has a retail network of 160 stores and plans to add another 300-
52 Week High / Low
1,400/857
350 stores going forward. Further, the company's brands are sold across
3,00,000 multi brand outlets in the country.
3 year-Chart
Going forward, we expect SSML to report a net sales CAGR of ~10% to
1,200
~`1,815cr and adj.net profit CAGR of ~11% to `98cr over FY2015-17E on
1,000
back of market leadership in blended fabrics, strong brand building, wide
distribution channel, strong presence in tier II and tier III cities and emphasis
800
on latest designs and affordable pricing points. At the current market price,
600
SSML trades at an inexpensive valuation. We have a Buy rating on the stock
400
and target price of stock and target price of stock and target price of `1,354.
200
Key Financials
0
Y/E
Sales
OPM PAT EPS ROE P/E P/BV EV/EBITDA EV/Sales
March
(` cr)
(%)
(` cr)
(`)
(%)
(x)
(x)
(x)
(x)
FY2016E
1,636
11.5
84
89.9
17.9
13.1
2.2
7.0
0.8
FY2017E
1,815
11.5
98
104.1
17.8
11.3
1.9
6.3
0.7
Source: Company, Angel Research
January 7, 2016
11
Top Picks Report | January 2016
Stock Info
Surya Roshni
CMP
165
We expect SRL to benefit from the structural shift in the lighting industry
TP
201
towards LED lighting, which is expected to post CAGR of 28% over FY2015E-21E.
Upside
21%
SRL is the 2nd largest lighting company in India with a market share of ~ 25%. With
Sector
Con. Durable
growing demand for LEDs, SRL would be a key beneficiary, given that "Surya" brand
is well recognized and has superior reach comprising of 2 lakh plus retailers.
Market Cap (` cr)
725
Beta
1.7
SRL's other business, Steel Pipes, entails low profitability and has higher debt,
having resulted in high overall debt/equity. The Lighting business' contribution
52 Week High / Low
182 / 101
to overall top-line has increased from 30% in FY2012 to 40% in FY2015. The
latter commands higher margins (10.7%) vs. the steel business (2.9%) and
3 year-Chart
contributes 70% to the profitability.
200
180
In a declining interest rate scenario, we expect SRL's interest expense to be
160
lower and we expect the company to use its healthy cash flows from the
140
Lighting business to slowly reduce its debt.
120
100
Since our December Top Picks recommendation, the stock has generated
80
60
returns of 23.0% and at CMP, SRL trades at 9.0x its FY2017E earnings. We
40
maintain our Buy recommendation on SRL with revised target of `201.
20
-
Key Financials
Y/E
Sales
OPM PAT EPS ROE P/E P/BV EV/EBITDA EV/Sales
March
(` cr)
(%)
(` cr)
(`)
(%)
(x)
(x)
(x)
(x)
FY2016E
2,992
8.1
64
14.7
9.7
11.3
1.0
6.4
0.5
FY2017E
3,223
8.4
80
18.3
11.0
9.0
1.0
5.7
0.5
Source: Company, Angel Research
January 7, 2016
12
Top Picks Report | January 2016
Macro watch
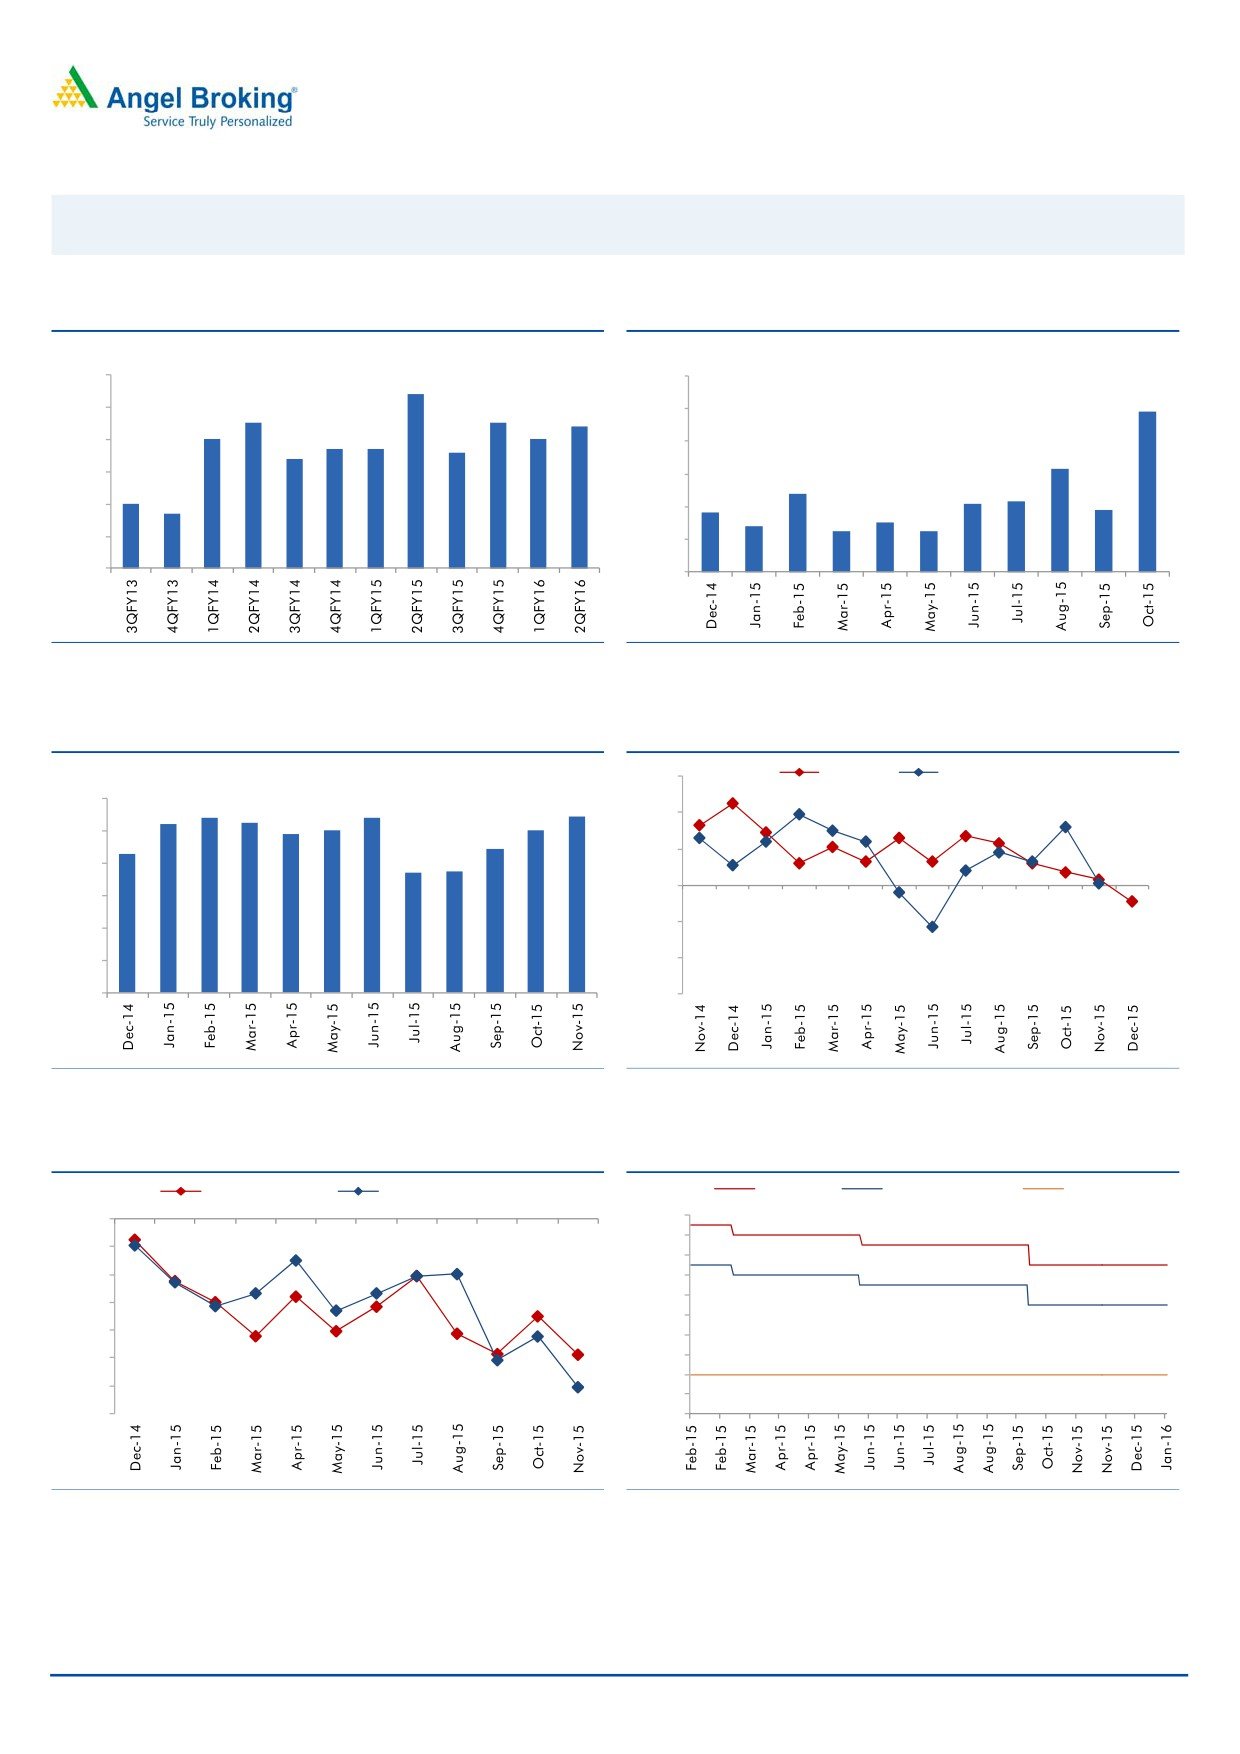
Exhibit 1: Quarterly GDP trends
Exhibit 2: IIP trends
(%)
(%)
9.0
8.4
12.0
9.8
8.0
7.5
7.5
7.4
10.0
7.0
7.0
6.7
6.7
6.6
7.0
6.4
8.0
6.3
6.0
6.0
4.8
5.0
4.2
4.3
4.7
3.6
3.8
5.0
4.0
2.8
3.0
2.5
2.5
4.0
2.0
3.0
-
Source: CSO, Angel Research
Source: MOSPI, Angel Research
Exhibit 3: Monthly CPI inflation trends
Exhibit 4: Manufacturing and services PMI
(%)
56.0
Mfg. PMI
Services PMI
6.0
5.4
5.4
5.4
5.2
5.3
4.9
5.0
5.0
54.0
5.0
4.4
4.3
52.0
3.7
3.7
4.0
50.0
3.0
48.0
2.0
1.0
46.0
-
44.0
Source: MOSPI, Angel Research
Source: Market, Angel Research; Note: Level above 50 indicates expansion
Exhibit 5: Exports and imports growth trends
Exhibit 6: Key policy rates
Exports yoy growth
Imports yoy growth
Repo rate
Reverse Repo rate
CRR
(%)
(%)
0.0
8.00
7.50
(5.0)
7.00
(10.0)
6.50
6.00
(15.0)
5.50
(20.0)
5.00
(25.0)
4.50
4.00
(30.0)
3.50
(35.0)
3.00
Source: Bloomberg, Angel Research
Source: RBI, Angel Research
January 7, 2016
13
Top Picks Report | January 2016
Global watch
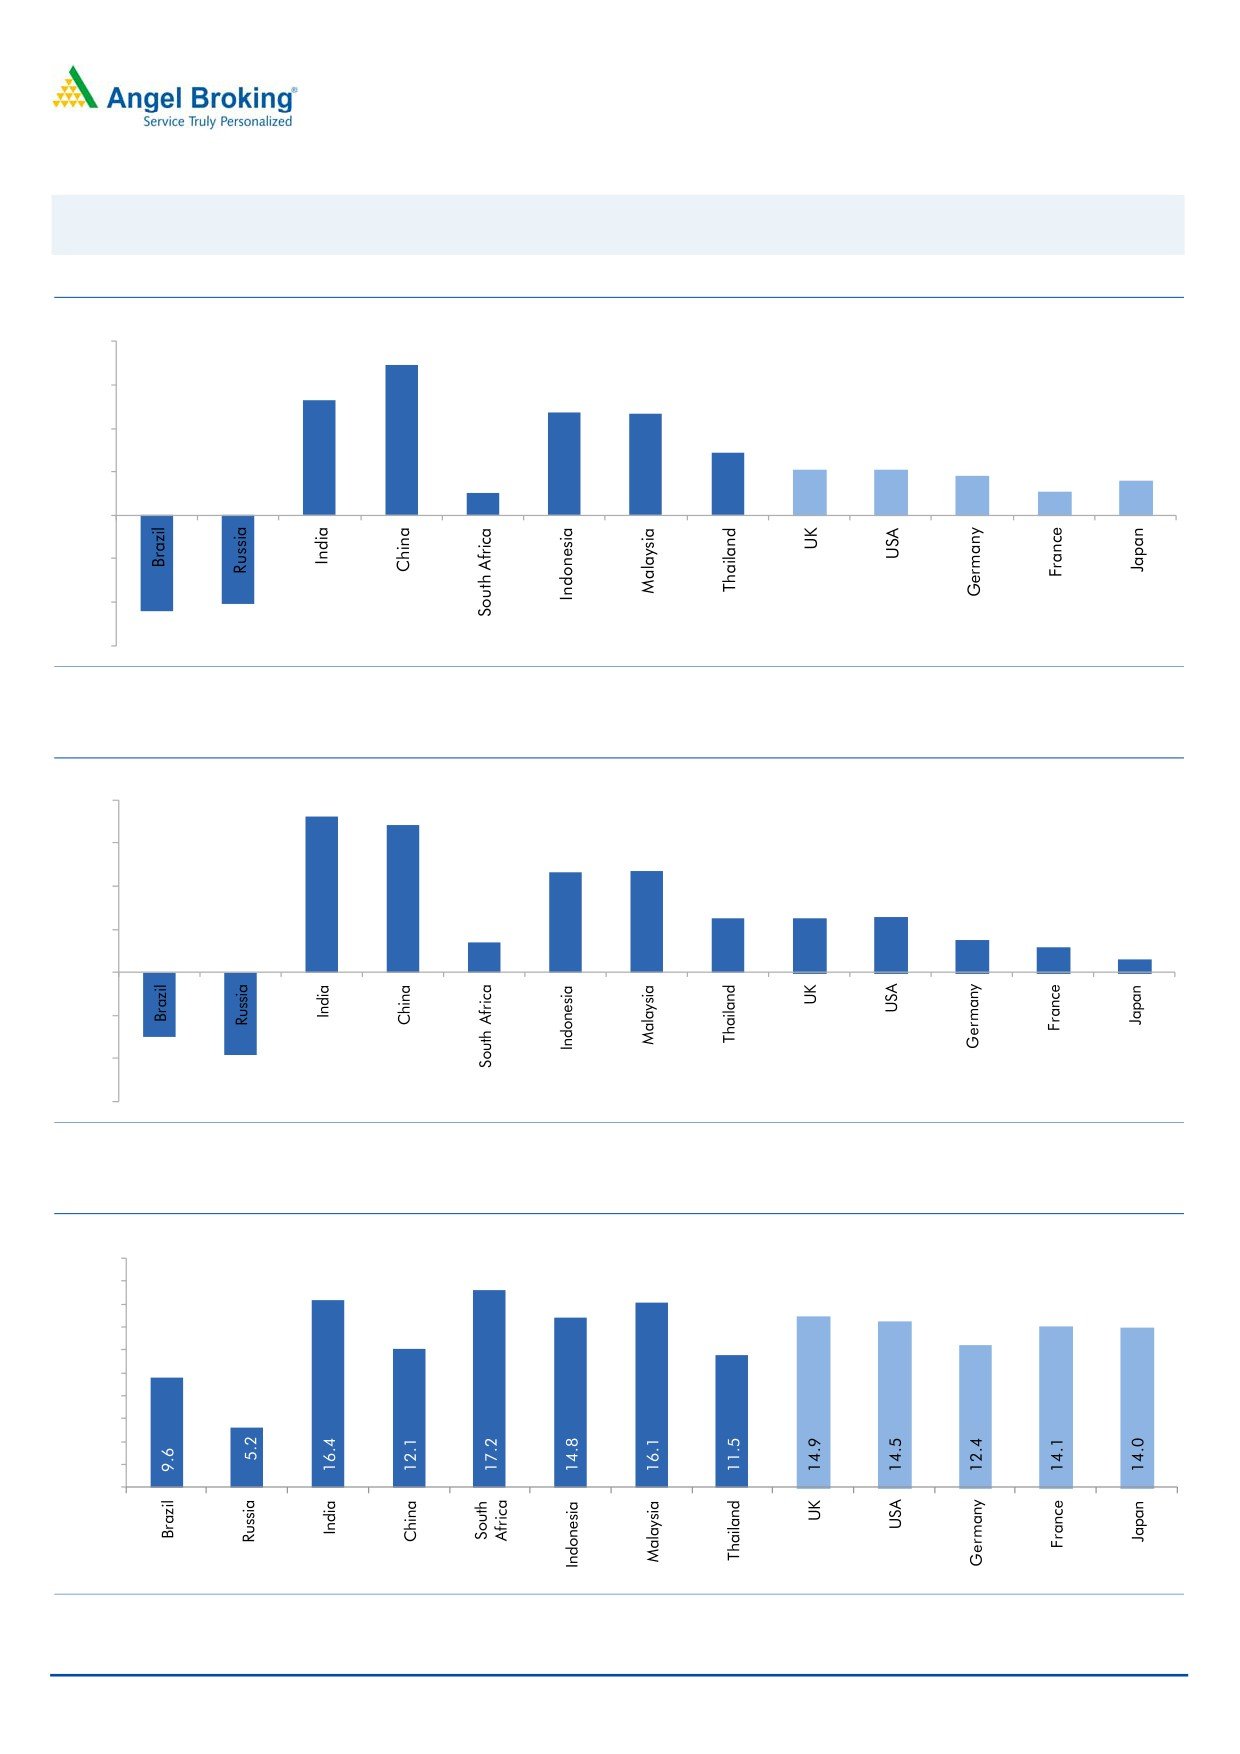
Exhibit 1: Latest quarterly GDP Growth (%, yoy) across select developing and developed countries
(%)
8.0
6.9
6.0
5.3
4.7
4.7
4.0
2.9
2.1
2.1
1.8
1.6
2.0
1.0
1.1
-
(2.0)
(4.0)
(4.1)
(4.5)
(6.0)
Source: Bloomberg, Angel Research
Exhibit 2: 2015 GDP Growth projection by IMF (%, yoy) across select developing and developed countries
(%)
8.0
7.3
6.8
6.0
4.7
4.7
4.0
2.5
2.5
2.6
1.4
1.5
2.0
1.2
0.6
-
(2.0)
(3.0)
(4.0)
(3.8)
(6.0)
Source: IMF, Angel Research
Exhibit 3: One year forward P-E ratio across select developing and developed countries
(x)
20.0
18.0
16.0
14.0
12.0
10.0
8.0
6.0
4.0
2.0
-
Source: IMF, Angel Research
January 7, 2016
14
Top Picks Report | January 2016
Exhibit 4: Relative performance of indices across globe
Returns (%)
Country
Name of index
Closing price
1M
3M
1YR
Brazil
Bovespa
41,773
(7.3)
(5.3)
(16.7)
Russia
Micex
1,749
(2.2)
5.8
18.1
India
Nifty
7,741
(0.5)
(2.6)
(6.6)
China
Shanghai Composite
3,362
(10.1)
1.1
0.7
South Africa
Top 40
44,150
(4.1)
(5.4)
3.3
Mexico
Mexbol
41,691
(3.1)
(2.4)
0.9
Indonesia
LQ45
802
0.9
11.3
(10.6)
Malaysia
KLCI
1,668
(0.5)
2.1
(5.7)
Thailand
SET 50
790
(9.2)
(8.9)
(22.8)
USA
Dow Jones
16,907
(3.3)
0.8
(3.9)
UK
FTSE
6,073
(5.4)
(3.6)
(7.6)
Japan
Nikkei
18,191
(8.8)
4.6
1.9
Germany
DAX
10,214
(9.3)
6.9
3.8
France
CAC
4,480
(5.3)
(3.9)
4.4
Source: Bloomberg, Angel Research
January 7, 2016
15
Top Picks Report | January 2016
Stock Watch
January 7, 2016
16
Stock Watch | January 2016
Company Name
Reco
CMP
Target
Mkt Cap
Sales (` cr)
OPM (%)
EPS (`)
PER (x)
P/BV (x)
RoE (%)
EV/Sales (x)
(`)
Price (`)
(` cr)
FY16E
FY17E
FY16E
FY17E
FY16E
FY17E
FY16E
FY17E
FY16E
FY17E
FY16E
FY17E
FY16E
FY17E
Agri / Agri Chemical
Rallis
Neutral
173
-
3,362
2,097
2,415
14.4
14.4
9.5
11.0
18.2
15.7
3.6
3.1
21.1
21.3
1.6
1.4
United Phosphorus
Buy
442
510
18,940
13,698
15,752
17.6
17.6
32.1
38.5
13.8
11.5
2.7
2.2
21.4
21.3
1.5
1.2
Auto & Auto Ancillary
Ashok Leyland
Buy
93
111
26,339
17,995
21,544
11.4
11.6
3.4
4.7
27.2
19.7
4.8
4.4
17.7
22.2
1.4
1.2
Bajaj Auto
Accumulate
2,486
2,728
71,922
23,695
27,298
21.3
20.4
134.6
151.5
18.5
16.4
5.9
5.0
31.8
30.6
2.6
2.2
Bharat Forge
Accumulate
876
943
20,387
7,867
8,881
20.0
20.3
34.4
41.0
25.5
21.4
4.9
4.1
21.1
20.9
2.7
2.4
Eicher Motors
Accumulate 17,525
19,036
47,588
15,379
16,498
15.6
16.6
473.2
574.8
37.0
30.5
13.7
10.2
36.7
33.2
3.0
2.8
Gabriel India
Neutral
96
-
1,385
1,415
1,544
8.7
9.0
4.6
5.4
21.0
17.9
3.8
3.4
18.1
18.9
1.0
0.8
Hero Motocorp
Accumulate
2,582
2,774
51,554
28,561
31,559
14.7
14.7
151.1
163.2
17.1
15.8
6.6
5.6
38.7
35.6
1.6
1.5
Jamna Auto Industries Neutral
145
-
1,158
1,292
1,486
9.3
9.8
6.0
7.5
24.2
19.3
5.0
4.2
20.7
21.8
1.0
0.8
L G Balakrishnan & Bros Neutral
505
-
792
1,254
1,394
11.6
11.8
35.9
41.7
14.1
12.1
1.9
1.7
13.5
13.8
0.7
0.7
Mahindra and Mahindra Buy
1,224
1,449
76,003
39,031
44,440
13.8
13.9
57.9
67.6
21.1
18.1
3.4
3.0
16.1
16.6
1.6
1.3
Maruti
Neutral
4,480
-
135,318
57,865
68,104
16.4
16.7
176.3
225.5
25.4
19.9
4.9
4.2
19.4
21.2
2.1
1.7
Minda Industries
Neutral
916
-
1,452
2,567
2,965
8.0
8.3
46.1
57.8
19.9
15.8
3.3
2.7
16.7
17.3
0.7
0.6
Motherson Sumi
Accumulate
281
313
37,228
39,343
45,100
8.8
9.1
10.1
12.5
27.9
22.5
8.8
6.9
35.3
34.4
1.0
0.9
Rane Brake Lining
Accumulate
345
366
273
454
511
11.1
11.4
23.8
28.1
14.5
12.3
2.1
1.9
14.2
15.3
0.7
0.7
Setco Automotive
Neutral
41
-
544
594
741
12.7
13.7
1.7
3.2
23.9
12.7
2.5
2.2
10.4
16.9
1.4
1.1
Tata Motors
Accumulate
366
409
105,585
266,022
312,667
12.8
13.1
26.3
38.3
13.9
9.5
1.8
1.5
8.4
12.1
0.6
0.5
TVS Motor
Buy
287
338
13,614
11,569
13,648
7.3
8.7
10.3
16.1
27.8
17.8
6.9
5.4
24.8
30.5
1.2
1.0
Amara Raja Batteries
Buy
862
1,040
14,728
4,892
5,871
17.4
17.6
28.8
37.1
29.9
23.2
7.0
5.6
23.4
24.1
3.0
2.4
Exide Industries
Accumulate
142
162
12,049
6,950
7,784
14.4
14.8
6.6
7.3
21.5
19.4
2.7
2.5
12.6
12.8
1.4
1.3
Apollo Tyres
Accumulate
155
171
7,905
12,146
12,689
16.8
16.0
21.2
19.0
7.3
8.2
1.2
1.1
16.5
13.0
0.7
0.8
Ceat
Neutral
1,069
-
4,326
6,041
6,597
14.1
13.7
99.5
111.9
10.7
9.6
2.1
1.8
19.6
18.5
0.9
0.7
JK Tyres
Neutral
115
-
2,606
7,446
7,669
15.2
14.0
19.6
18.4
5.9
6.2
1.5
1.2
25.2
19.5
0.7
0.6
Swaraj Engines
Neutral
964
-
1,198
552
630
14.2
14.7
44.6
54.1
21.6
17.8
5.0
4.6
23.2
25.6
2.0
1.7
Subros
Neutral
105
-
632
1,268
1,488
11.6
11.9
3.7
6.6
28.5
16.0
1.9
1.7
6.8
11.4
0.8
0.7
Indag Rubber
Neutral
216
-
567
283
329
17.0
17.2
13.0
15.4
16.7
14.0
3.6
3.0
21.8
21.6
1.7
1.4
Banking
Allahabad Bank
Neutral
68
-
4,081
8,569
9,392
2.8
2.9
16.3
27.5
4.2
2.5
0.4
0.31
7.6
11.9
-
-
Axis Bank
Buy
431
630
102,484
26,473
31,527
3.5
3.6
35.7
43.5
12.1
9.9
2.3
2.02
17.9
18.9
-
-
Bank of Baroda
Neutral
149
-
34,251
18,485
21,025
1.9
2.0
13.5
21.1
11.0
7.0
0.9
0.8
7.3
10.6
-
-
Bank of India
Neutral
114
-
9,040
15,972
17,271
1.9
2.0
15.3
33.3
7.5
3.4
0.3
0.3
3.6
7.6
-
-
Canara Bank
Neutral
229
-
12,410
15,441
16,945
2.0
2.1
46.6
70.4
4.9
3.2
0.4
0.4
8.0
11.2
-
-
Dena Bank
Neutral
40
-
2,607
3,440
3,840
2.1
2.3
7.2
10.0
5.6
4.0
0.4
0.3
6.1
7.9
-
-
Federal Bank
Neutral
55
-
9,428
3,477
3,999
3.0
3.0
5.0
6.2
10.9
8.8
1.1
1.0
10.5
11.9
-
-
HDFC
Neutral
1,208
-
190,781
10,358
11,852
3.3
3.3
41.1
47.0
29.4
25.7
5.6
5.1
24.7
24.9
-
-
HDFC Bank
Buy
1,065
1,262
268,997
38,309
47,302
4.3
4.3
49.3
61.0
21.6
17.4
3.7
3.21
18.5
19.7
-
-
ICICI Bank
Buy
250
354
145,363
34,279
39,262
3.3
3.3
21.0
24.4
11.9
10.3
2.0
1.7
14.4
14.7
-
-
January 7, 2016
17
Stock Watch | January 2016
Company Name
Reco
CMP
Target
Mkt Cap
Sales (` cr)
OPM (%)
EPS (`)
PER (x)
P/BV (x)
RoE (%)
EV/Sales (x)
(`)
Price (`)
(` cr)
FY16E
FY17E
FY16E
FY17E
FY16E
FY17E
FY16E
FY17E
FY16E
FY17E
FY16E
FY17E
FY16E
FY17E
IDBI Bank
Neutral
83
-
13,329
9,625
10,455
1.8
1.8
8.5
14.2
9.7
5.8
0.6
0.5
5.9
9.3
-
-
Indian Bank
Neutral
111
-
5,324
6,160
6,858
2.4
2.5
24.5
29.8
4.5
3.7
0.4
0.3
7.7
8.6
-
-
LIC Housing Finance
Buy
500
592
25,210
3,101
3,745
2.5
2.5
33.0
40.2
15.2
12.4
2.8
2.4
19.7
20.5
-
-
Oriental Bank
Neutral
135
-
4,040
7,643
8,373
2.4
2.4
37.2
45.4
3.6
3.0
0.3
0.3
8.2
9.4
-
-
Punjab Natl.Bank
Neutral
110
-
21,590
23,638
26,557
2.8
2.8
17.9
27.2
6.1
4.0
0.6
0.5
8.5
12.0
-
-
South Ind.Bank
Neutral
20
-
2,714
1,965
2,185
2.5
2.5
2.5
3.3
8.1
6.1
0.8
0.7
9.5
11.6
-
-
St Bk of India
Buy
217
283
168,452
82,520
93,299
2.7
2.8
20.0
24.5
10.8
8.9
1.2
1.0
11.5
12.8
-
-
Union Bank
Neutral
143
-
9,848
12,646
14,129
2.3
2.4
31.0
39.1
4.6
3.7
0.5
0.4
9.8
11.4
-
-
Vijaya Bank
Neutral
34
-
2,912
3,536
3,827
1.8
1.9
5.5
6.7
6.1
5.1
0.5
0.5
7.8
8.8
-
-
Yes Bank
Buy
703
921
29,487
7,190
9,011
3.2
3.3
58.2
69.7
12.1
10.1
2.2
1.8
19.2
19.6
-
-
Capital Goods
ACE
Neutral
47
-
467
660
839
4.7
8.2
1.0
3.9
47.2
12.1
1.5
1.3
3.2
11.3
0.9
0.7
BEML
Neutral
1,256
-
5,232
3,277
4,006
6.0
8.9
29.2
64.3
43.0
19.5
2.4
2.2
5.7
11.7
1.7
1.3
Bharat Electronics
Neutral
1,353
-
32,482
7,737
8,634
16.8
17.2
54.0
61.0
25.1
22.2
3.6
3.2
39.3
45.6
3.3
2.8
Voltas
Buy
306
353
10,122
5,363
5,963
8.0
9.1
11.0
13.8
27.8
22.2
4.3
3.7
16.2
17.9
1.8
1.6
BGR Energy
Neutral
133
-
959
3,615
3,181
9.5
9.4
16.7
12.4
8.0
10.7
0.7
0.7
10.0
7.0
0.7
0.8
BHEL
Neutral
165
-
40,483
33,722
35,272
10.8
11.7
10.5
14.2
15.8
11.6
1.2
1.1
7.0
9.0
1.3
1.2
Blue Star
Buy
377
439
3,388
3,548
3,977
6.3
6.9
13.7
17.2
27.5
22.0
6.9
4.5
26.1
25.4
1.0
0.9
Crompton Greaves
Accumulate
193
204
12,068
13,484
14,687
4.9
6.2
4.5
7.1
42.8
27.1
3.0
2.8
7.2
10.8
1.0
0.9
Inox Wind
Buy
364
458
8,083
4,980
5,943
17.0
17.5
26.6
31.6
13.7
11.5
4.1
3.0
35.0
30.0
1.8
1.4
KEC International
Neutral
151
-
3,873
8,791
9,716
6.1
6.8
5.4
8.2
27.9
18.4
2.8
2.6
10.0
14.0
0.7
0.6
Thermax
Neutral
869
-
10,360
6,413
7,525
7.4
8.5
30.5
39.3
28.5
22.1
4.4
3.8
15.0
17.0
1.6
1.3
Cement
ACC
Buy
1,327
1,630
24,905
13,151
14,757
16.4
18.3
63.9
83.4
20.8
15.9
2.7
2.5
13.3
16.1
1.7
1.5
Ambuja Cements
Accumulate
203
233
31,535
11,564
12,556
19.4
20.7
8.9
10.1
22.8
20.1
2.9
2.7
12.8
13.8
2.4
2.1
HeidelbergCement
Neutral
77
-
1,745
1,772
1,926
13.3
15.4
1.0
3.0
77.0
25.7
1.9
1.8
2.6
7.9
1.6
1.3
India Cements
Accumulate
98
112
3,015
4,216
4,840
18.0
19.5
4.0
9.9
24.5
9.9
1.0
0.9
4.0
9.5
1.0
0.8
JK Cement
Buy
578
744
4,044
3,661
4,742
10.1
15.8
18.0
61.0
32.1
9.5
2.3
2.1
7.5
22.9
1.6
1.2
J K Lakshmi Cement
Buy
331
430
3,892
2,947
3,616
16.7
19.9
11.5
27.2
28.8
12.2
2.7
2.4
9.8
20.8
1.7
1.4
Mangalam Cements
Neutral
199
-
531
1,053
1,347
10.5
13.3
8.4
26.0
23.7
7.6
1.0
0.9
4.3
12.5
0.9
0.6
Orient Cement
Buy
150
183
3,070
1,854
2,524
21.2
22.2
7.7
11.1
19.5
13.5
2.8
2.4
13.3
15.7
2.4
1.7
Ramco Cements
Neutral
389
-
9,249
4,036
4,545
20.8
21.3
15.1
18.8
25.7
20.7
3.1
2.8
12.9
14.3
2.8
2.4
Shree Cement^
Neutral
11,423
-
39,793
7,150
8,742
26.7
28.6
228.0
345.5
50.1
33.1
7.4
6.2
15.7
20.3
5.3
4.3
UltraTech Cement
Buy
2,737
3,282
75,099
25,021
30,023
19.1
21.6
89.0
132.0
30.7
20.7
3.6
3.1
12.2
15.9
3.1
2.6
Construction
ITNL
Neutral
93
-
3,059
7,360
8,825
34.0
35.9
7.0
9.0
13.3
10.3
0.5
0.4
3.2
3.7
3.8
3.7
KNR Constructions
Buy
559
673
1,572
937
1,470
14.3
14.0
33.5
38.6
16.7
14.5
2.5
2.2
15.4
15.4
1.8
1.1
Larsen & Toubro
Buy
1,240
1,646
115,438
65,065
77,009
11.5
11.7
61.5
65.6
20.2
18.9
2.0
1.9
13.4
14.0
2.0
1.7
Gujarat Pipavav Port
Neutral
158
-
7,641
629
684
51.0
52.2
6.4
5.9
24.7
26.8
3.3
3.0
15.9
12.7
11.8
10.6
MBL Infrastructures
Buy
219
285
907
2,313
2,797
12.2
14.6
19.0
20.0
11.5
10.9
1.2
1.1
11.3
10.6
1.1
1.0
Nagarjuna Const.
Neutral
79
-
4,375
7,892
8,842
8.8
9.1
3.0
5.3
26.2
14.8
1.3
1.2
5.0
8.5
0.8
0.7
PNC Infratech
Neutral
539
-
2,767
1,873
2,288
13.2
13.5
24.0
32.0
22.5
16.9
2.2
1.9
12.1
12.3
1.6
1.3
Simplex Infra
Neutral
319
-
1,577
5,955
6,829
10.3
10.5
16.0
31.0
19.9
10.3
1.1
1.0
5.3
9.9
0.8
0.7
Power Mech Projects
Neutral
660
-
971
1,539
1,801
12.8
12.7
59.0
72.1
11.2
9.2
1.7
1.4
18.6
16.8
0.6
0.5
January 7, 2016
18
Stock Watch | January 2016
Company Name
Reco
CMP
Target
Mkt Cap
Sales (` cr)
OPM (%)
EPS (`)
PER (x)
P/BV (x)
RoE (%)
EV/Sales (x)
(`)
Price (`)
(` cr)
FY16E
FY17E
FY16E
FY17E
FY16E
FY17E
FY16E
FY17E
FY16E
FY17E
FY16E
FY17E
FY16E
FY17E
Sadbhav Engineering
Neutral
334
-
5,728
3,481
4,219
10.7
10.8
8.0
12.0
41.7
27.8
3.9
3.4
10.3
13.5
1.9
1.6
NBCC
Accumulate
1,009
1,089
12,113
7,382
9,506
7.7
8.6
39.8
54.4
25.4
18.6
6.1
4.8
26.7
29.1
1.4
1.0
MEP Infra
Neutral
47
-
771
1,956
1,876
28.1
30.5
1.3
3.0
36.5
15.8
7.7
5.2
21.2
32.8
1.8
1.8
SIPL
Neutral
95
-
3,330
675
1,042
62.4
64.7
-
-
3.5
4.0
-
-
16.6
11.2
FMCG
Asian Paints
Neutral
887
-
85,038
16,553
19,160
16.0
16.2
17.7
21.5
50.2
41.2
13.3
12.0
29.4
31.2
5.0
4.3
Britannia
Neutral
3,003
-
36,034
8,065
9,395
9.6
10.2
47.2
65.5
63.6
45.9
21.1
20.0
38.3
41.2
4.3
3.7
Colgate
Neutral
949
-
25,801
4,836
5,490
19.5
19.7
48.5
53.2
19.6
17.8
14.3
12.5
99.8
97.5
5.2
4.6
Dabur India
Neutral
276
-
48,517
9,370
10,265
17.1
17.2
7.3
8.1
37.6
34.0
11.3
9.2
33.7
30.6
5.1
4.6
GlaxoSmith Con*
Neutral
6,659
-
28,003
4,919
5,742
17.2
17.4
168.3
191.2
39.6
34.8
11.2
9.6
28.8
28.9
5.3
4.5
Godrej Consumer
Neutral
1,306
-
44,458
10,168
12,886
16.1
16.1
32.1
38.4
40.7
34.0
8.3
7.6
19.7
21.0
4.5
3.5
HUL
Neutral
841
-
182,068
34,940
38,957
17.5
17.7
20.8
24.7
40.4
34.1
45.0
36.0
110.5
114.2
5.0
4.5
ITC
Buy
315
382
253,236
41,068
45,068
37.8
37.4
13.9
15.9
22.6
19.8
7.6
6.7
34.1
33.8
5.8
5.2
Marico
Neutral
227
-
29,222
6,551
7,766
15.7
16.0
10.4
12.5
21.8
18.1
6.3
5.3
33.2
32.4
4.4
3.7
Nestle*
Buy
5,717
6,646
55,120
11,291
12,847
22.2
22.3
158.9
184.6
36.0
31.0
18.8
16.9
55.0
57.3
4.7
4.1
Tata Global
Neutral
145
-
9,167
8,635
9,072
9.8
9.9
6.5
7.6
22.3
19.1
2.2
2.1
6.8
7.4
1.0
0.9
IT
HCL Tech^
Buy
840
1,132
118,439
42,038
47,503
23.2
23.5
55.8
62.9
15.1
13.4
3.5
2.7
23.0
19.8
2.4
1.9
Infosys
Buy
1,069
1,306
245,647
60,250
66,999
27.0
28.0
56.4
63.7
19.0
16.8
3.9
3.3
20.4
19.8
3.3
2.9
TCS
Buy
2,381
3,165
469,198
111,274
126,852
28.4
28.7
125.4
143.9
19.0
16.5
7.5
6.9
39.9
42.2
3.8
3.3
Tech Mahindra
Buy
524
646
50,619
25,566
28,890
16.0
17.0
26.3
31.9
19.9
16.4
3.6
3.0
17.9
18.6
1.7
1.5
Wipro
Buy
555
719
137,167
50,808
58,713
23.7
23.8
37.3
42.3
14.9
13.1
2.8
2.5
19.0
17.9
2.3
1.8
Media
D B Corp
Accumulate
325
356
5,969
2,241
2,495
27.8
27.9
21.8
25.6
14.9
12.7
3.9
3.4
26.7
28.5
2.6
2.3
HT Media
Neutral
89
-
2,062
2,495
2,603
11.2
11.2
7.3
8.6
12.1
10.3
1.0
0.9
7.4
8.1
0.3
0.3
Jagran Prakashan
Accumulate
169
189
5,518
2,170
2,355
27.2
26.2
8.9
9.9
19.0
17.1
4.0
3.5
20.9
20.4
2.4
2.2
Sun TV Network
Neutral
422
-
16,613
2,779
3,196
70.2
70.5
22.8
27.3
18.5
15.4
4.6
4.1
26.7
28.3
5.7
5.0
Hindustan Media
Neutral
289
-
2,118
920
1,031
20.0
20.0
19.2
20.9
15.0
13.8
2.5
2.1
16.4
15.3
1.8
1.6
Metal
Coal India
Buy
328
380
206,861
76,167
84,130
19.9
22.3
22.4
25.8
14.6
12.7
5.3
5.1
35.5
41.0
2.0
1.8
Hind. Zinc
Buy
146
175
61,690
14,641
14,026
50.4
50.4
17.7
16.0
8.3
9.1
1.3
1.2
16.2
13.2
1.8
1.7
Hindalco
Neutral
81
-
16,623
104,356
111,186
8.7
9.5
6.7
11.1
12.0
7.3
0.4
0.4
3.5
5.9
0.7
0.6
JSW Steel
Neutral
1,058
-
25,566
42,308
45,147
16.4
20.7
(10.3)
49.5
-
21.4
1.2
1.1
(1.0)
5.6
1.6
1.5
NMDC
Neutral
91
-
35,960
8,237
10,893
46.6
44.5
9.9
11.7
9.1
7.8
1.0
0.9
12.4
13.0
4.2
3.2
SAIL
Neutral
50
-
20,650
45,915
53,954
7.2
10.5
1.5
4.4
33.2
11.4
0.5
0.5
2.3
4.1
1.1
1.0
Vedanta
Neutral
89
-
26,356
71,445
81,910
26.2
26.2
12.9
19.2
6.9
4.6
0.5
0.4
7.2
8.9
0.8
0.6
Tata Steel
Neutral
269
-
26,077
126,760
137,307
8.9
11.3
6.4
23.1
42.2
11.6
0.8
0.8
2.0
7.1
0.8
0.7
Oil & Gas
Cairn India
Neutral
140
-
26,276
11,323
12,490
49.4
51.0
20.7
20.6
6.8
6.8
0.4
0.4
6.4
6.1
1.4
0.7
GAIL
Neutral
372
-
47,206
64,856
70,933
9.1
9.6
24.0
28.9
15.5
12.9
1.3
1.2
8.8
9.6
0.9
0.8
January 7, 2016
19
Stock Watch | January 2016
Company Name
Reco
CMP
Target
Mkt Cap
Sales (` cr)
OPM (%)
EPS (`)
PER (x)
P/BV (x)
RoE (%)
EV/Sales (x)
(`)
Price (`)
(` cr)
FY16E
FY17E
FY16E
FY17E
FY16E
FY17E
FY16E
FY17E
FY16E
FY17E
FY16E
FY17E
FY16E
FY17E
ONGC
Neutral
237
-
203,107
154,564
167,321
36.8
37.4
28.6
32.5
8.3
7.3
1.1
1.0
12.7
13.5
1.5
1.4
Petronet LNG
Neutral
267
-
20,006
29,691
31,188
5.8
6.2
12.8
13.4
20.9
19.9
3.1
2.8
15.8
14.8
0.7
0.7
Indian Oil Corp
Neutral
451
-
109,464
359,607
402,760
5.9
6.1
42.5
48.7
10.6
9.3
1.4
1.3
14.1
14.3
0.4
0.4
Reliance Industries
Accumulate
1,032
1,150
334,270
304,775
344,392
12.6
13.4
91.3
102.6
11.3
10.1
1.3
1.1
11.8
12.0
1.0
0.9
Pharmaceuticals
Alembic Pharma
Neutral
676
-
12,748
2,658
3,112
24.1
20.2
24.6
23.9
27.5
28.3
9.9
7.5
42.5
30.2
4.8
4.0
Aurobindo Pharma
Neutral
867
-
50,636
14,923
17,162
22.0
23.0
35.7
42.8
24.3
20.3
7.1
5.4
34.0
30.2
3.8
3.2
Cadila Healthcare
Accumulate
319
352
32,688
10,224
11,840
21.0
22.0
14.6
17.6
21.9
18.1
6.0
4.7
30.8
29.0
3.3
2.7
Cipla
Neutral
652
-
52,403
14,211
16,611
20.6
19.0
27.0
28.9
24.2
22.6
4.1
3.5
18.4
16.8
3.7
3.1
Dr Reddy's
Buy
3,047
3,933
51,968
16,838
19,575
25.0
23.1
167.5
178.8
18.2
17.0
3.8
3.2
23.1
20.4
3.0
2.5
Dishman Pharma
Neutral
343
-
2,769
1,733
1,906
21.5
21.5
17.0
19.9
20.2
17.2
2.0
1.8
10.5
11.2
2.1
1.8
GSK Pharma
Neutral
3,262
-
27,633
2,870
3,158
20.0
22.1
59.5
68.3
54.8
47.8
16.2
16.6
28.5
34.3
9.1
8.3
Indoco Remedies
Neutral
314
-
2,896
1,033
1,199
15.9
18.2
9.4
13.6
33.4
23.1
5.0
4.2
15.7
19.7
2.9
2.5
Ipca labs
Buy
714
900
9,009
3,363
3,909
12.9
18.6
13.4
28.0
53.3
25.5
3.8
3.3
7.4
14.0
3.0
2.5
Lupin
Neutral
1,754
-
79,024
13,092
16,561
25.0
27.0
50.4
68.3
34.8
25.7
7.2
5.7
22.8
24.7
5.7
4.4
Sanofi India*
Neutral
4,260
-
9,812
2,082
2,371
17.4
20.8
118.2
151.5
36.0
28.1
5.3
4.2
19.9
25.5
4.4
3.6
Sun Pharma
Buy
793
950
190,724
28,163
32,610
25.8
30.7
17.4
26.9
45.5
29.5
4.3
3.7
13.0
16.6
6.2
5.2
Power
Tata Power
Neutral
69
-
18,608
35,923
37,402
22.6
22.8
4.1
5.2
17.0
13.4
1.3
1.2
7.5
9.3
1.5
1.3
NTPC
Accumulate
141
157
116,632
87,064
98,846
23.4
23.5
11.7
13.2
12.1
10.7
1.3
1.3
11.4
12.1
2.4
2.1
Power Grid
Buy
140
170
73,059
20,702
23,361
86.7
86.4
12.1
13.2
11.6
10.6
1.7
1.5
15.6
15.1
8.4
7.9
Telecom
Bharti Airtel
Neutral
322
-
128,656
101,748
109,191
32.1
31.7
12.0
12.5
26.8
25.7
1.8
1.7
6.9
6.7
1.9
1.7
Idea Cellular
Neutral
135
-
48,605
34,282
36,941
32.0
31.5
5.9
6.2
22.9
21.8
2.1
1.9
9.9
9.3
2.0
1.9
Others
Abbott India
Neutral
5,777
-
12,276
2,715
3,153
14.5
14.1
134.3
152.2
43.0
37.9
10.7
8.8
27.4
25.6
4.2
3.6
Bajaj Electricals
Buy
203
290
2,053
4,719
5,287
5.2
5.8
8.6
12.7
23.8
16.1
2.7
2.4
11.4
14.8
0.4
0.4
Banco Products (India)
Neutral
146
-
1,043
1,208
1,353
10.9
12.3
10.8
14.5
13.5
10.1
1.5
1.4
11.9
14.5
0.8
0.7
Coffee Day Enterprises
Neutral
274
-
5,651
2,692
2,964
17.0
18.6
-
4.7
-
57.9
3.4
3.2
0.1
5.5
2.5
2.3
Competent Automobiles Neutral
158
-
97
1,040
1,137
3.2
3.1
25.7
28.0
6.1
5.6
0.9
0.8
15.0
14.3
0.1
0.1
Elecon Engineering
Neutral
82
-
894
1,369
1,533
13.7
14.9
3.3
6.1
24.7
13.5
1.6
1.5
6.6
11.4
1.0
0.9
Finolex Cables
Neutral
256
-
3,918
2,520
2,883
12.2
12.0
12.7
14.2
20.2
18.0
2.8
2.4
13.6
13.5
1.3
1.1
Garware Wall Ropes
Buy
411
473
899
861
967
10.9
10.9
24.9
29.6
16.5
13.9
2.5
2.2
14.6
14.9
1.1
0.9
Goodyear India*
Accumulate
564
622
1,300
1,888
1,680
12.1
11.9
62.2
56.6
9.1
10.0
2.1
1.8
25.9
19.7
0.5
0.5
Hitachi
Neutral
1,320
-
3,588
1,779
2,081
7.8
8.8
21.8
33.4
60.5
39.5
9.8
7.9
17.4
22.1
2.1
1.8
HSIL
Neutral
296
-
2,143
2,123
2,384
16.1
16.5
15.0
18.9
19.7
15.7
1.5
1.4
8.0
9.4
1.3
1.2
Interglobe Aviation
Neutral
1,235
-
44,518
17,022
21,122
20.7
14.5
63.9
53.7
19.3
23.0
29.0
23.7
149.9
103.2
2.6
2.1
Jyothy Laboratories
Neutral
308
-
5,576
1,620
1,847
11.5
11.5
7.3
8.5
42.2
36.3
5.5
5.1
13.3
14.4
3.3
2.8
Kirloskar Engines India
Neutral
246
-
3,555
2,471
2,826
8.8
10.4
9.1
13.3
26.9
18.4
2.6
2.4
9.7
13.4
1.1
0.9
January 7, 2016
20
Stock Watch | January 2016
Company Name
Reco
CMP
Target
Mkt Cap
Sales (` cr)
OPM (%)
EPS (`)
PER (x)
P/BV (x)
RoE (%)
EV/Sales (x)
(`)
Price (`)
(` cr)
FY16E
FY17E FY16E FY17E FY16E
FY17E FY16E
FY17E FY16E FY17E FY16E FY17E FY16E FY17E
Linc Pen & Plastics
Neutral
238
-
352
340
371
8.3
8.9
10.8
13.2
22.1
18.0
3.5
3.1
16.0
17.1
1.1
1.0
M M Forgings
Buy
525
614
633
511
615
21.7
21.6
43.1
55.8
12.2
9.4
2.2
1.8
19.9
21.2
1.4
1.1
MRF
Accumulate 40,446
45,575
17,154
20,316
14,488
21.4
21.1
5,488.0
3,797.9
7.4
10.6
2.5
2.0
41.1
21.2
0.8
1.1
MT Educare
Neutral
187
-
744
286
366
18.3
17.7
7.7
9.4
24.2
19.9
5.1
4.5
20.2
21.1
2.5
1.9
Navkar Corporation
Buy
207
265
2,951
365
436
38.3
37.5
5.6
5.9
36.7
35.2
2.3
2.2
6.3
6.1
8.9
7.6
Navneet Education
Neutral
95
-
2,265
998
1,062
24.1
24.0
5.8
6.1
16.5
15.6
3.6
3.2
22.0
20.5
2.4
2.2
Nilkamal
Neutral
1,403
-
2,094
1,910
2,083
10.5
10.3
63.3
69.2
22.2
20.3
3.6
3.1
17.6
16.5
1.2
1.0
Page Industries
Neutral
13,680
-
15,259
1,929
2,450
19.8
20.1
229.9
299.0
59.5
45.8
26.3
18.2
52.1
47.0
7.9
6.2
Radico Khaitan
Buy
112
156
1,485
1,565
1,687
12.2
13.0
5.7
7.1
19.6
15.7
1.6
1.5
8.3
9.6
1.4
1.3
Relaxo Footwears
Neutral
504
-
6,049
1,767
2,152
12.3
12.5
19.2
25.1
26.2
20.1
6.4
4.9
27.7
27.8
3.5
2.8
Siyaram Silk Mills
Buy
1,176
1,354
1,102
1,636
1,815
11.5
11.5
89.9
104.1
13.1
11.3
2.2
1.9
17.9
17.8
0.8
0.7
Styrolution ABS India*
Neutral
758
-
1,334
1,271
1,440
8.6
9.2
32.0
41.1
23.7
18.5
2.4
2.2
10.7
12.4
1.0
0.9
Surya Roshni
Buy
165
201
725
2,992
3,223
8.1
8.4
14.7
18.3
11.3
9.0
1.0
0.9
9.7
11.0
0.5
0.5
The Byke Hospitality
Neutral
158
-
633
222
287
20.5
20.5
5.6
7.6
28.0
20.9
5.3
4.3
18.8
20.7
2.9
2.2
Transport Corporation Neutral
299
-
2,271
2,830
3,350
8.8
9.0
14.4
18.3
20.8
16.3
3.2
2.8
15.4
17.1
0.9
0.8
TVS Srichakra
Buy
2,790
3,240
2,136
2,101
2,338
15.7
15.0
248.6
270.0
11.2
10.3
4.9
3.5
43.6
34.0
1.1
0.9
Visaka Industries
Accumulate
125
144
199
1,086
1,197
9.9
10.2
21.5
28.7
5.8
4.4
0.6
0.5
9.6
11.6
0.4
0.3
Wonderla Holidays
Neutral
391
-
2,208
206
308
44.0
43.6
9.0
12.9
43.4
30.3
5.9
5.4
13.7
17.8
10.6
7.1
Source: Company, Angel Research, Note: *December year end; #September year end; &October year end; ^June year end; Price as of January 6, 2016; Sesa Goa's numbers reflect the standalone Sesa Goa business only. We will revise our numbers once the
consolidated entity Sesa- Sterlite is formed
January 7, 2016
21
Top Picks Report | January 2016
Research Team Tel: 022 - 39357800
DISCLAIMER
This document is solely for the personal information of the recipient, and must not be singularly used as the basis of any investment
decision. Nothing in this document should be construed as investment or financial advice. Each recipient of this document should
make such investigations as they deem necessary to arrive at an independent evaluation of an investment in the securities of the
companies referred to in this document (including the merits and risks involved), and should consult their own advisors to determine
the merits and risks of such an investment.
Angel Broking Pvt. Limited, its affiliates, directors, its proprietary trading and investment businesses may, from time to time, make
investment decisions that are inconsistent with or contradictory to the recommendations expressed herein. The views contained in this
document are those of the analyst, and the company may or may not subscribe to all the views expressed within.
Reports based on technical and derivative analysis center on studying charts of a stock's price movement, outstanding positions and
trading volume, as opposed to focusing on a company's fundamentals and, as such, may not match with a report on a company's
fundamentals.
The information in this document has been printed on the basis of publicly available information, internal data and other reliable
sources believed to be true, but we do not represent that it is accurate or complete and it should not be relied on as such, as this
document is for general guidance only. Angel Broking Pvt. Limited or any of its affiliates/ group companies shall not be in any way
responsible for any loss or damage that may arise to any person from any inadvertent error in the information contained in this report.
Angel Broking Pvt. Limited has not independently verified all the information contained within this document. Accordingly, we cannot
testify, nor make any representation or warranty, express or implied, to the accuracy, contents or data contained within this document.
While Angel Broking Pvt. Limited endeavours to update on a reasonable basis the information discussed in this material, there may be
regulatory, compliance, or other reasons that prevent us from doing so.
This document is being supplied to you solely for your information, and its contents, information or data may not be reproduced,
redistributed or passed on, directly or indirectly.
Angel Broking Pvt. Limited and its affiliates may seek to provide or have engaged in providing corporate finance, investment banking
or other advisory services in a merger or specific transaction to the companies referred to in this report, as on the date of this report or
in the past.
Neither Angel Broking Pvt. Limited, nor its directors, employees or affiliates shall be liable for any loss or damage that may arise from
or in connection with the use of this information.
Note: Please refer to the important `Stock Holding Disclosure' report on the Angel website (Research Section). Also, please refer to the
latest update on respective stocks for the disclosure status in respect of those stocks. Angel Broking Pvt. Limited and its affiliates may
have investment positions in the stocks recommended in this report.
January 7, 2016
22