Angel Top Picks - February 2017
Top Picks
The FY2018 budget maintains a path of fiscal prudence and envisages higher
Company
CMP (`)
TP (`)
infrastructure investments. The government’s focus on rural and housing sector is
expected to be positive for multiple sectors. We view this as a positive event for the
Banking/NBFC
capital markets.
Dewan Housing
297
350
Equitas Holdings
183
235
Budget focuses on fiscal prudence and reforms: The FY2018 budget has set an
Consumption
achievable fiscal deficit target of 3.2%. The government also remains on course to
Amara Raja
909
1,009
achieve the FY2017 fiscal deficit target of
3.5%. Post-demonetisation, the
Asian Granito
271
351
government was under pressure to take the populist measures; however, by aiming
Bajaj Electricals
250
274
for further fiscal prudence, government has taken the right decision for the
Blue Star
538
634
economy. The government estimates recovery in the demand from Q1FY18E,
Mirza International
93
107
which should bring the economy back to the growth path. The focus on fiscal
Siyaram Silk Mills
1,548
1,720
prudence, along with no change in the long term capital gains tax, is expected to
IT
send strong signals to the foreign investors and rating agencies about the
HCL Tech
829
1,000
credibility and predictability of the government policies. The abolishment of the
Infosys
935
1,249
FIPB is also expected to bring more FDIs, which is structurally positive for the
Media
government’s ‘Make in India’ initiative.
Jagran Prakashan
187
225
Capital expenditure gets a boost: For FY2017, the government’s capital
TV Today
270
385
expenditure exceeds the budget estimates by 13%, indicating higher spending by
Real Estate/Infra/Logistics/Power
the government. Further, the FM has announced 10.7% increase in the capital
KEI Industries
168
207
expenditure for FY2018. This will be spend on infrastructure development (road
Larsen & Toubro
1,479
1,634
and metros), which in our opinion will lead to a multiplier effect on the economy.
Mahindra Lifespace
356
522
The government has also indicated slower spending on the revenue accounts such
Navkar Corp.
174
265
as subsidies and grants, indicating more efficiency in the government operations
Powr Grid Corporation
202
223
and additional funds for capital expenditure.
Pharma
Alkem Lab.
1,812
1,989
Rural economy in focus: In view of negative impact of demonetisation on the
rural and MSME sector, government has increased their focus on these sectors by
Lupin
1,491
1,809
Source: Angel Research;
allocating `10,00,000cr in farm credit as well as by reducing the income tax rate
Note: CMP as of Feb. 3, 2017
for small business with turnover less than `50cr. This is in line with the market
expectations and expected to boost the rural consumption demand.
Consumption and housing to remain in focus: The interest rates have already
fallen and we believe that there is some scope to further ease the rates with lower
fiscal deficit and net borrowings. The rural focus, coupled with halving the entry
level personal income tax rates and lower interest rates, is expected to revive the
consumption demand. Further, new measures taken by the government for
affordable housing sector are positive for real estate, cement, building material
and NBFC sectors. This is a good sign for the market as demand has taken severe
hit in these sectors after demonetisation.
The increase in capital expenditure by government is expected to benefit the
companies like L&T, POWERGRID Corporation, KEI Industries, etc. The focus on
affordable housing will be positive for Asian Granito, Dewan Housing and
Mahindra Lifespace. We also see boost in the consumption sector, which is
expected to be positive for Blue Star and Bajaj Electricals. Besides, we also
maintain positive stance on Lupin and Alkem, given their strong fundamentals and
lower valuations.
Please refer to important disclosures at the end of this report
1
Top Picks Report | February 2017
Top Picks
February 4, 2017
2
Top Picks Report | February 2017
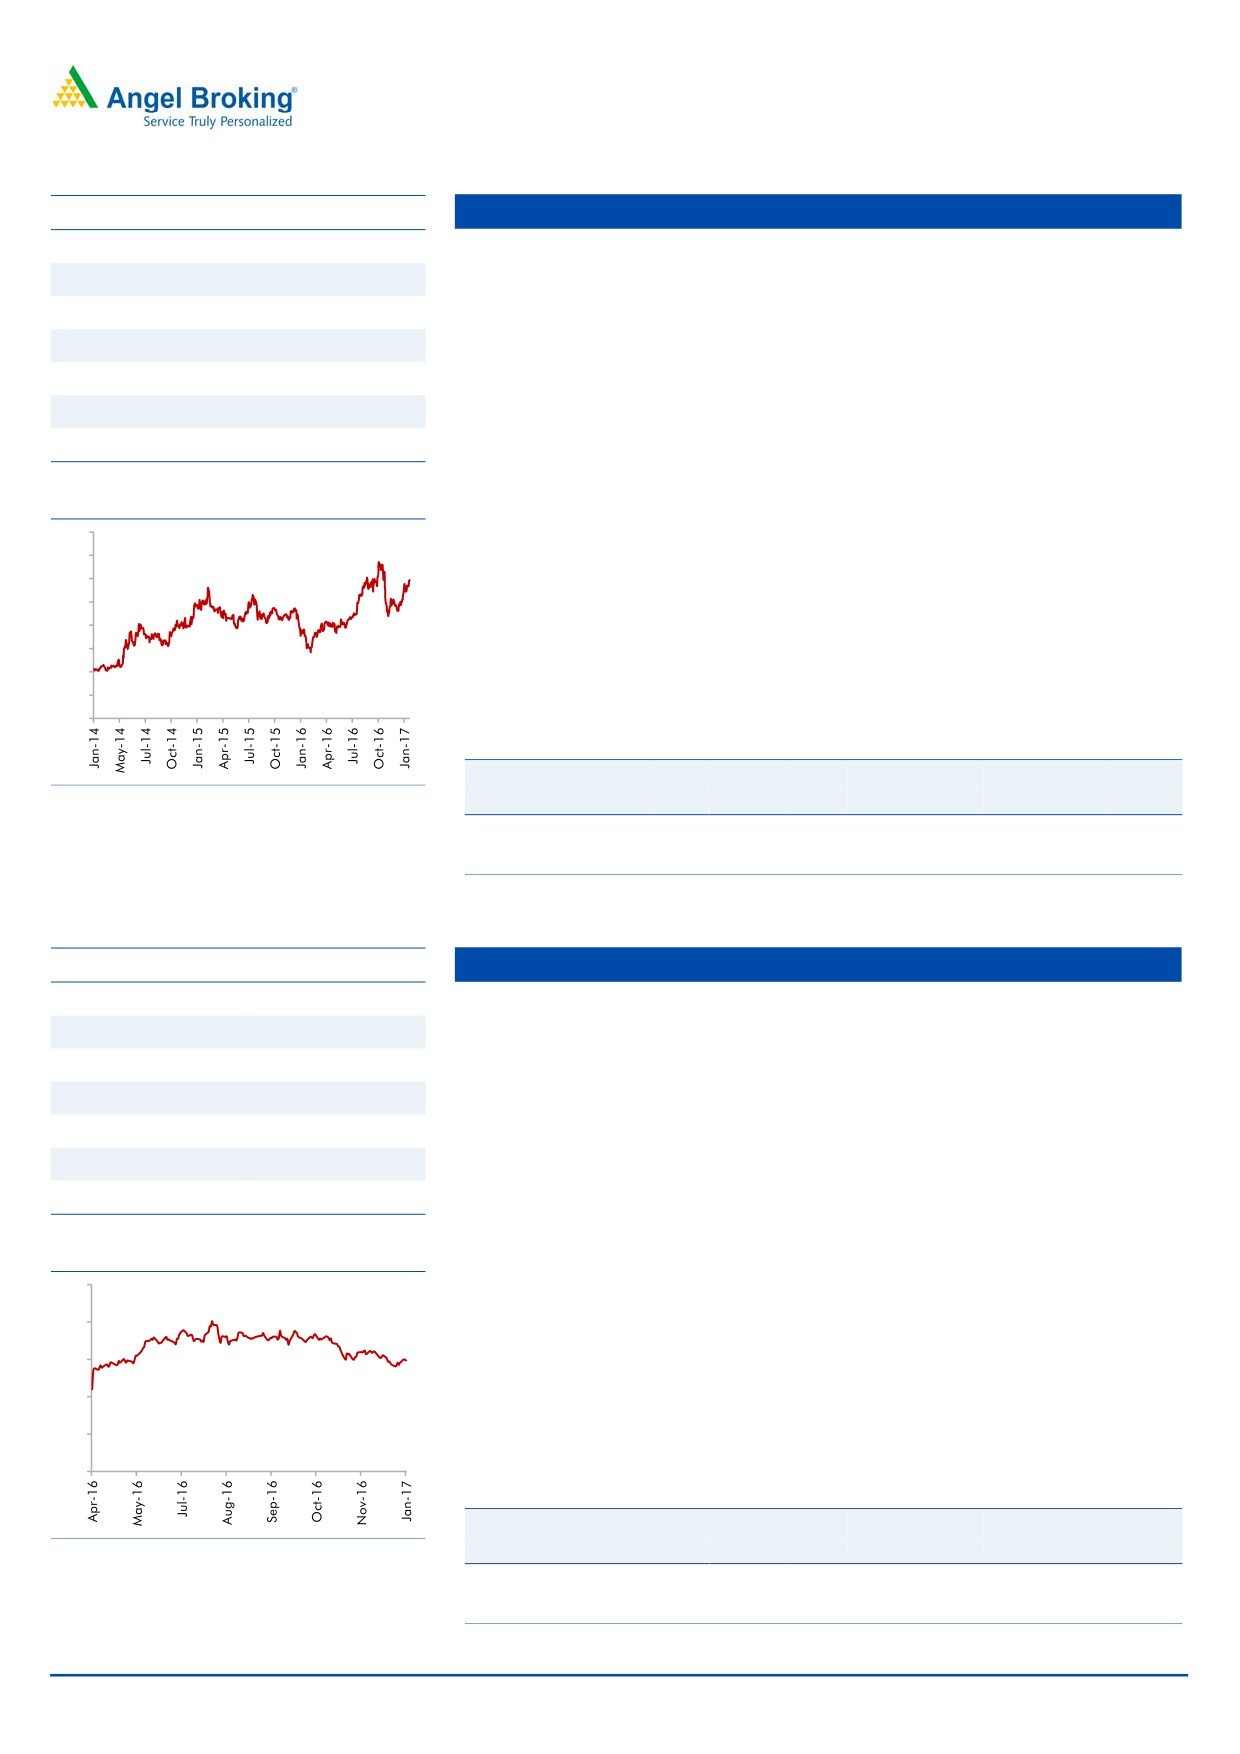
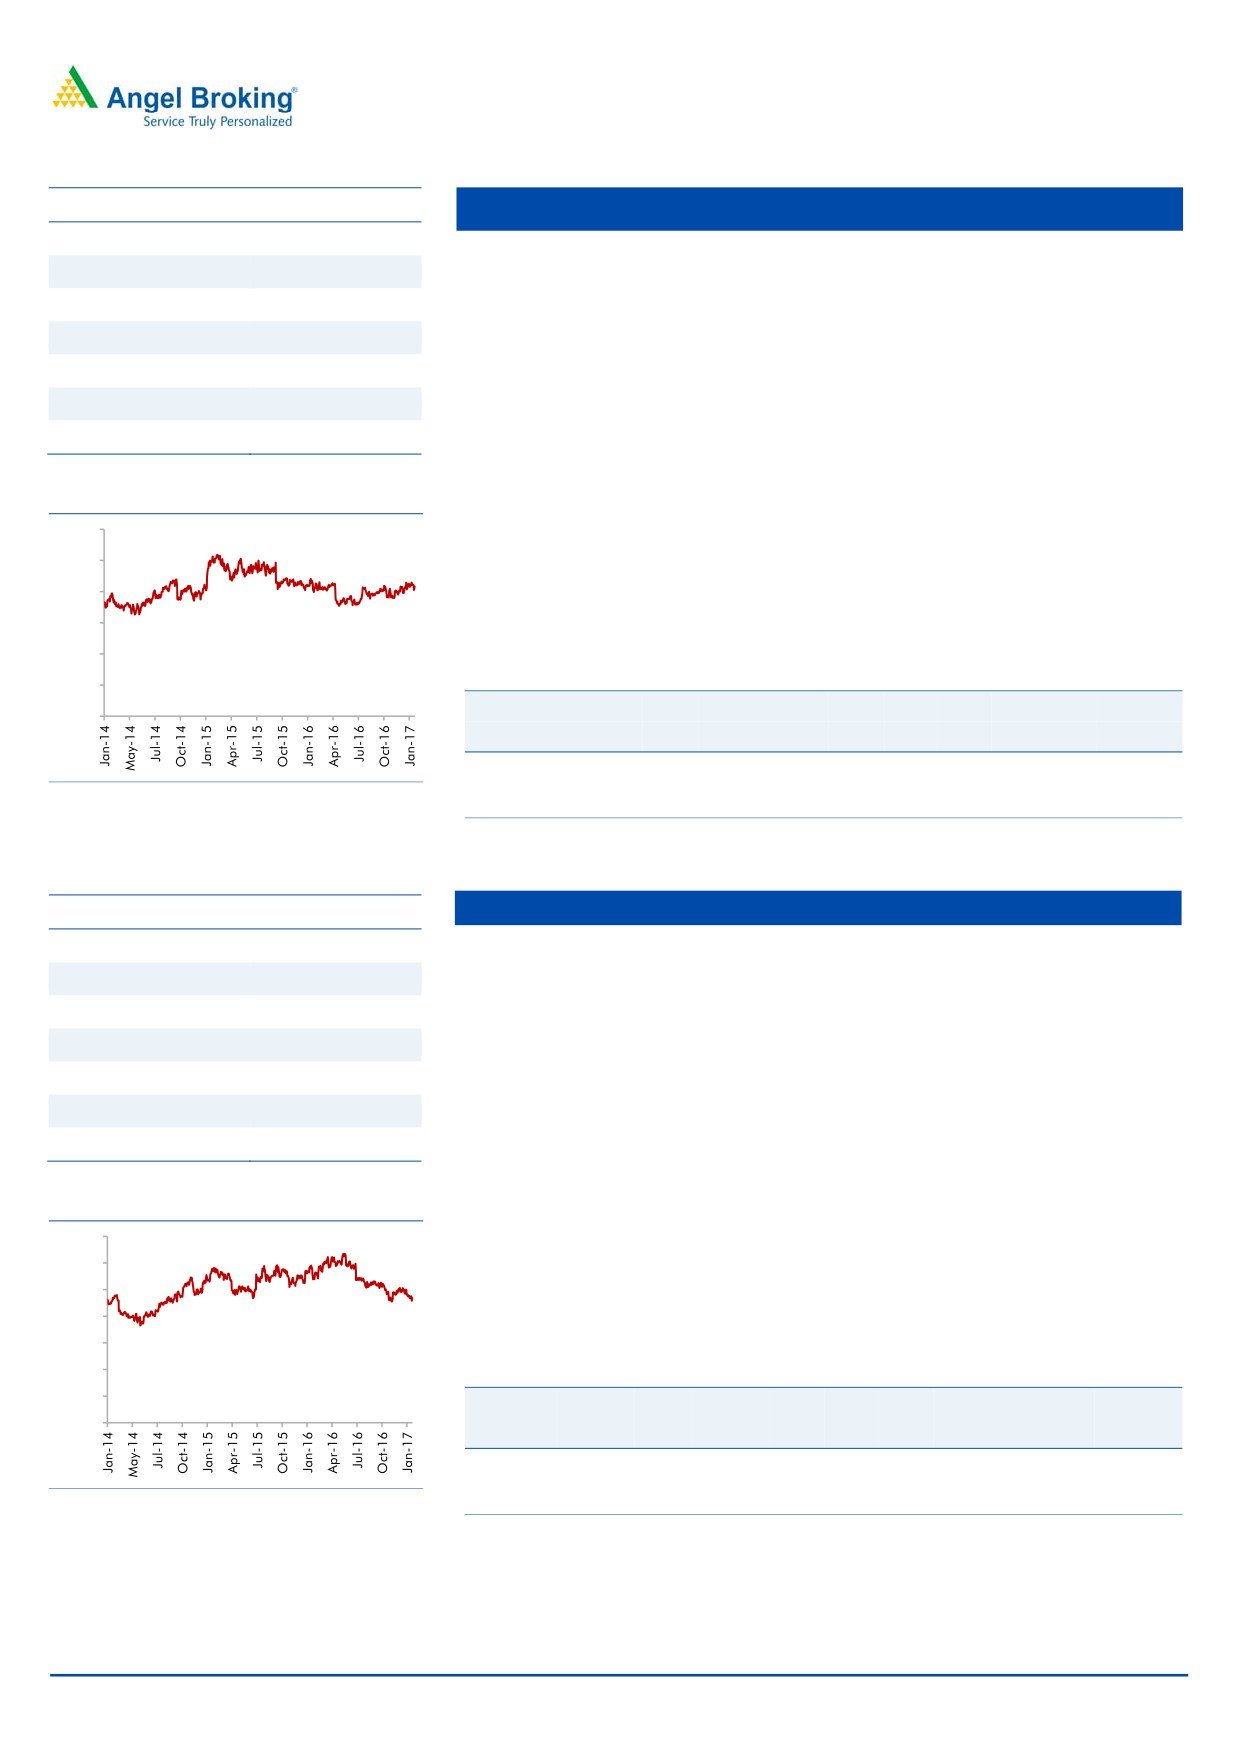
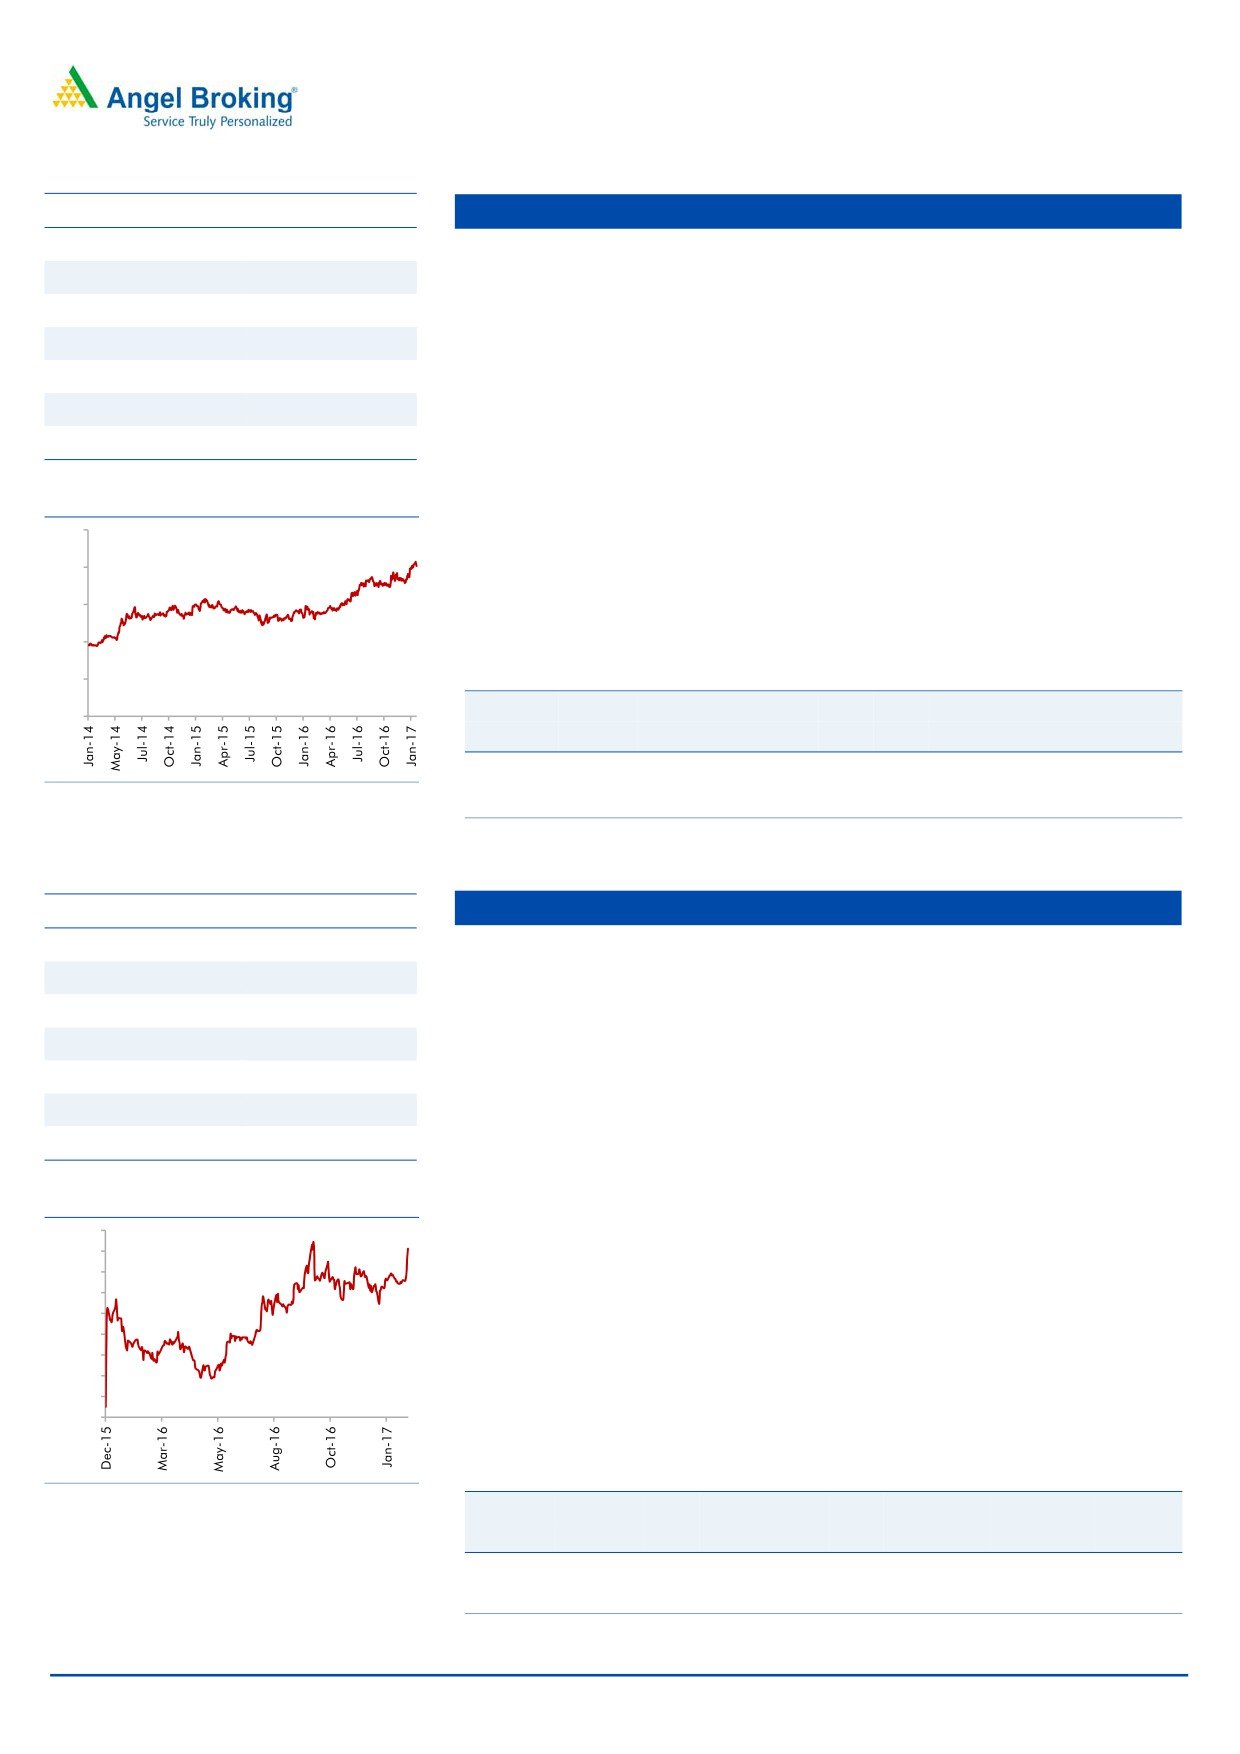
Stock Info
Dewan Housing
CMP
297
3rd largest private sector housing finance company: We expect DHFL’s AUM to
TP
350
grow at a CAGR of 21% over FY2016-18, as demand for housing in the middle
Upside
18.0%
and low income group picks up, while PAT CAGR is expected to be 23%.
Sector
Financials
Seasoned and granular loan book with stable asset quality: Individual
borrowers account for 72%, while the high yielding loan against property (LAP)
Market Cap (` cr)
9,287
+SME and projects loans account for 19% and 9% of advances respectively. Despite
Beta
1.6
strong loan growth, the GNPAs and NNPAs are likely to be at ~1.17% and 0.82%,
52 Week High / Low
337 / 141
respectively, for FY2017. We don’t expect any major deterioration in the asset
quality going ahead.
3 year-Chart
Lower cost of funds will help maintain NIM: Nearly
70% of the bank
400
borrowings are due for maturity over the next three years and recently DHFL
350
was able to raise large sum ~ Rs14, 000 cr via NCDs at a competitive rates
300
and this should help maintain its NIM at ~2.9%.
250
200
Outlook: We expect the company to post a healthy loan book CAGR of 21%
150
over FY2015-18E, which is likely to translate in earnings CAGR of 23%, over
100
the same period. The stock currently trades at 1.1x FY2018E ABV. We have a
50
Buy stand on the stock, with a target price of `350.
-
Key Financials
Y/E
Op. Inc NIM
PAT
EPS
ABV ROA ROE P/E P/ABV
Source: Company, Angel Research
March
(` cr)
(%)
(` cr)
(`)
(`)
(%)
(%)
(x)
(x)
FY2017E
2,050
2.9
923
29.5
189
1.2
16.3
10
1.6
FY2018E
2,500
2.9
1,145
36.6
218.5
1.2
16.9
8.1
1.4
Source: Company, Angel Research
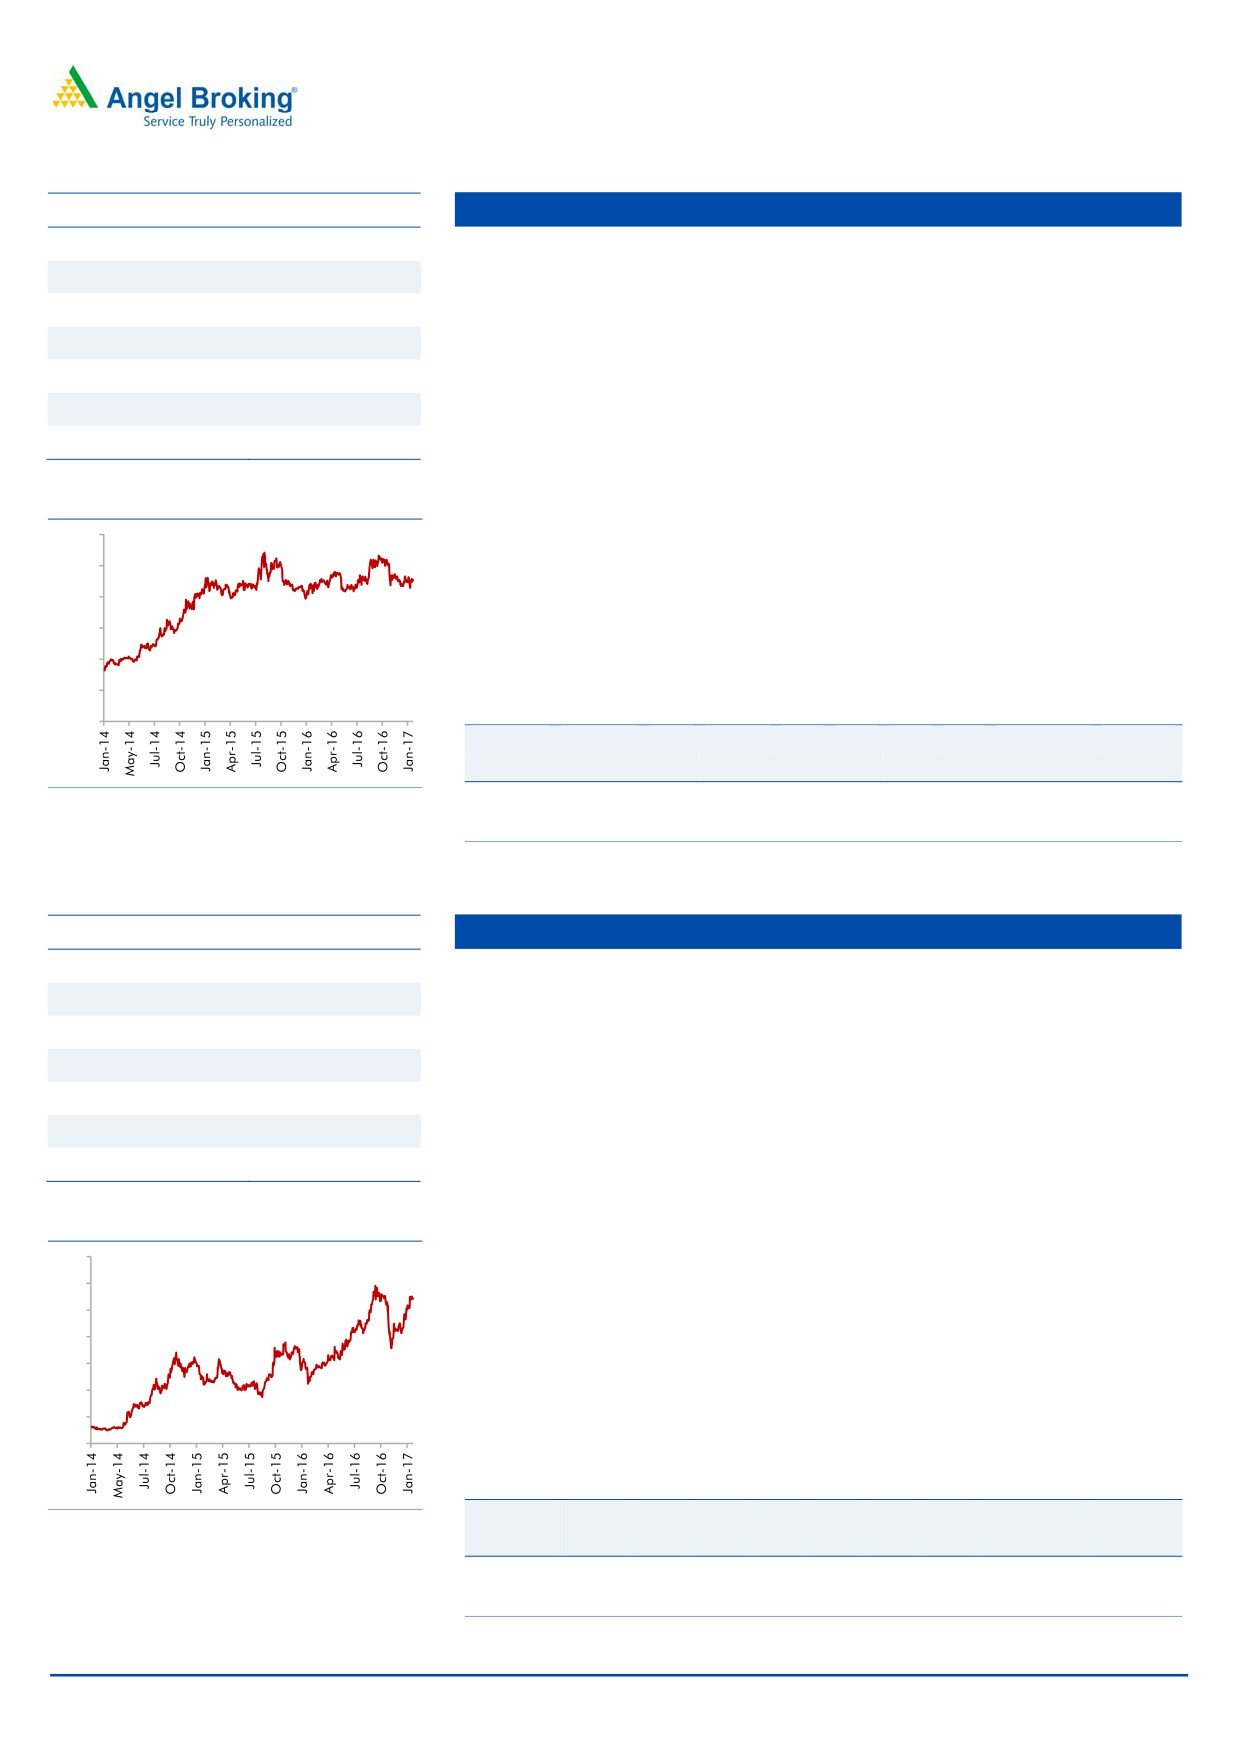
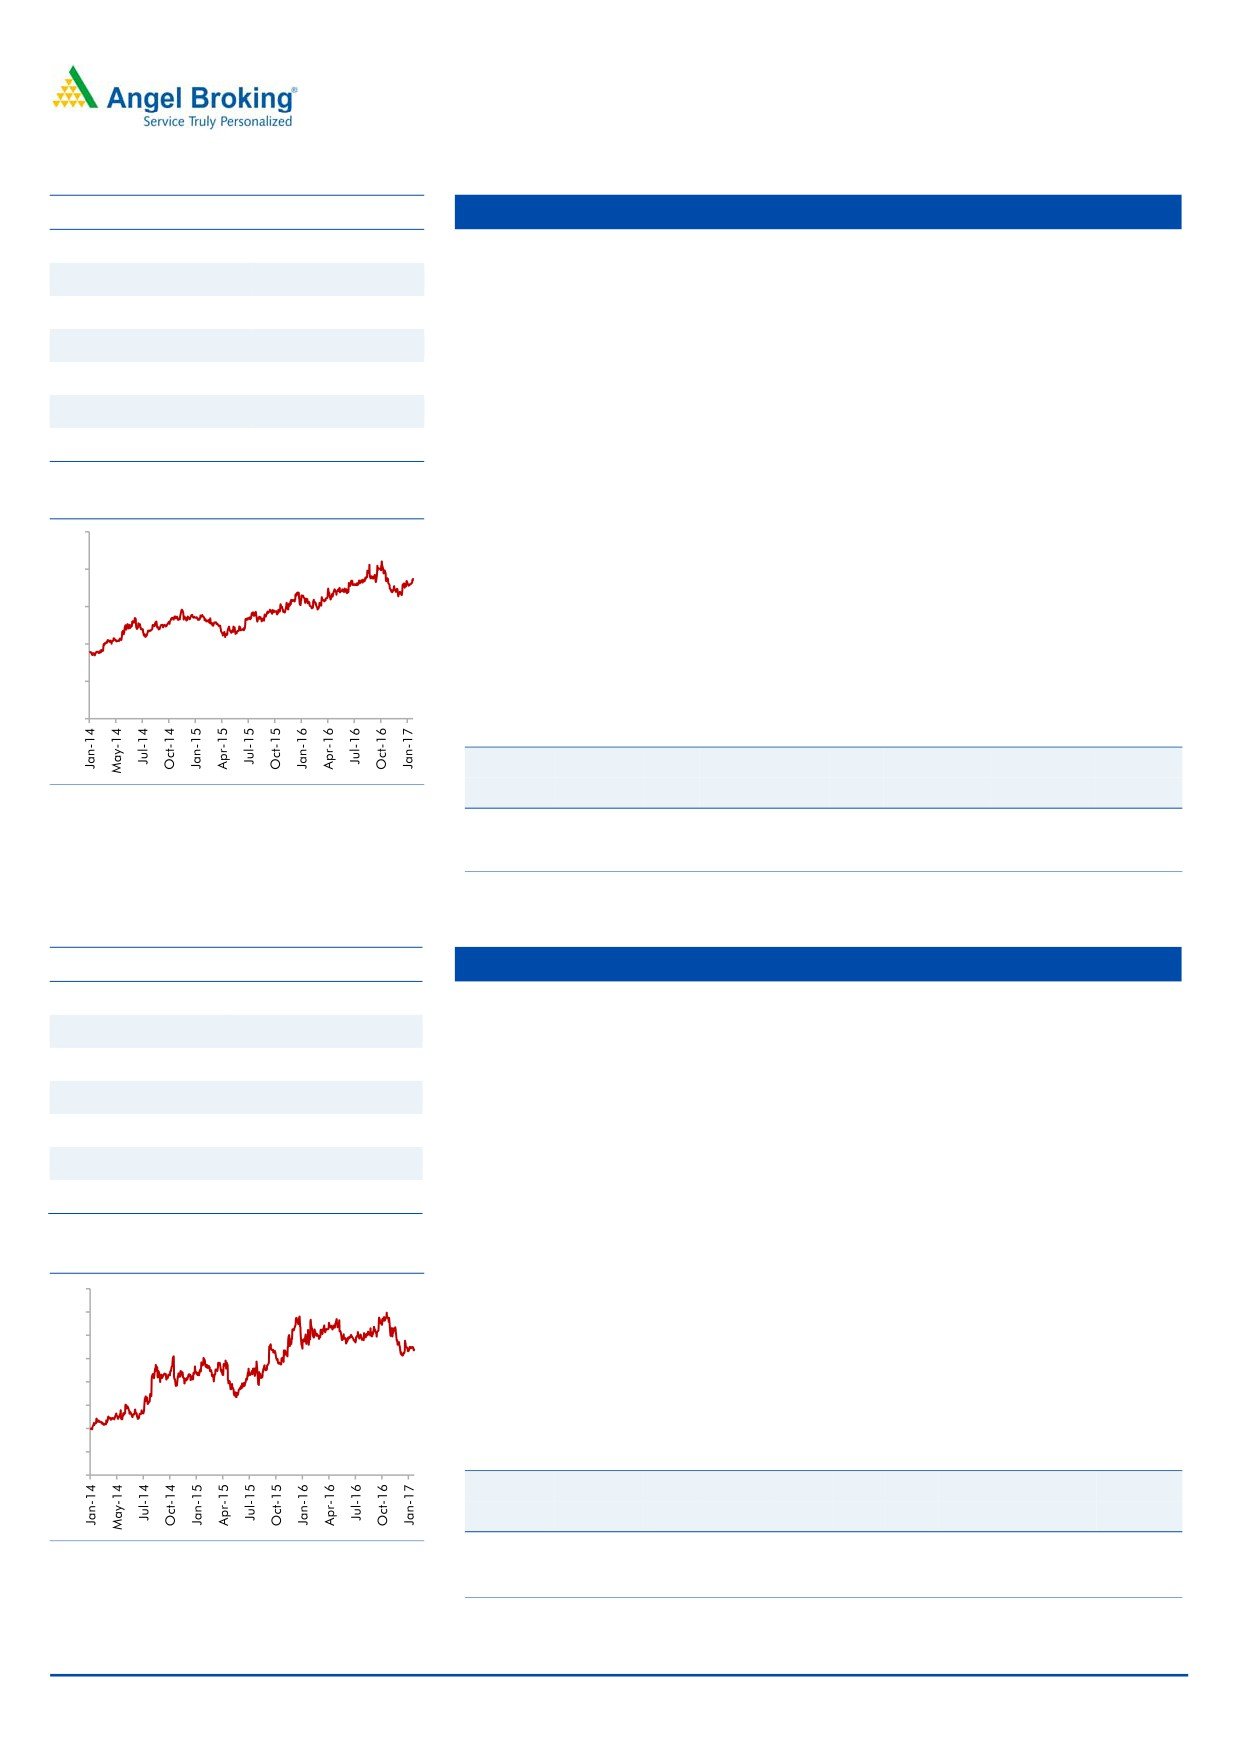
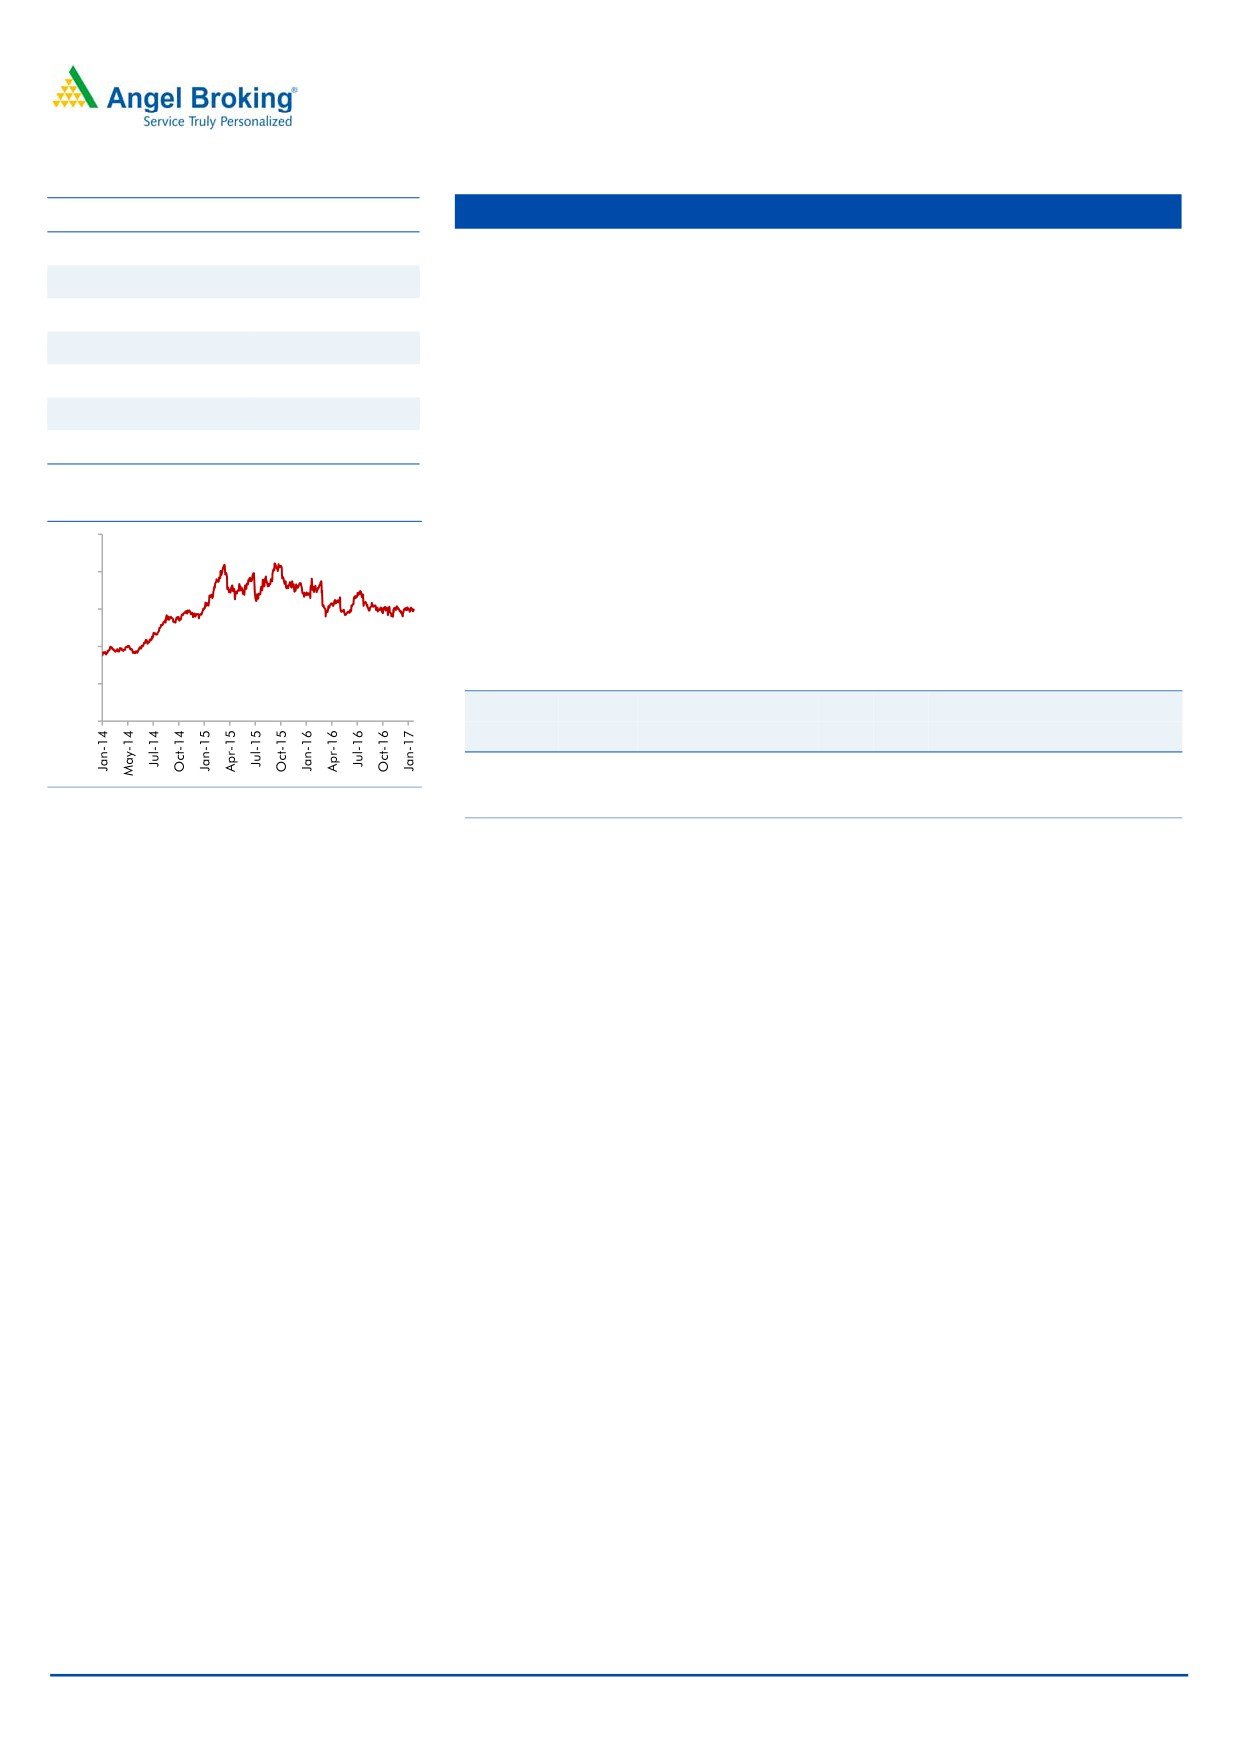
Stock Info
Equitas Holdings
CMP
183
Early mover advantage in the SFB category: Equitas was one of the ten NBFCs
TP
235
to get the license to start a small finance bank (SFB). As the entire book of
Upside
28.4%
Equitas qualifies for PSL, meeting the 75% PSL target will not be a challenge.
Sizeable and diversified loan book will keep it ahead of other upcoming SFBs.
Sector
Financials
Asset quality and return ratios are likely to remain stable: Equitas will have to
Market Cap (` cr)
6,168
maintain CRR & SLR going ahead; hence yield on total assets is likely to come
Beta
0.9
down. However, as a bank it will be able to raise deposits and hence there will
52 Week High / Low
206 / 134
be reduction in cost of funds. As a result, spreads may not decline much which
in turn will help in maintaining the ROE & ROA which although could undergo
3 year-Chart
a marginal decline. Also we don’t expect any major deterioration in the asset
250
quality going ahead.
200
NIM likely to remain healthy: After conversion to SFB the company has started
raising deposits at a lower cost vs borrowings leading to better cost of funds.
150
Hence we expect the NIM to remain strong at ~10-11%, going ahead.
100
Outlook: We expect the company to post a strong loan book & earnings
CAGR of 38% & 37% over FY2016-18E. The stock currently trades at 1.9x
50
FY2018E ABV. We maintain Buy on the stock, with a target price of `235.
-
Key Financials
Y/E
Op. Inc NIM
PAT
EPS
ABV ROA ROE P/E P/ABV
March
(` cr)
(%)
(` cr)
(`)
(`)
(%)
(%)
(x)
(x)
Source: Company, Angel Research
FY2017E
9,39
11.7
224
5.8
68.2
2.8
10.9
31.5
2.7
FY2018E
1,281
11.5
315
8.2
77.6
2.8
11.5
22.3
2.4
Source: Company, Angel Research
February 4, 2017
3
Top Picks Report | February 2017
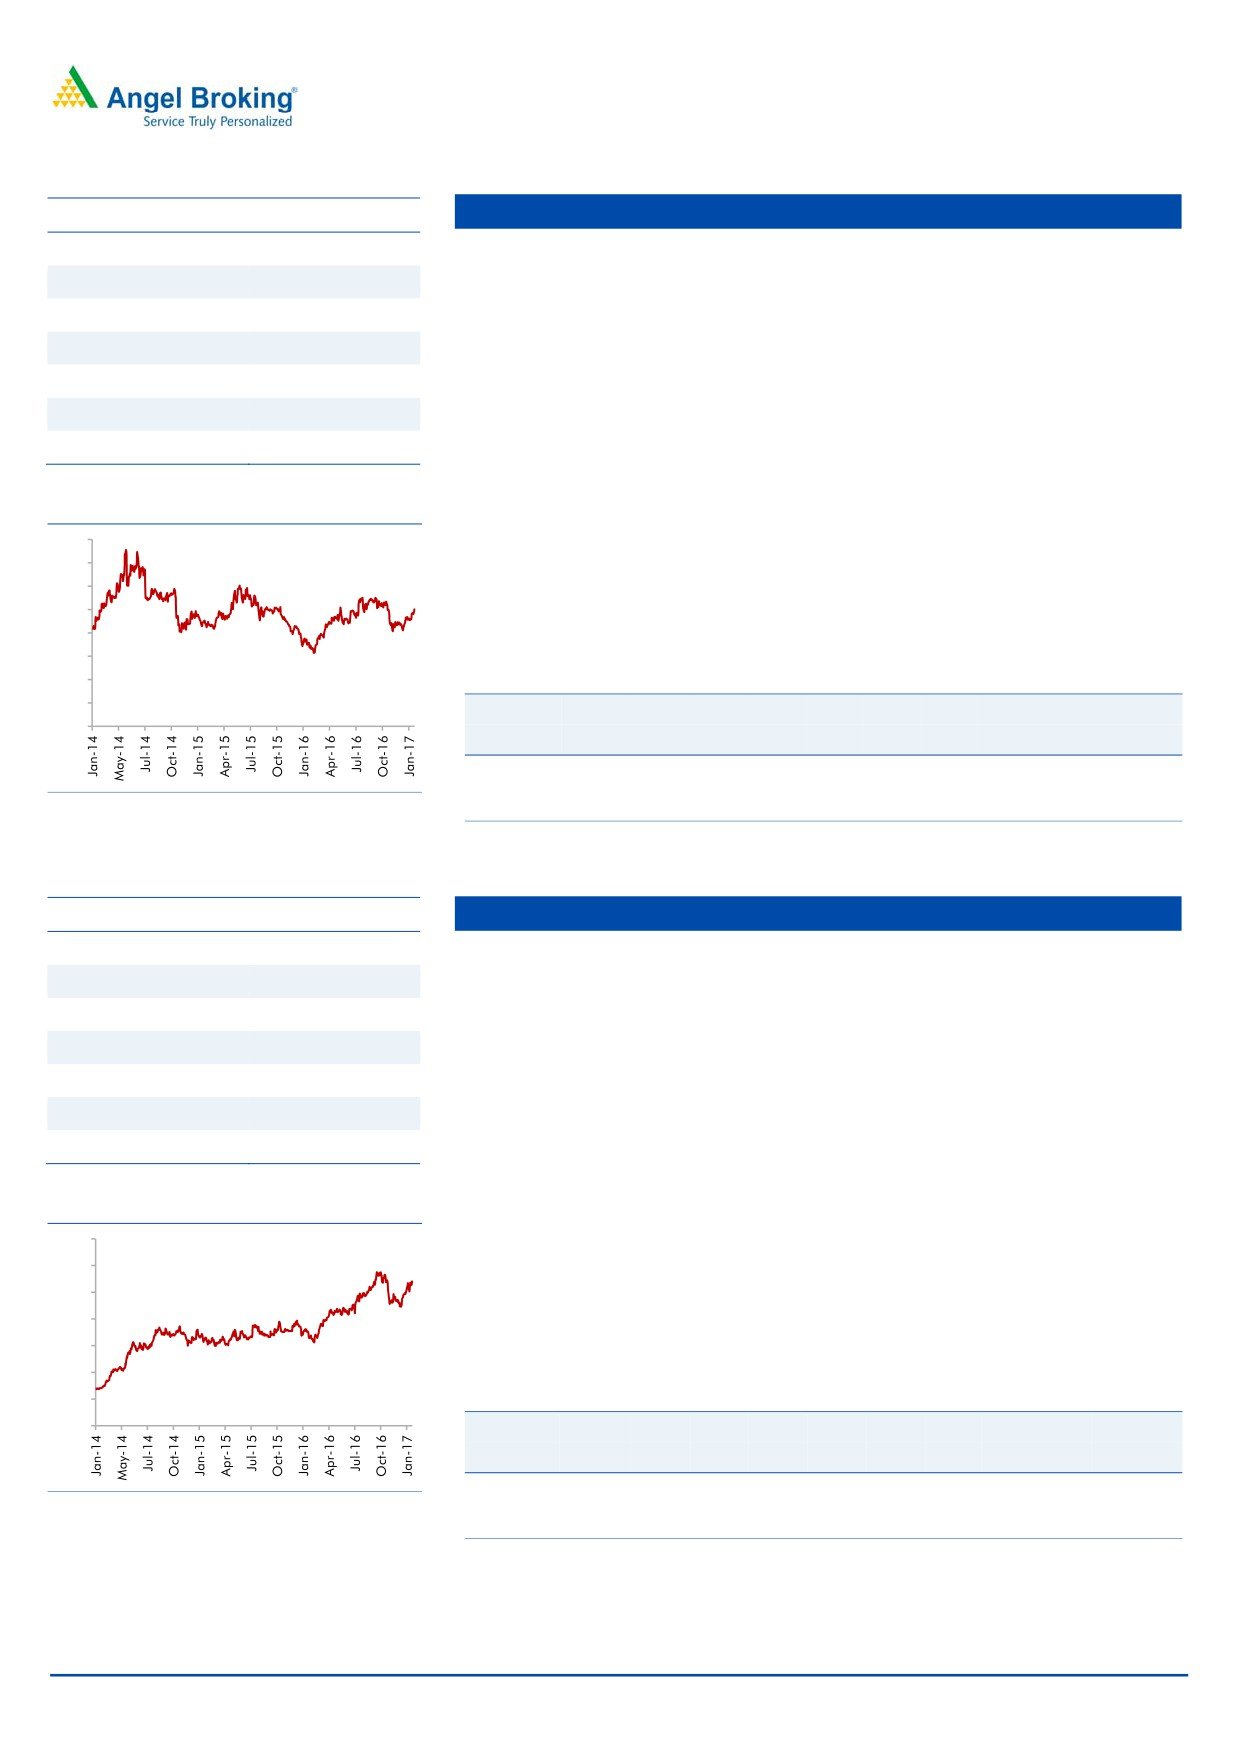
Stock Info
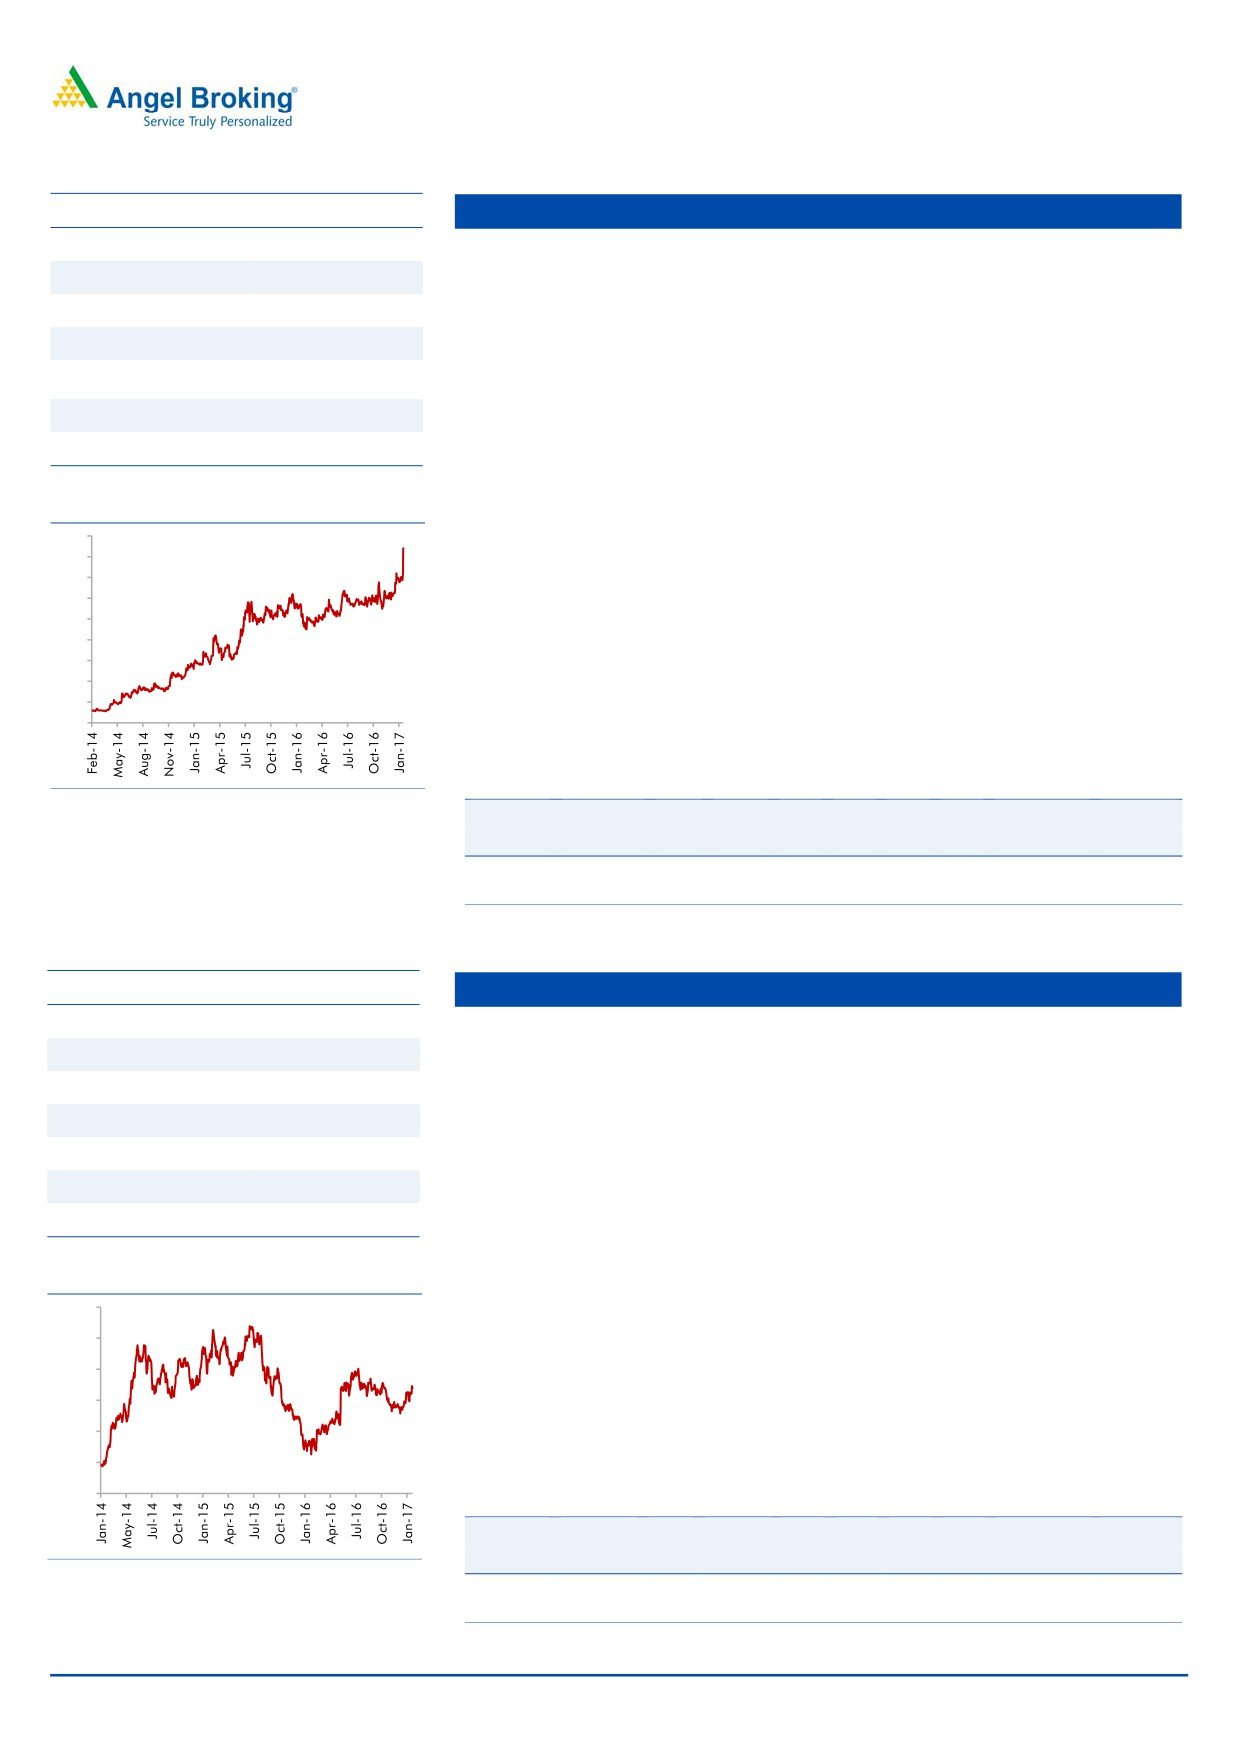
Amara Raja Batteries
CMP
899
Amara Raja Batteries Ltd (ARBL) is the second largest lead acid storage battery
TP
1,167
manufacturer in the country. It has been outpacing market leader Exide (ARBL
Upside
29.8%
grew at a 21% CAGR over FY2010-16 as compared to standalone Exide's
growth of 7%), leading to its market share improving from 25% in FY10 to
Sector
Auto Ancillary
about 35% currently. ARBL's outperformance has been mainly on back of its
Market Cap (` cr)
15,348
association with global battery leader Johnson Controls Inc (which also holds
Beta
0.8
26% stake in ARBL) for manufacturing ducts.
52 Week High / Low
1,077 / 773
With the automotive OEMs following a policy of having multiple vendors and
with ARBL’s products enjoying a strong brand recall in the replacement
3 year-Chart
segment, the company is well poised to gain further market share. Given the
1,200
economic recovery and market share gains, the company is expected to grow at
a CAGR of 18% over the next two years as against industry growth of 10-12%.
1,000
800
ARBL is a well diversified auto ancillary player having presence across the
automotive and the industrial segment. It has a broad OEM as well as
600
replacement customer base. We believe ARBL is a high quality stock to play
400
the auto sector revival. We maintain our Buy rating on the stock.
200
Key Financials
-
Y/E
Sales
OPM PAT EPS ROE P/E P/BV EV/EBITDA EV/Sales
March
(` cr)
(%)
(` cr)
(`)
(%)
(x)
(x)
(x)
(x)
FY2017E
5,504
17.6
571
33.4
22.1
26.9
5.9
16.0
4.6
Source: Company, Angel Research
FY2018E
6,605
17.5
699
40.9
22.0
22.0
4.8
13.3
3.7
Source: Company, Angel Research
Stock Info
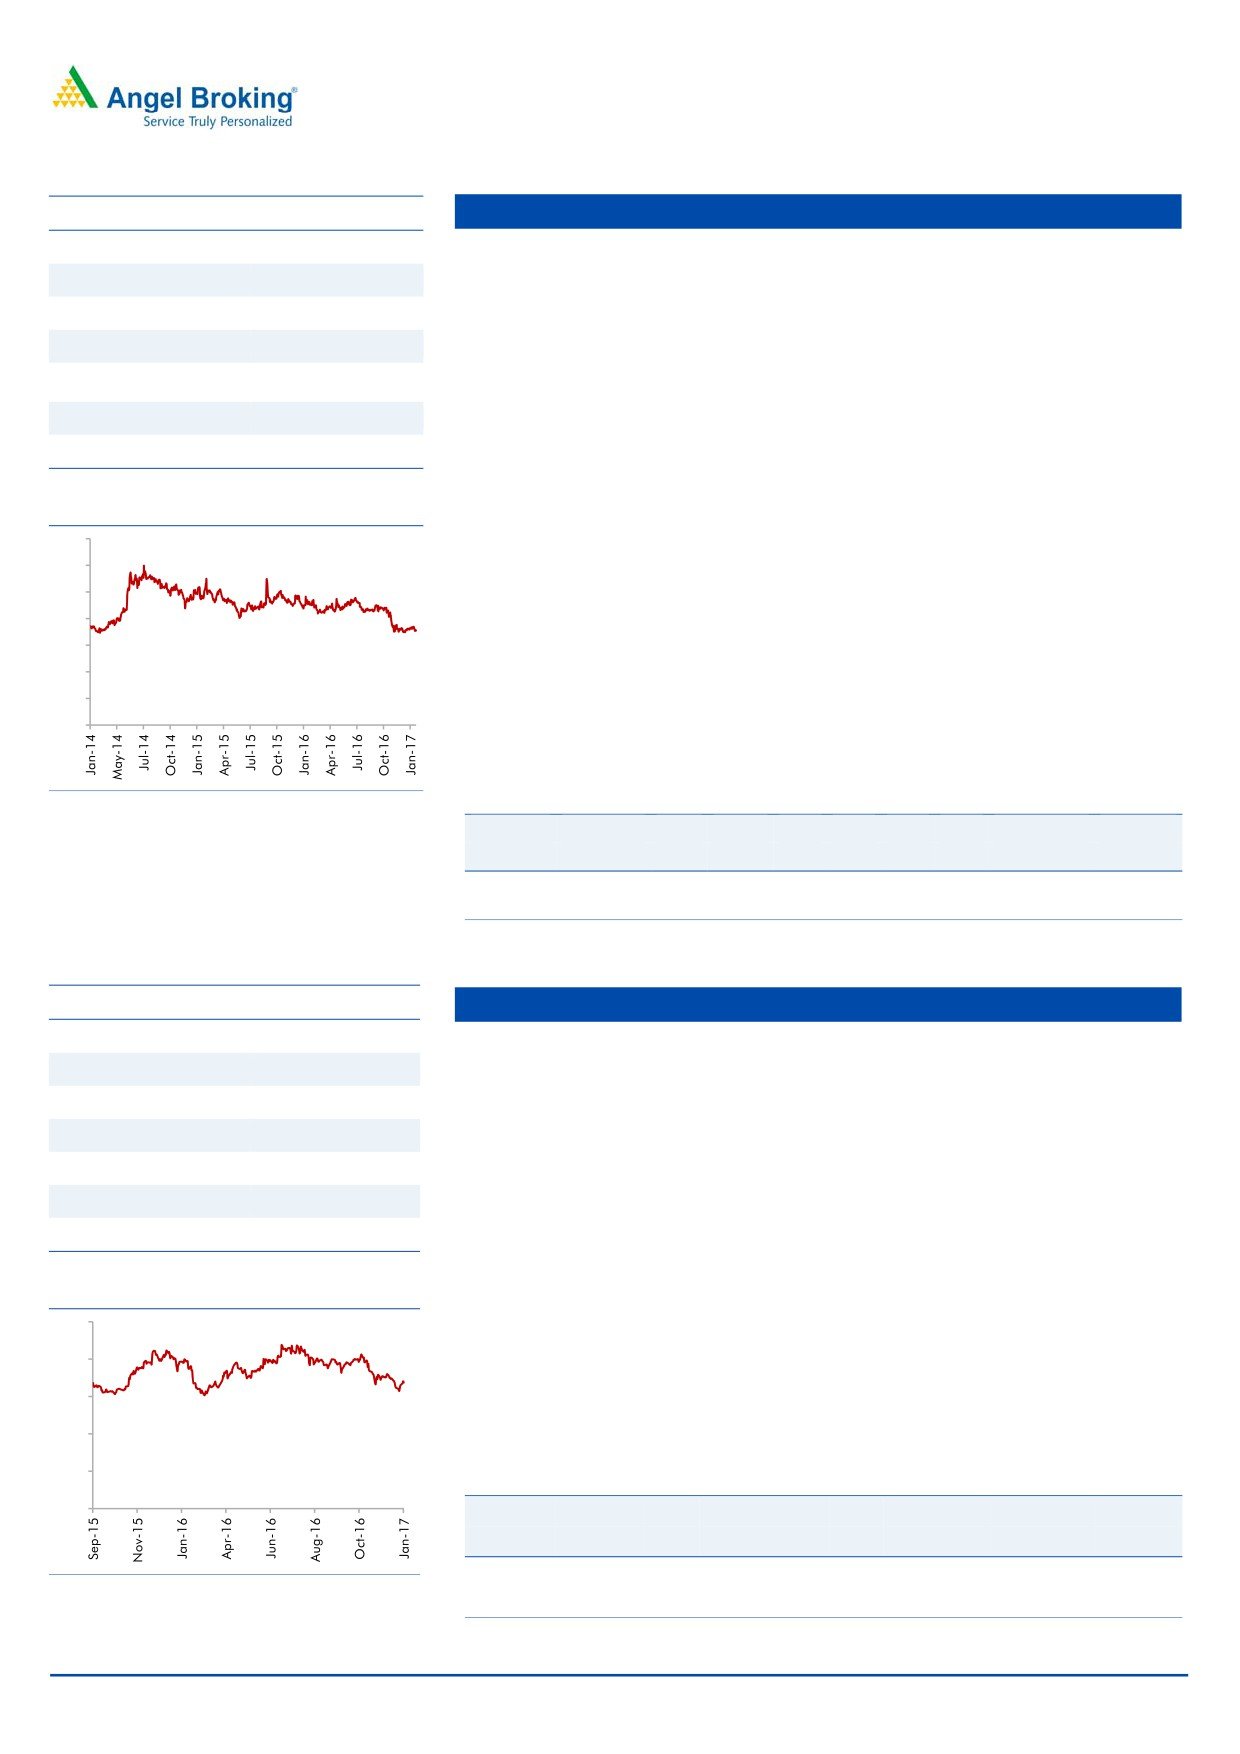
Asian Granito
CMP
271
AGIL’s current, vitrified sales (35%) are lower as compared to its peers like
TP
351
Somany Ceramics (47%) and Kajaria Ceramics (61%). Recently, AGIL has
Upside
29.5%
launched various products in premium segment. Going forward, we expect
AGIL’s profit margin to improve due to increase in focus for higher vitrified
Sector
Ceramics
product sales, which is a high margin business.
Market Cap (` cr)
713
AGIL is continuously putting efforts to increase the B2C sales from the current
Beta
1.4
level (35% in FY16). It is expected to reach up to 50% in next 2-3 years on the
52 Week High / Low
304 / 109
back of various initiatives taken by AGIL to increase direct interaction with customers
like strengthening distribution network, participation in key trade exhibition, etc.
3 year-Chart
In July FY2016, AGIL acquired Artistique Ceramic which has a better margin
350
profile. Going forward, we expect the company to improve its operating
300
margin from 7.5% in FY16 (excluding merger) to 12-12.5% in coming
250
financial year. Artisique Ceramics has a contract with RAS GAS to supply
200
quality natural gas at a discounted rate of 50% to current market rate, which
150
would reduce the overall power & fuel cost of the company.
100
We expect AGIL to report a net revenue CAGR of ~8.5% to ~`1,169cr and
50
net profit CAGR of ~39% to `48cr over FY2016-18E. We have a Buy rating
-
on the stock and target price of `351.
Key Financials
Y/E
Sales OPM PAT EPS ROE P/E P/BV EV/EBITDA EV/Sales
Source: Company, Angel Research
March
(` cr)
(%)
(` cr)
(`)
(%)
(x)
(x)
(x)
(x)
FY2017E
1,060
12.2
38
12.7
9.5
21.4
2.0
8.8
1.1
FY2018E
1,169
12.5
48
15.9
10.6
17.1
1.8
7.4
0.9
Source: Company, Angel Research
February 4, 2017
4
Top Picks Report | February 2017
Stock Info
Bajaj Electricals
CMP
250
The company is among the top 4 players in the consumer durables space
TP
274
across all its product categories (leader in small appliances; number-4 in fans
and lighting). It has a strong distribution reach with 4,000 distributors
Upside
9.6%
reaching out to 400,000 retailers.
Sector
Cons. Durable
In the 3 years preceding FY2016, the company’s E&P segment had been
Market Cap (` cr)
2,530
underperforming owing to cost overruns and delays in project executions.
Beta
0.9
However, the segment has turned around in FY2016 on the profitability front
52 Week High / Low
280 / 155
and delivered a healthy EBIT margin of ~6% for the year. Currently the
segment’s order book stands at `2,480cr.
3 year-Chart
With expectation of timely execution of new projects in the E&P segment and
400
with the Lighting and Consumer Durables segments expected to benefit from
350
an improvement in consumer sentiments going forward, we expect the
300
company’s top-line to grow at a CAGR of ~8% to `5,351cr and bottom-line to
250
grow at a CAGR of 20% to `138cr over FY2016-FY2018E. We recommend an
200
Accumulate rating on the stock.
150
100
Key Financials
50
Y/E
Sales OPM PAT EPS ROE P/E P/BV EV/EBITDA EV/Sales
-
March
(` cr)
(%)
(` cr)
(`)
(%)
(x)
(x)
(x)
(x)
FY2017E
4,801
5.7
105
10.4
12.4
24.0
3.0
9.5
0.5
FY2018E
5,351
6.2
138
13.7
14.5
18.3
2.6
7.8
0.5
Source: Company, Angel Research
Source: Company, Angel Research
Stock Info
Blue Star
CMP
538
BSL is one of the largest air-conditioning companies in India. With a mere
TP
634
3% penetration level of ACs vs 25% in China, the overall outlook for the room
Upside
17.8%
air-conditioner (RAC) market in India is favourable.
Sector
Cons. Durable
BSL’s RAC business has been outgrowing the industry by ~10% points over the
Market Cap (` cr)
5,138
last few quarters, resulting in the company consistently increasing its market
share (~7% in FY2014 to 10.5% at present). This has resulted in the Cooling
Beta
0.6
Products Division (CPD)'s share in overall revenues increasing from~23% in
52 Week High / Low
581 / 306
FY2010 to ~42% in FY2016 (expected to improve to ~47% in FY2018E). With
strong brand equity and higher share in split ACs, we expect the CPD to
3 year-Chart
continue to drive growth.
700
Aided by increasing contribution from the CPD, we expect the overall top-line
600
to post a revenue CAGR of ~16% over FY2016-18E and margins to improve
500
from 5.3% in FY2015 to 7.3% in FY2018E. Moreover, the merger of Blue Star
400
Infotech has infused cash and strengthened the balance sheet. We have a Buy
300
recommendation on the stock.
200
100
Key Financials
-
Y/E
Sales OPM PAT EPS ROE P/E P/BV EV/EBITDA EV/Sales
March
(` cr)
(%)
(` cr)
(`)
(%)
(x)
(x)
(x)
(x)
FY2017E
4,283
5.9
141
14.9
20.4
36.1
7.0
18.7
1.2
Source: Company, Angel Research
FY2018E
5,077
7.3
211
22.1
26.4
24. 3
5.9
13.2
1.0
Source: Company, Angel Research
February 4, 2017
5
Top Picks Report | February 2017
Stock Info
Mirza International
CMP
93
In the branded domestic segment, we expect the company to report a ~21%
TP
107
CAGR over FY2016-18E to `258cr. We anticipate strong growth for the
Upside
15.1%
company on the back of (a) the company’s wide distribution reach through its
1,000+ outlets including 120 exclusive brand outlets (EBOs) in 35+ cities and
Sector
Footwear
the same are expected to reach 200 over the next 2-3 years and (b) strong
Market Cap (` cr)
1,118
branding (Red Tape) in the shoes segment.
Beta
1.5
MIL’s major export revenue comes from the UK (73%), followed by the US
52 Week High / Low
138 /69
(14%) and the balance from ROW. Export constitutes ~75% of the company’s
total revenue. We expect the company to report healthy growth over the next
2-3 years on back of recovery in the UK market, strong growth in the US market
3 year-Chart
and with it tapping newer international geographies like the Middle East countries.
160
140
In FY2016, the company acquired Genesis Footwear which has a better
120
margin profile than it. The deal resulted in MIL’s EPS increasing by ~4% and
100
ROE improving from 15.9% to 17.5%. Further, due to this merger, the
80
company’s capacity has increased from 5.4mn to 6.4mn units.
60
We expect MIL to report a net revenue CAGR of ~11.3% to ~`1,124cr and
40
20
net profit CAGR of ~11.3% to `97cr over FY2016-18E. We have a Buy rating
-
on the stock and target price of `107.
Key Financials
Y/E
Sales OPM PAT EPS ROE P/E P/BV EV/EBITDA EV/Sales
Source: Company, Angel Research
March
(` cr)
(%)
(` cr)
(`)
(%)
(x)
(x)
(x)
(x)
FY2017E
1024
18.0
83
6.9
16.6
13.5
2.3
7.2
1.3
FY2018E
1,148
18.0
97
8.0
16.3
11.6
1.9
6.3
1.1
Source: Company, Angel Research
Stock Info
Siyaram Silk Mills
CMP
1,548
SSML has strong brands which cater to premium as well as popular mass
TP
1,720
segments of the market. Further, SSML entered the ladies' salwar kameez and
Upside
11.1%
ethnic wear segment. Going forward, we believe that the company would be able to
Sector
Textile
leverage its brand equity and continue to post strong performance.
Market Cap (` cr)
1,451
The company has a nationwide network of about 1,600 dealers and business
partners. It has a retail network of 160 stores and plans to add another
Beta
0.8
300-350 stores going forward. Further, the company's brands are sold across
52 Week High / Low
1,690/925
3,00,000 multi brand outlets in the country.
Going forward, we expect SSML to report a net sales CAGR of ~10% to
3 year-Chart
~`1,948cr and adj.net profit CAGR of ~11% to `107cr over FY2016-18E on
1,800
back of market leadership in blended fabrics, strong brand building, wide
1,600
distribution channel, strong presence in tier II and tier III cities and emphasis
1,400
1,200
on latest designs and affordable pricing points. At the current market price,
1,000
SSML trades at an inexpensive valuation. We have an Accumulate
800
recommendation on the stock and target price of `1,720.
600
400
Key Financials
200
-
Y/E
Sales
OPM PAT EPS ROE P/E P/BV EV/EBITDA EV/Sales
March
(` cr)
(%)
(` cr)
(`)
(%)
(x)
(x)
(x)
(x)
FY2017E
1,652
11.6
87
92.4
14.7
16.7
2.5
9.3
1.1
Source: Company, Angel Research
FY2018E
1,857
11.7
103
110.1
15.2
14.1
2.1
8.2
1.0
Source: Company, Angel Research
February 4, 2017
6
Top Picks Report | February 2017
Stock Info
HCL Technologies
CMP
829
Healthy pipeline: Company’s engineering services has been seeing lumpy
TP
1,000
growth over the last few quarters. This is however largely a function of the
Upside
20.6%
timing of large transformational deals. 6-8 of the large deals signed a few
Sector
IT
quarters ago will aid the company to continue to post industry leading growth.
Market Cap (` cr)
1,17,052
We expect HCL Tech to post a USD and INR revenue CAGR of 16.3% and
Beta
0.6
18.0%, respectively, over FY2016-18E (inclusive of the acquisition of
52 Week High / Low
890 / 707
Geometric Software and the Volvo deal).
Robust outlook: For FY2017 revenues are expected to grow between 12.0-
3 year-Chart
14.0% in CC. Revenue guidance is based on FY2016 (April to March’2016)
1,200
average exchange rates. The above constant currency guidance translates to
1,000
11.2% to 13.2% growth in US$ terms.
800
Outlook and Valuations: The stock is attractively valued at the current market
600
price and hence we maintain our Buy with a price target of `1,000.
400
200
Key Financials
Y/E
Sales
OPM PAT EPS ROE P/E P/BV EV/EBITDA EV/Sales
-
June
(`cr)
(%)
(`cr)
(`)
(%)
(x)
(x)
(x)
(x)
FY2017E
49,242
20.5
7,862
55.7
20.3
14.9
3.0
10.2
2.2
Source: Company, Angel Research
FY2018E
57,168
20.5
9,037
64.1
17.9
12.9
2.3
7.8
1.8
Source: Company, Angel Research
Stock Info
Infosys
CMP
935
Revenue guidance for FY17: The Management has lowered its guidance for
TP
1,249
FY2017, to 8-9% in CC terms and 9.2-10.2% in INR terms (exchange rate as
Upside
33.6%
on March 31, 2016). For FY2016, the company posted a 13.3% growth in CC
Sector
IT
terms V/s a guidance of 12.8-13.2% growth (in CC). We expect the company
Market Cap (` cr)
2,14,753
to post ~9.0% USD revenue growth in FY2017.
Beta
0.8
Aims to be US$20bn company by FY20: Company expects its revenue to rise
52 Week High / Low
1,278 / 900
to US$20bn by FY2020, up from US$8.7bn in FY2015, as it focuses on
acquisitions and winning more new technology services, implying a
3 year-Chart
14% CAGR over the period. Over the near term, we expect Infosys to post a
1,400
9.0% USD revenue growth in FY2017. Over FY2016-18E, we expect
1,200
USD and INR revenue to grow at a CAGR of 9.0% and 9.5%, respectively.
1,000
Outlook and Valuations: The stock trades at a valuation of 18x FY2018E
800
earnings. We recommend Buy on the stock with a price target of `1,249.
600
400
Key Financials
200
Y/E
Sales
OPM PAT EPS ROE P/E P/BV EV/EBITDA EV/Sales
-
March
(` cr)
(%)
(` cr)
(`)
(%)
(x)
(x)
(x)
(x)
FY2017E
68,350
27.0
14,354
62.5
21.3
15.0
3.2
11.0
2.6
FY2018E
77,236
27.0
15,928
69.4
21.6
13.5
2.9
9.8
2.2
Source: Company, Angel Research
Source: Company, Angel Research
February 4, 2017
7
Top Picks Report | February 2017
Stock Info
Jagran Prakashan
CMP
187
We expect JPL to register a net sales CAGR of ~12% over FY2016-18E, on
TP
225
back of (a) strong growth in advertising revenue due to improvement in GDP
Upside
20.3%
growth, and (b) improvement in circulation revenue owing to combination of
Sector
Media
increase in cover price and volume growth.
Market Cap (` cr)
6,118
Further the acquisition of Radio City would also boost the company's revenue
going ahead. Radio City has ~20 stations across 7 states in the country and is
Beta
0.6
second only to ENIL in all its operating circles, ie Delhi, Mumbai, Bengaluru,
52 Week High / Low
213/144
Chennai, Ahmedabad, Hyderabad, Pune and Lucknow. The company covers
~51% (~66mn people) of the total radio population.
3 year-Chart
Raw material prices have been in a declining trend. Thus, considering lower
250
news print costs, healthy sales, and higher margins in the radio business, we
200
expect an adj. net profit CAGR of ~12% over FY2016-18E to `409cr.
150
Considering Dainik Jagran's strong presence in the rapidly growing Hindi
markets, we expect JPL to benefit from an eventual recovery in the Indian
100
economy. Hence, we maintain a Buy rating on the stock with a target price of
50
`225.
-
Key Financials
Y/E
Sales
OPM PAT EPS ROE P/E P/BV EV/EBITDA EV/Sales
March
(` cr)
(%)
(` cr)
(`)
(%)
(x)
(x)
(x)
(x)
Source: Company, Angel Research
FY2017E
2,355
28.0
353
10.8
21.7
17.3
3.8
9.1
2.6
FY2018E
2,635
28.0
409
12.5
21.7
15.0
3.3
7.9
2.3
Source: Company, Angel Research
Stock Info
TV Today Network
CMP
270
TTNL enjoys a strong viewership ranking in the Hindi and English news
TP
385
channel categories. The company’s Hindi news channel - Aaj Tak has
Upside
42.6%
maintained its market leadership position occupying the No.1 rank for several
Sector
Media
consecutive years in terms of viewership. Its English news channel - India
Today too has been continuously gaining viewership; it has now captured the
Market Cap (` cr)
1,609
No. 2 ranking from No. 4 earlier. Its other channels like Dilli Aaj Tak and Tez
Beta
1.3
are also popular among viewers.
52 Week High / Low
360 /250
Out of the 7 radio stations, TTNL has sold off 4 (Jodhpur, Amritsar, Patiala
and Shimla) for `4cr. The remaining 3 stations are in the process of getting
3 year-Chart
sold off to ENIL but the sale will have to wait until concerns raised by the MIB
400
are resolved. Going forward, we expect them to be sold off and this would
350
prop up the company’s profitability.
300
250
We expect TTNL to report a net revenue CAGR of ~16% to ~`743cr and net
200
profit CAGR of
~16% to
`128cr over FY2016-18E. We have a Buy
150
recommendation on the stock and target price of `385
100
50
Key Financials
-
Y/E
Sales
OPM PAT EPS ROE P/E P/BV EV/EBITDA EV/Sales
March
(` cr)
(%)
(` cr)
(`)
(%)
(x)
(x)
(x)
(x)
FY2017E
637
27.5
110
18.4
17.4
14.7
2.6
8.0
2.1
Source: Company, Angel Research
FY2018E
743
27.5
128
21.4
17.2
12.6
2.2
6.5
1.7
Source: Company, Angel Research
February 4, 2017
8
Top Picks Report | February 2017
Stock Info
KEI Industries
CMP
168
Healthy order book indicates strong revenue visibility: KEI’s current order book
TP
207
(OB) stands at `3,233cr (segmental break-up: `2,154cr in EPC, `667cr in
Upside
23.2%
Cable, `200cr in EHV, `49cr in Substation, rest in EPC L1 business). Its OB
Sector
Cable
grew by ~28% in the last 3 years due to strong order inflows from State
Electricity Boards, Power grid, etc.
Market Cap (` cr)
1308
Strengthening distribution network and higher ad Spend to increase B2C
Beta
1.2
business: KEI’s consistent effort to increase its retail business from 30% of
52 Week High / Low
581 / 306
revenue in FY16 to 40-45% of revenue in the next 2-3 years on the back of
strengthening distribution network (currently 926 which is expect to increase
3 year-Chart
`1,500 by FY19) and higher ad spend (increased from `2cr in FY13 to `7cr in
180
FY16 and expected to spend).
160
140
Exports to continue its growth momentum: KEI’s export (FY16 - 8% of revenue)
120
is expected to reach a level of ~14-15% in next two years with higher order
100
80
execution from current OB of
~`180cr and participation in various
60
international tenders worth `500cr. We expect a strong ~26% growth CAGR
40
over FY2016-19 in exports. We expect KEI to report net revenue CAGR of
20
-
~13% to ~`3,335cr and net profit CAGR of ~24% to `118cr over FY2016-
19E. Hence we have a Buy rating on the stock and target price of `207.
Key Financials
Source: Company, Angel Research
Y/E
Sales
OPM PAT EPS ROE P/E P/BV EV/EBITDA EV/Sales
March
(` cr)
(%)
(` cr)
(`)
(%)
(x)
(x)
(x)
(x)
FY2017E
2,682
10.4
99
11.7
20.1
14.3
2.9
6.5
0.7
FY2018E
3,058
10.0
123
12.8
18.2
13.1
2.4
6.0
0.6
Source: Company, Angel Research
Stock Info
Larsen & Toubro
CMP
1,479
L&T’s, order backlog remains robust at `2.5trn (2.5x of FY16 revenues) of
TP
1,634
which 29.0% is international order backlog. It’s consolidated order inflow
Upside
10.5%
increased by 8.7% yoy to `311bn due to higher domestic order inflows in
Sector
Infrastructure
2QFY17. Domestic and international orders accounted for 76.3% and 23.7%
respectively in the inflows. Order growth was mainly from domestic
Market Cap (` cr)
1,37,985
infrastructure and international hydrocarbon segment.
Beta
1.4
L&T has maintained its guidance of (a) 15% growth in consolidated order
52 Week High / Low
1,615 / 1,017
inflows; (b) a 12-15% rise in consolidated revenues; and (c) up to a 50bps
improvement in EBITDA margins in core engineering. However, management
3 year-Chart
acknowledged is uncertain of the impact of currency de-monetization at
2,000
present. L&T’s order book has ~6% exposure to the high-end realty space.
1,800
Going forward we expect the company to report healthy top-line and bottom-
1,600
line growth on the back of execution of domestic orders. L&T’s order prospects
1,400
continue to remain strong. We are of the view that L&T is a proxy play for
1,200
investors wanting to ride on Indian infrastructure growth story. We recommend
1,000
an Accumulate on the stock with Target Price of `1,634.
800
Key Financials
Y/E
Sales
OPM PAT EPS ROE P/E P/BV EV/EBITDA EV/Sales
March
(` cr)
(%)
(` cr)
(`)
(%)
(x)
(x)
(x)
(x)
Source: Company, Angel Research
FY2017E
1,11,017
11.0
5,691
61.1
13.1
24.2
2.9
7.5
2.3
FY2018E
1,24,908
11.0
6,216
66.7
13.0
22.2
2.7
6.8
2.1
Source: Company, Angel Research
February 4, 2017
9
Top Picks Report | February 2017
Stock Info
Mahindra Lifespace
CMP
356
MLF has 13 projects under implementation across cities. MLF has exhibited
TP
522
fast completion of projects compared to others. Sales cycle in ~65% of
Upside
46.6%
projects is faster than execution cycle, contrary to industry trends. This fast
Sector
Real Estate
execution and sales is optimal, as it helps MLF in revenue recognition,
inventory cycle (better than Oberoi, DLF), cash flows and profitability.
Market Cap (` cr)
1,461
MLF as of 4QFY2016 is pursuing ~4.0mn sq. ft. of sale of the total ~15.0mn
Beta
0.4
sq. ft. of saleable area. Having sold ~60% of ongoing projects, we expect MLF
52 Week High / Low
500 / 343
to launch ~2.8mn sq.ft. of saleable area in rational way during 4QFY2016-
2QFY2018E, across 6 cities. Maturity at existing projects, new launches give better
3 year-Chart
revenue visibility for medium-term. Further, MLF is sitting on land bank of 11.0mn
700
sq.ft across 4 cities, which allay any concern over long-term revenue growth.
600
500
With Real Estate Regulatory Bill closer to reality, MLF should be minimally
400
impacted, given their strong parentage and ethically implemented processes.
300
In the longer-term organized, professionally run, well funded players would
200
enjoy strong trust due to their reliable and fast execution strategies. With
100
improvement in company’s fundamentals, strong earnings growth visibility
-
and long-term growth outlook, at current valuations of 1.1x FY2017E P/BV,
MLF looks attractive. We maintain BUY on MLF with target price of `522.
Key Financials
Source: Company, Angel Research
Y/E
Sales
OPM PAT EPS ROE P/E P/BV EV/EBITDA EV/Sales
March
(` cr)
(%)
(` cr)
(`)
(%)
(x)
(x)
(x)
(x)
FY2017E
1,152
22.7
75
29.9
7.6
11.9
0.9
14.2
2.0
FY2018E
1,300
24.6
138
35.8
8.6
9.9
0.8
8.5
1.7
Source: Company, Angel Research
Stock Info
Navkar
CMP
174
NCL is one of the largest and one of the three CFS at JNPT with rail
TP
265
connectivity, helping it garner high market share at the port. NCL is in a massive
Upside
52.3%
expansion mode where it is increasing its capacity by 234% to 1,036,889 TEUs
Sector
Logistics
at JNPT and coming up with an ICD at Vapi (with Logistics Park).
Market Cap (` cr)
2,481
The ICD with rail link should benefit from first mover advantage in a region
Beta
0.6
that has huge market potential and accounts for ~27% of volumes at JNPT.
52 Week High / Low
224 / 151
The ICD should be able to capture the EXIM volumes from the region through
rail link that till now was being custom cleared at JNPT (Import) or being
transported via road and consolidated at JNPT (Export). South Gujarat
3 year-Chart
250
volumes will now head straight to the Vapi ICD; thus the company can now
cater to bulk commodities and domestic traffic that it had been rejecting owing
200
to capacity constraints at CFS.
150
We expect NCL to successfully use its rail advantage and scale up its
100
utilizations at both JNPT and Vapi ICD. We have a Buy rating on the stock.
50
Key Financials
-
Y/E
Sales
OPM PAT EPS ROE P/E P/BV EV/EBITDA EV/Sales
March
(` cr)
(%)
(` cr)
(`)
(%)
(x)
(x)
(x)
(x)
FY2017E
369
42.9
103
7.2
7.4
24.1
1.8
17.4
7.7
Source: Company, Angel Research
FY2018E
561
42.3
164
11.5
10.5
15.1
1.6
11.1
5.1
Source: Company, Angel Research
February 4, 2017
10
Top Picks Report | February 2017
Stock Info
Power Grid Corporation
CMP
202
During the 1HFY2017, the company has already capitalized assets worth
TP
223
`120bn and is on track to achieve the capitalization guidance of `280bn-
Upside
10.4%
300bn for the full year. During the year, PGCIL has already commissioned
Sector
Power
pole-2 of the Assam-Agra HVDC line and is likely to commission its poles - 3
& 4, in addition to the `65bn Champa - Kurukshetra HVDC project, `19bn
Market Cap (` cr)
105,521
Srikakulam - Angul line and `36bn Wardha - Nizamabad line. Based on
Beta
0.7
status of pipeline of projects, we expect commissioning to be strong in rest of
52 Week High / Low
194 / 127
the year.
During the 1HFY2017, the total order awarded was `181bn. Total order size to be
3 year-Chart
awarded over next 18 months is ~ `330bn which indicates its healthy prospects.
250
Going forward, we expect the company to report strong top-line CAGR of
200
~16% and bottom-line CAGR of ~19% on back of strong capitalization
150
guidance. We recommend an Accumulate on the stock with Target Price of
100
`223.
50
Key Financials
Y/E
Sales
OPM PAT EPS ROE P/E P/BV EV/EBITDA EV/Sales
-
March
(` cr)
(%)
(` cr)
(`)
(%)
(x)
(x)
(x)
(x)
FY2017E
25,315
88.2
7,405
14.2
15.2
14.3
2.2
9.8
8.8
Source: Company, Angel Research
FY2018E
29,193
88.7
8,979
17.2
16.1
11.3
1.9
8.7
7.9
Source: Company, Angel Research
Stock Info
Alkem Leboratories
CMP
1,812
Alkem is 5th largest pharma company is the domestic market. It has presence
TP
1,989
in India, US and a few other countries. The 73% of its revenues come from the
Upside
9.8%
Indian markets while 20% come from the US and rest from the other countries.
The company has leadership position in the anti infective segment in India and
Sector
Pharma
it is ranked as no. 3 in Gastro-Intestinal and Pain/Analgesics segments.
Market Cap (` cr)
21,662
Overall it holds 3.6% market share in the domestic formulations business and
Beta
0.25
7.9% share in in overall prescriptions in country.
52 Week High / Low
1,853/ 1,175
In the domestic market, company operates in acute and chronic segments. It is
a prominent player in acute segment but still an entrant in chronic segment. It
3 year-Chart
has aggressively hired sales force in last three years to increase its sales from
1,900
chronic segment. Alkem has a strong track record of growth in the domestic
1,800
market which is likely to continue. In the US, company is focusing on
1,700
1,600
monetization of its ANDA pipeline. As of September 2016, company has a
1,500
pipeline of 76 ANDAs of which 34 are approved. Company expects to launch
1,400
~7-8 ANDAs each year and expects to improve the filing rate as well. Overall
1,300
1,200
US revenues are expected to grow at ~25% growth rate.
1,100
Overall outlook remains strong with 17.6% CAGR in the topline and 22.3%
1,000
CAGR in the bottom-line. We have an Accumulate rating on the stock.
Key Financials
Source: Company, Angel Research
Y/E
Sales
OPM PAT EPS ROE P/E P/BV EV/EBITDA EV/Sales
March
(` cr)
(%)
(` cr)
(`)
(%)
(x)
(x)
(x)
(x)
FY2017E
6,043
18.7
973
80.5
22.3
22.5
5.0
14.7
3.5
FY2018E
6,893
19.3
1,062
88.8
20.3
20.4
4.2
12.4
3.0
Source: Company, Angel Research
February 4, 2017
11
Top Picks Report | February 2017
Stock Info
Lupin
CMP
1,491
Lupin is the fastest growing company among the top 5 companies in domestic
TP
1,809
formulation space, registering a CAGR of 20.0% vs. market growth of ~13-
Upside
21.3%
14%. Six of Lupin's products are among the top 300 brands in the country.
Sector
Pharma
In US market, Lupin is currently the 5th largest generic player with 5.3% market
Market Cap (` cr)
67,289
share in prescriptions. Lupin has total 338 ANDA filings, of which 196 have
been approved, with 45 FTFs valued at more than US$13bn. Lupin plans to
Beta
0.77
launch 25-30 products in the US in FY2017. We expect a CAGR of 22.9% in
52 Week High / Low
1,912 / 1,294
US market during FY2016-18E on back of new product launches.
Lupin figures among the few Indian companies with a formidable presence in
3 year-Chart
2,500
Japan, the world’s second largest pharma market. Management believes that
there will be patent expiries of ~US$14-16bn in next two years in the
2,000
Japanese market, which along with increased generic penetration would drive
1,500
growth in the market. The Management expects improvement in growth in the
next 3-4 years. We recommend to buy this stock with target price of `1,809.
1,000
500
Key Financials
Y/E
Sales
OPM PAT EPS ROE P/E P/BV EV/EBITDA EV/Sales
-
March
(` cr)
(%)
(` cr)
(`)
(%)
(x)
(x)
(x)
(x)
FY2017E
15,912
26.4
2,611
58.1
21.4
25.7
5.0
16.3
4.3
FY2018E
18,644
26.7
3,117
69.3
20.9
21.5
4.1
13.1
3.5
Source: Company, Angel Research
Source: Company, Angel Research
February 4, 2017
12
Top Picks Report | February 2017
Macro watch
Exhibit 1: Quarterly GDP trends
Exhibit 2: IIP trends
(%)
(%)
9.0
7.0
8.3
5.7
7.9
6.0
8.0
7.5
7.5
7.6
7.2
7.3
5.0
7.1
6.6
6.7
4.0
7.0
6.4
3.0
2.2
5.8
1.9
6.0
2.0
1.3
0.7
1.0
0.3
5.0
-
4.0
(1.0)
(0.7)
(2.0)
(1.3)
3.0
(1.6)
(1.8)
(3.0)
(2.5)
Source: CSO, Angel Research
Source: MOSPI, Angel Research
Exhibit 3: Monthly CPI inflation trends
Exhibit 4: Manufacturing and services PMI
56.0
Mfg. PMI
Services PMI
(%)
7.0
54.0
6.1
5.7
5.8
5.8
6.0
5.3
5.5
5.1
52.0
4.8
5.0
4.4
4.2
50.0
3.6
4.0
3.4
48.0
3.0
46.0
2.0
1.0
44.0
-
42.0
Source: MOSPI, Angel Research
Source: Market, Angel Research; Note: Level above 50 indicates expansion
Exhibit 5: Exports and imports growth trends
Exhibit 6: Key policy rates
(%)
Exports yoy growth
Imports yoy growth
(%)
Repo rate
Reverse Repo rate
CRR
15.0
7.00
10.0
6.50
5.0
6.00
0.0
5.50
(5.0)
5.00
(10.0)
4.50
(15.0)
(20.0)
4.00
(25.0)
3.50
(30.0)
3.00
Source: Bloomberg, Angel Research
Source: RBI, Angel Research
February 4, 2017
13
Top Picks Report | February 2017
Global watch
Exhibit 1: Latest quarterly GDP Growth (%, yoy) across select developing and developed countries
(%)
8.0
6.8
5.3
6.0
5.0
0.7
4.3
4.0
3.2
2.2
1.9
1.5
2.0
1.1
1.1
-
(2.0)
(0.4)
(2.9)
(4.0)
Source: Bloomberg, Angel Research
Exhibit 2: 2016 GDP Growth projection by IMF (%, yoy) across select developing and developed countries
(%)
10.0
7.6
8.0
6.6
6.0
4.9
4.3
4.0
3.2
1.8
1.6
1.7
2.0
1.3
(0.8)
0.5
(3.3)
0.1
-
(2.0)
(4.0)
Source: IMF, Angel Research
Exhibit 3: One year forward P-E ratio across select developing and developed countries
(x)
20.0
18.0
16.0
14.0
12.0
10.0
8.0
6.0
4.0
2.0
-
Source: IMF, Angel Research
February 4, 2017
14
Top Picks Report | February 2017
Exhibit 4: Relative performance of indices across globe
Returns (%)
Country
Name of index
Closing price
1M
3M
1YR
Brazil
Bovespa
64,954
5.1
2.6
64.1
Russia
Micex
2,227
(1.6)
13.4
27.7
India
Nifty
8,741
6.7
3.0
15.6
China
Shanghai Composite
3,140
0.8
1.2
4.4
South Africa
Top 40
45,418
3.3
2.2
5.7
Mexico
Mexbol
47,225
1.4
1.2
11.4
Indonesia
LQ45
893
0.1
(3.4)
12.4
Malaysia
KLCI
1,685
2.6
0.8
3.3
Thailand
SET 50
991
1.0
5.1
24.8
USA
Dow Jones
20,071
1.0
11.3
23.9
UK
FTSE
7,188
(0.0)
5.0
26.3
Japan
Nikkei
18,918
(1.0)
8.4
13.2
Germany
DAX
11,651
0.6
13.6
33.1
France
CAC
4,825
(1.5)
10.2
17.3
Source: Bloomberg, Angel Research
February 4, 2017
15
Top Picks Report | February 2017
Stock Watch
February 4, 2017
16
Stock Watch | February 2017
Company Name
Reco
CMP
Target
Mkt Cap
Sales (` cr)
OPM (%)
EPS (`)
PER (x)
P/BV (x)
RoE (%)
EV/Sales (x)
(`)
Price (`)
(` cr)
FY17E
FY18E
FY17E
FY18E
FY17E
FY18E
FY17E
FY18E
FY17E
FY18E
FY17E
FY18E
FY17E
FY18E
Agri / Agri Chemical
Rallis
Neutral
250
-
4,859
1,937
2,164
13.3
14.3
9.0
11.0
27.8
22.7
4.8
4.2
18.4
19.8
2.5
2.2
United Phosphorus
Neutral
738
-
37,423
15,176
17,604
18.5
18.5
37.4
44.6
19.7
16.6
3.9
3.2
21.4
21.2
2.6
2.2
Auto & Auto Ancillary
Amara Raja Batteries
Accumulate
909
1,009
15,534
5,305
6,100
16.0
16.3
28.4
34.0
32.0
26.7
6.2
5.2
19.3
19.3
2.9
2.5
Apollo Tyres
Buy
183
235
9,330
12,877
14,504
14.3
13.9
21.4
23.0
8.6
8.0
1.3
1.2
16.4
15.2
0.9
0.8
Ashok Leyland
Buy
95
111
26,894
22,407
26,022
10.6
10.6
5.2
6.4
18.1
14.7
4.1
3.5
23.6
24.7
1.3
1.1
Bajaj Auto
Neutral
2,810
-
81,311
25,093
27,891
19.5
19.2
143.9
162.5
19.5
17.3
5.5
4.7
30.3
29.3
3.0
2.6
Bharat Forge
Neutral
948
-
22,060
7,726
8,713
20.5
21.2
35.3
42.7
26.8
22.2
5.0
4.5
18.9
20.1
2.9
2.5
Ceat
Buy
1,193
1,450
4,827
7,524
8,624
13.0
12.7
131.1
144.3
9.1
8.3
1.7
1.4
19.8
18.6
0.7
0.6
Eicher Motors
Neutral
23,386
-
63,618
16,583
20,447
17.5
18.0
598.0
745.2
39.1
31.4
13.4
10.2
41.2
38.3
3.7
2.9
Exide Industries
Neutral
209
-
17,752
7,439
8,307
15.0
15.0
8.1
9.3
25.8
22.5
3.6
3.2
14.3
16.7
2.0
1.8
Gabriel India
Buy
112
130
1,610
1,544
1,715
9.0
9.3
5.4
6.3
20.8
17.8
3.9
3.5
18.9
19.5
1.0
0.9
Hero Motocorp
Accumulate
3,216
3,541
64,215
30,958
34,139
15.7
15.7
193.6
208.3
16.6
15.4
6.5
5.4
34.2
30.5
1.9
1.7
Indag Rubber
Neutral
180
-
474
286
326
19.8
16.8
11.7
13.3
15.4
13.5
2.6
2.4
17.8
17.1
1.3
1.2
Jamna Auto Industries
Neutral
194
-
1,541
1,486
1,620
9.8
9.9
15.0
17.2
12.9
11.3
2.8
2.4
21.8
21.3
1.1
1.0
JK Tyres
Neutral
121
-
2,754
7,455
8,056
15.0
15.0
21.8
24.5
5.6
5.0
1.2
0.9
22.8
21.3
0.5
0.4
L G Balakrishnan & Bros Neutral
588
-
923
1,302
1,432
11.6
11.9
43.7
53.0
13.5
11.1
1.9
1.7
13.8
14.2
0.8
0.7
Mahindra and Mahindra Neutral
1,263
-
78,447
46,534
53,077
11.6
11.7
67.3
78.1
18.8
16.2
3.0
2.7
15.4
15.8
1.7
1.4
Maruti
Accumulate
6,118
6,560
1,84,813
67,822
83,288
16.0
16.4
253.8
312.4
24.1
19.6
5.5
4.5
23.0
22.9
2.4
1.9
Minda Industries
Neutral
383
-
3,042
2,728
3,042
9.0
9.1
68.2
86.2
5.6
4.4
1.3
1.0
23.8
24.3
1.2
1.0
Motherson Sumi
Neutral
340
-
47,744
45,896
53,687
7.8
8.2
13.0
16.1
26.1
21.1
8.4
6.7
34.7
35.4
1.1
0.9
Rane Brake Lining
Neutral
975
-
771
511
562
11.3
11.5
28.1
30.9
34.7
31.5
5.3
4.8
15.3
15.0
1.6
1.5
Setco Automotive
Neutral
37
-
494
741
837
13.0
13.0
15.2
17.0
2.4
2.2
0.4
0.4
15.8
16.3
1.0
1.0
Subros
Neutral
188
-
1,125
1,488
1,681
11.7
11.9
6.4
7.2
29.3
26.2
3.1
2.8
10.8
11.4
1.0
0.8
Swaraj Engines
Neutral
1,437
-
1,784
660
810
15.2
16.4
54.5
72.8
26.4
19.7
8.2
7.5
31.5
39.2
2.5
2.0
Tata Motors
Neutral
523
-
1,50,856
3,00,209
3,38,549
8.9
8.4
42.7
54.2
12.2
9.6
2.0
1.7
15.6
17.2
0.6
0.5
TVS Motor
Neutral
392
-
18,612
13,390
15,948
6.9
7.1
12.8
16.5
30.7
23.7
7.6
6.0
26.3
27.2
1.4
1.2
Banking
Axis Bank
Buy
490
580
1,17,099
46,932
53,575
3.5
3.4
32.3
44.6
15.1
11.0
1.9
1.69
13.6
16.5
-
-
Bank of Baroda
Neutral
186
-
42,927
19,980
23,178
1.8
1.8
11.5
17.3
16.2
10.8
1.9
1.5
8.3
10.1
-
-
Canara Bank
Neutral
311
-
16,865
15,225
16,836
1.8
1.8
14.5
28.0
21.4
11.1
1.5
1.2
5.8
8.5
-
-
Can Fin Homes
Accumulate
2,001
2,128
5,328
420
526
3.5
3.5
86.5
107.8
23.1
18.6
5.0
4.1
23.6
24.1
-
-
Cholamandalam Inv.
Buy
1,044
1,230
16,313
2,012
2,317
6.3
6.3
42.7
53.6
24.4
19.5
3.9
3.3
16.9
18.3
-
-
Dewan Housing Finance Buy
297
350
9,290
2,225
2,688
2.9
2.9
29.7
34.6
10.0
8.6
1.6
1.4
16.1
16.8
-
-
Equitas Holdings
Buy
183
235
6,149
939
1,281
11.7
11.5
5.8
8.2
31.6
22.4
2.7
2.4
10.9
11.5
-
-
Federal Bank
Neutral
85
-
14,548
8,259
8,995
3.0
3.0
4.3
5.6
19.7
15.1
1.7
1.5
8.5
10.1
-
-
HDFC
Neutral
1,396
-
2,21,244
11,475
13,450
3.4
3.4
45.3
52.5
30.8
26.6
5.9
5.2
20.2
20.5
-
-
HDFC Bank
Neutral
1,311
-
3,34,774
46,097
55,433
4.5
4.5
58.4
68.0
22.5
19.3
3.9
3.29
18.8
18.6
-
-
ICICI Bank
Accumulate
281
315
1,63,796
42,800
44,686
3.1
3.3
18.0
21.9
15.6
12.8
2.1
2.0
11.1
12.3
-
-
February 4, 2017
17
Stock Watch | February 2017
Company Name
Reco
CMP
Target
Mkt Cap
Sales (` cr)
OPM (%)
EPS (`)
PER (x)
P/BV (x)
RoE (%)
EV/Sales (x)
(`)
Price (`)
(` cr)
FY17E
FY18E
FY17E
FY18E
FY17E
FY18E
FY17E
FY18E
FY17E
FY18E
FY17E
FY18E
FY17E
FY18E
Lakshmi Vilas Bank
Buy
140
174
2,679
3,339
3,799
2.7
2.8
11.0
14.0
12.7
10.0
1.3
1.2
11.2
12.7
-
-
LIC Housing Finance
Accumulate
559
630
28,201
3,712
4,293
2.6
2.5
39.0
46.0
14.3
12.1
2.7
2.3
19.9
20.1
-
-
Punjab Natl.Bank
Neutral
150
-
31,920
23,532
23,595
2.3
2.4
6.8
12.6
22.1
11.9
3.4
2.4
3.3
6.5
-
-
RBL Bank
Neutral
390
-
14,428
1,783
2,309
2.6
2.6
12.7
16.4
30.7
23.8
3.3
3.0
12.8
13.3
-
-
South Ind.Bank
Neutral
22
-
3,021
6,435
7,578
2.5
2.5
2.7
3.1
8.3
7.2
1.1
0.9
10.1
11.2
-
-
St Bk of India
Neutral
277
-
2,21,185
88,650
98,335
2.6
2.6
13.5
18.8
20.5
14.8
2.0
1.7
7.0
8.5
-
-
Union Bank
Neutral
167
-
11,497
13,450
14,925
2.3
2.3
25.5
34.5
6.6
4.8
1.0
0.8
7.5
10.2
-
-
Yes Bank
Neutral
1,397
-
59,101
8,978
11,281
3.3
3.4
74.0
90.0
18.9
15.5
3.6
3.0
17.0
17.2
-
-
Capital Goods
ACE
Neutral
53
-
523
709
814
4.1
4.6
1.4
2.1
37.8
25.2
1.6
1.5
4.4
6.0
0.9
0.8
BEML
Neutral
1,256
-
5,232
3,451
4,055
6.3
9.2
31.4
57.9
40.0
21.7
2.4
2.2
6.3
10.9
1.6
1.4
BGR Energy
Neutral
135
-
977
16,567
33,848
6.0
5.6
7.8
5.9
17.4
22.9
1.0
1.0
4.7
4.2
0.2
0.1
Bharat Electronics
Neutral
1,544
-
34,495
8,137
9,169
16.8
17.2
58.7
62.5
26.3
24.7
4.1
3.6
44.6
46.3
3.2
2.9
BHEL
Neutral
143
-
34,939
28,797
34,742
-
2.8
2.3
6.9
62.1
20.7
1.1
1.0
1.3
4.8
0.9
0.6
Blue Star
Buy
538
634
5,138
4,283
5,077
5.9
7.3
14.9
22.1
36.1
24.3
7.0
5.9
20.4
26.4
1.2
1.0
Crompton Greaves
Neutral
68
-
4,249
5,777
6,120
5.9
7.0
3.3
4.5
20.5
15.1
0.9
0.9
4.4
5.9
0.7
0.6
Greaves Cotton
Neutral
140
-
3,415
1,755
1,881
16.8
16.9
7.8
8.5
17.9
16.5
3.6
3.3
20.6
20.9
1.6
1.5
Inox Wind
Neutral
184
-
4,079
5,605
6,267
15.7
16.4
24.8
30.0
7.4
6.1
2.1
1.5
25.9
24.4
0.8
0.6
KEC International
Neutral
152
-
3,896
9,294
10,186
7.9
8.1
9.9
11.9
15.3
12.7
2.2
1.9
15.6
16.3
0.7
0.6
KEI Industries
Buy
168
207
1,308
2,682
3,058
10.4
10.0
11.7
12.8
14.3
13.1
2.9
2.4
20.1
18.2
0.7
0.6
Thermax
Neutral
830
-
9,886
5,421
5,940
7.3
7.3
25.7
30.2
32.3
27.5
3.9
3.6
12.2
13.1
1.7
1.6
VATech Wabag
Buy
490
681
2,671
3,136
3,845
8.9
9.1
26.0
35.9
18.8
13.6
2.4
2.0
13.4
15.9
0.8
0.6
Voltas
Buy
331
407
10,954
6,511
7,514
7.9
8.7
12.9
16.3
25.7
20.3
4.6
4.0
16.7
18.5
1.4
1.2
Cement
ACC
Neutral
1,426
-
26,787
11,225
13,172
13.2
16.9
44.5
75.5
32.1
18.9
3.0
2.8
11.2
14.2
2.4
2.0
Ambuja Cements
Neutral
229
-
45,521
9,350
10,979
18.2
22.5
5.8
9.5
39.5
24.1
3.3
3.0
10.2
12.5
4.9
4.1
India Cements
Neutral
162
-
4,970
4,364
4,997
18.5
19.2
7.9
11.3
20.5
14.3
1.5
1.4
8.0
8.5
1.9
1.7
JK Cement
Neutral
755
-
5,275
4,398
5,173
15.5
17.5
31.2
55.5
24.2
13.6
2.9
2.5
12.0
15.5
1.7
1.4
J K Lakshmi Cement
Buy
393
565
4,629
2,913
3,412
14.5
19.5
7.5
22.5
52.4
17.5
3.2
2.7
12.5
18.0
2.2
1.8
Orient Cement
Buy
143
215
2,920
2,114
2,558
18.5
20.5
8.1
11.3
17.6
12.6
2.6
2.2
9.0
14.0
2.0
1.6
UltraTech Cement
Neutral
3,738
-
1,02,583
25,768
30,385
21.0
23.5
111.0
160.0
33.7
23.4
4.3
3.8
13.5
15.8
4.1
3.4
Construction
Engineers India
Neutral
150
-
10,118
1,725
1,935
16.0
19.1
11.4
13.9
13.2
10.8
1.8
1.8
13.4
15.3
4.8
4.3
Gujarat Pipavav Port
Neutral
150
-
7,269
705
788
52.2
51.7
5.0
5.6
30.1
26.8
3.0
2.7
11.2
11.2
10.0
8.4
ITNL
Neutral
110
-
3,627
8,946
10,017
31.0
31.6
8.1
9.1
13.6
12.1
0.5
0.5
4.2
5.0
3.7
3.5
KNR Constructions
Neutral
185
-
2,608
1,385
1,673
14.7
14.0
41.2
48.5
4.5
3.8
0.8
0.7
14.9
15.2
2.0
1.6
Larsen & Toubro
Accumulate
1,479
1,634
1,37,985
1,11,017
1,24,908
11.0
11.0
61.1
66.7
24.2
22.2
2.9
2.7
13.1
12.9
2.3
2.1
MEP Infra
Neutral
41
-
674
1,877
1,943
30.6
29.8
3.0
4.2
13.8
9.9
6.7
4.5
0.6
0.6
1.7
1.6
Nagarjuna Const.
Neutral
85
-
4,731
8,842
9,775
9.1
8.8
5.3
6.4
16.1
13.3
1.3
1.2
8.2
9.1
0.7
0.6
NBCC
Neutral
276
-
16,542
7,428
9,549
7.9
8.6
8.2
11.0
33.6
25.1
1.7
1.3
28.2
28.7
1.9
1.4
February 4, 2017
18
Stock Watch | February 2017
Company Name
Reco
CMP
Target
Mkt Cap
Sales (` cr)
OPM (%)
EPS (`)
PER (x)
P/BV (x)
RoE (%)
EV/Sales (x)
(`)
Price (`)
(` cr)
FY17E
FY18E
FY17E
FY18E
FY17E
FY18E
FY17E
FY18E
FY17E
FY18E
FY17E
FY18E
FY17E
FY18E
PNC Infratech
Buy
106
143
2,710
2,350
2,904
13.1
13.2
9.0
8.8
11.7
12.0
0.4
0.4
15.9
13.9
1.3
1.0
Power Mech Projects
Neutral
451
-
663
1,801
2,219
12.7
14.6
72.1
113.9
6.3
4.0
1.1
1.0
16.8
11.9
0.4
0.3
Sadbhav Engineering
Accumulate
283
298
4,859
3,598
4,140
10.3
10.6
9.0
11.9
31.5
23.8
3.3
2.9
9.9
11.9
1.6
1.4
Simplex Infra
Neutral
312
-
1,543
6,829
7,954
10.5
10.5
31.4
37.4
9.9
8.3
1.0
0.9
9.9
13.4
0.6
0.5
SIPL
Neutral
100
-
3,526
1,036
1,252
65.5
66.2
(8.4)
(5.6)
-
-
3.7
4.3
(22.8)
(15.9)
11.6
9.7
FMCG
Asian Paints
Neutral
985
-
94,515
17,128
18,978
16.8
16.4
19.1
20.7
51.6
47.6
17.9
16.9
34.8
35.5
5.4
4.9
Britannia
Accumulate
3,230
3,626
38,757
9,594
11,011
14.6
14.9
80.3
94.0
40.2
34.4
16.5
12.8
41.2
-
3.9
3.3
Colgate
Accumulate
901
995
24,509
4,605
5,149
23.4
23.4
23.8
26.9
37.9
33.5
21.0
16.4
64.8
66.8
5.2
4.7
Dabur India
Accumulate
269
304
47,438
8,315
9,405
19.8
20.7
8.1
9.2
33.2
29.3
9.3
7.7
31.6
31.0
5.4
4.7
GlaxoSmith Con*
Neutral
5,076
-
21,345
4,350
4,823
21.2
21.4
179.2
196.5
28.3
25.8
7.5
6.4
27.1
26.8
4.3
3.8
Godrej Consumer
Neutral
1,582
-
53,871
10,235
11,428
18.4
18.6
41.1
44.2
38.5
35.8
8.5
7.2
24.9
24.8
5.3
4.7
HUL
Neutral
848
-
1,83,595
35,252
38,495
17.8
17.8
20.6
22.4
41.1
37.9
39.3
33.7
95.6
88.9
5.0
4.6
ITC
Neutral
272
-
3,30,246
40,059
44,439
38.3
39.2
9.0
10.1
30.3
26.9
8.5
7.4
27.8
27.5
7.7
7.0
Marico
Buy
256
300
33,014
6,430
7,349
18.8
19.5
6.4
7.7
40.0
33.2
12.1
10.2
33.2
32.5
4.9
4.3
Nestle*
Neutral
6,079
-
58,607
10,073
11,807
20.7
21.5
124.8
154.2
48.7
39.4
20.0
18.0
34.8
36.7
5.6
4.8
Procter & Gamble
Accumulate
7,000
7,369
22,724
2,939
3,342
23.2
23.0
146.2
163.7
47.9
42.8
107.2
102.8
25.3
23.5
7.3
6.3
Tata Global
Neutral
142
-
8,953
8,675
9,088
9.8
9.8
7.4
8.2
19.2
17.3
2.2
2.1
7.9
8.1
0.9
0.9
IT
HCL Tech^
Buy
829
1,000
1,17,052
49,242
57,168
20.5
20.5
55.7
64.1
14.9
12.9
3.0
2.3
20.3
17.9
2.2
1.8
Infosys
Buy
935
1,249
2,14,753
68,350
77,326
27.0
27.0
62.5
69.4
15.0
13.5
3.2
2.9
21.3
21.6
2.6
2.2
TCS
Buy
2,234
2,620
4,40,144
1,19,025
1,33,308
27.6
27.6
131.2
145.5
17.0
15.4
5.5
5.1
32.4
33.1
3.5
3.1
Tech Mahindra
Buy
481
600
46,759
29,673
32,937
15.5
17.0
32.8
39.9
14.6
12.0
2.9
2.5
19.6
20.7
1.3
1.1
Wipro
Buy
457
583
1,11,018
55,440
60,430
18.1
18.1
36.1
38.9
12.7
11.7
2.3
2.1
19.0
17.6
1.7
1.5
Media
D B Corp
Neutral
379
-
6,971
2,297
2,590
27.4
28.2
21.0
23.4
18.1
16.2
4.2
3.6
23.7
23.1
2.8
2.4
Hindustan Media Ven.
Neutral
276
-
2,029
1,016
1,138
24.3
25.2
27.3
30.1
10.1
9.2
1.9
1.7
16.2
15.8
1.3
1.1
HT Media
Neutral
83
-
1,929
2,693
2,991
12.6
12.9
7.9
9.0
10.5
9.2
0.9
0.8
7.8
8.3
0.3
0.2
Jagran Prakashan
Buy
187
225
6,118
2,355
2,635
28.0
28.0
10.8
12.5
17.3
15.0
3.8
3.2
21.7
21.7
2.6
2.3
Sun TV Network
Neutral
684
-
26,949
2,850
3,265
70.1
71.0
26.2
30.4
26.1
22.5
6.7
5.9
24.3
25.6
9.0
7.8
TV Today Network
Buy
270
385
1,609
637
743
27.5
27.5
18.4
21.4
14.7
12.6
2.6
2.2
17.4
17.2
2.1
1.7
Metal
Coal India
Neutral
326
-
2,02,393
84,638
94,297
21.4
22.3
24.5
27.1
13.3
12.0
5.5
5.3
42.6
46.0
1.9
1.7
Hind. Zinc
Neutral
322
-
1,35,907
14,252
18,465
55.9
48.3
15.8
21.5
20.4
15.0
3.3
2.9
17.0
20.7
9.5
7.4
Hindalco
Neutral
192
-
39,587
1,07,899
1,12,095
7.4
8.2
9.2
13.0
20.8
14.7
1.0
0.9
4.8
6.6
0.9
0.8
JSW Steel
Neutral
191
-
46,169
53,201
58,779
16.1
16.2
130.6
153.7
1.5
1.2
0.2
0.2
14.0
14.4
1.6
1.4
NMDC
Neutral
148
-
46,920
6,643
7,284
44.4
47.7
7.1
7.7
20.9
19.3
1.8
1.8
8.8
9.2
4.8
4.4
SAIL
Neutral
66
-
27,073
47,528
53,738
(0.7)
2.1
(1.9)
2.6
-
25.2
0.7
0.7
(1.6)
3.9
1.4
1.3
Vedanta
Neutral
251
-
74,340
71,744
81,944
19.2
21.7
13.4
20.1
18.7
12.5
1.6
1.4
8.4
11.3
1.4
1.1
Tata Steel
Neutral
472
-
45,837
1,21,374
1,21,856
7.2
8.4
18.6
34.3
25.4
13.8
1.6
1.4
6.1
10.1
1.0
1.0
February 4, 2017
19
Stock Watch | February 2017
Company Name
Reco
CMP
Target
Mkt Cap
Sales (` cr)
OPM (%)
EPS (`)
PER (x)
P/BV (x)
RoE (%)
EV/Sales (x)
(`)
Price (`)
(` cr)
FY17E
FY18E
FY17E
FY18E
FY17E
FY18E
FY17E
FY18E
FY17E
FY18E
FY17E
FY18E
FY17E
FY18E
Oil & Gas
Cairn India
Neutral
276
-
51,755
9,127
10,632
4.3
20.6
8.8
11.7
31.4
23.6
1.0
1.0
3.3
4.2
7.1
5.9
GAIL
Neutral
478
-
60,601
56,220
65,198
9.3
10.1
27.1
33.3
17.6
14.3
1.6
1.5
9.3
10.7
1.3
1.1
Indian Oil Corp
Neutral
387
-
1,88,093
3,73,359
4,28,656
5.9
5.5
54.0
59.3
7.2
6.5
1.1
1.0
16.0
15.6
0.7
0.6
ONGC
Neutral
201
-
2,57,884
1,37,222
1,52,563
15.0
21.8
19.5
24.1
10.3
8.3
0.9
0.8
8.5
10.1
2.2
1.9
Reliance Industries
Neutral
1,034
-
3,35,290
3,01,963
3,58,039
12.1
12.6
87.7
101.7
11.8
10.2
1.2
1.1
10.7
11.3
1.6
1.3
Pharmaceuticals
Alembic Pharma
Neutral
557
-
10,506
3,483
4,083
20.2
21.4
24.3
30.4
22.9
18.3
5.2
4.2
25.5
25.3
3.0
2.4
Alkem Laboratories Ltd
Accumulate
1,812
1,989
21,662
6,043
6,893
18.7
19.3
80.5
88.8
22.5
20.4
5.0
4.1
22.3
20.3
3.5
3.0
Aurobindo Pharma
Buy
685
877
40,105
15,720
18,078
23.7
23.7
41.4
47.3
16.6
14.5
4.3
3.4
29.6
26.1
2.8
2.4
Aventis*
Neutral
4,080
-
9,396
2,277
2,597
17.3
18.3
149.4
172.0
27.3
23.7
4.5
3.6
25.1
28.8
3.8
3.1
Cadila Healthcare
Accumulate
365
400
37,331
10,429
12,318
22.6
22.0
16.9
19.2
21.6
19.0
5.5
4.4
28.5
25.7
3.6
2.9
Cipla
Sell
608
490
48,936
15,378
18,089
17.4
18.4
21.6
27.2
28.2
22.4
3.6
3.2
13.7
15.2
3.4
2.8
Dr Reddy's
Neutral
3,142
-
52,043
16,043
18,119
20.8
22.4
112.4
142.9
28.0
22.0
3.7
3.3
14.1
15.9
3.2
2.8
Dishman Pharma
Neutral
237
-
3,827
1,718
1,890
22.7
22.8
9.5
11.3
25.0
21.0
2.4
2.2
10.1
10.9
2.7
2.3
GSK Pharma*
Neutral
2,699
-
22,864
3,000
3,312
15.4
20.6
46.5
60.8
58.1
44.4
13.9
13.9
26.3
30.6
7.4
6.7
Indoco Remedies
Reduce
273
240
2,518
1,112
1,289
16.2
18.2
11.6
16.0
23.6
17.1
3.8
3.2
17.0
20.1
2.4
2.0
Ipca labs
Buy
531
613
6,703
3,303
3,799
15.3
15.3
17.3
19.7
30.7
27.0
2.7
2.4
9.1
9.4
2.2
1.9
Lupin
Buy
1,491
1,809
67,289
15,912
18,644
26.4
26.7
58.1
69.3
25.7
21.5
5.0
4.1
21.4
20.9
4.3
3.5
Sun Pharma
Buy
647
847
1,55,265
31,129
35,258
32.0
32.9
30.2
35.3
21.4
18.3
3.5
2.9
20.0
20.1
4.6
3.8
Power
NTPC
Neutral
172
-
1,41,781
86,605
95,545
17.5
20.8
11.8
13.4
14.6
12.8
1.5
1.4
10.5
11.1
3.0
3.0
Power Grid
Accumulate
202
223
1,05,521
25,315
29,193
88.2
88.7
14.2
17.2
14.2
11.8
2.2
1.9
15.2
16.1
8.8
7.9
Tata Power
Neutral
81
-
21,814
36,916
39,557
17.4
27.1
5.1
6.3
15.8
12.8
1.4
1.3
9.0
10.3
1.6
1.4
Real Estate
MLIFE
Buy
356
522
1,461
1,152
1,300
22.7
24.6
29.9
35.8
11.9
9.9
0.9
0.8
7.6
8.6
2.0
1.6
Prestige Estate
Buy
168
210
6,291
4,707
5,105
25.2
26.0
10.3
13.0
16.3
12.9
1.3
1.2
10.3
10.2
2.5
2.2
Telecom
Bharti Airtel
Neutral
354
-
1,41,368
1,05,086
1,14,808
34.5
34.7
12.2
16.4
29.0
21.6
2.0
1.8
6.8
8.4
2.3
2.0
Idea Cellular
Neutral
109
-
39,326
40,133
43,731
37.2
37.1
6.4
6.5
17.1
16.8
1.4
1.3
8.2
7.6
2.0
1.7
Others
Abbott India
Neutral
4,440
-
9,434
3,153
3,583
14.1
14.4
152.2
182.7
29.2
24.3
143.2
122.3
25.6
26.1
2.7
2.3
Asian Granito
Buy
271
351
815
1,060
1,169
12.2
12.5
12.7
15.9
21.4
17.0
2.0
1.8
9.5
10.6
1.1
0.9
Bajaj Electricals
Accumulate
250
274
2,530
4,801
5,351
5.7
6.2
10.4
13.7
24.0
18.3
3.0
2.6
12.4
14.5
0.5
0.5
Banco Products (India)
Neutral
214
-
1,529
1,353
1,471
12.3
12.4
14.5
16.3
14.7
13.1
20.4
18.3
14.5
14.6
1.1
114.9
Coffee Day Enterprises
Neutral
200
-
4,117
2,964
3,260
20.5
21.2
4.7
8.0
-
25.0
2.3
2.1
5.5
8.5
1.8
1.6
Competent Automobiles Neutral
170
-
104
1,137
1,256
3.1
2.7
28.0
23.6
6.1
7.2
32.7
29.5
14.3
11.5
0.1
0.1
Elecon Engineering
Neutral
57
-
642
1,482
1,660
13.7
14.5
3.9
5.8
14.7
9.9
3.4
3.2
7.8
10.9
0.7
0.7
Finolex Cables
Neutral
446
-
6,828
2,883
3,115
12.0
12.1
14.2
18.6
31.4
24.0
16.7
14.6
15.8
14.6
2.1
1.9
February 4, 2017
20
Stock Watch | February 2017
Company Name
Reco
CMP
Target
Mkt Cap
Sales (` cr)
OPM (%)
EPS (`)
PER (x)
P/BV (x)
RoE (%)
EV/Sales (x)
(`)
Price (`)
(` cr)
FY17E
FY18E
FY17E
FY18E
FY17E
FY18E
FY17E
FY18E
FY17E
FY18E
FY17E
FY18E
FY17E
FY18E
Garware Wall Ropes
Neutral
615
-
1,345
873
938
14.3
14.3
35.1
37.5
17.5
16.4
3.1
2.6
17.5
15.9
1.4
1.3
Goodyear India*
Neutral
728
-
1,679
1,598
1,704
10.4
10.2
49.4
52.6
14.7
13.8
68.0
59.7
18.2
17.0
0.7
102.4
Hitachi
Neutral
1,429
-
3,884
2,081
2,433
8.8
8.9
33.4
39.9
42.8
35.8
34.5
28.8
22.1
21.4
1.9
1.6
HSIL
Neutral
284
-
2,056
2,384
2,515
15.8
16.3
15.3
19.4
18.6
14.7
18.5
15.9
7.8
9.3
1.0
0.9
Interglobe Aviation
Neutral
859
-
31,036
21,122
26,005
14.5
27.6
110.7
132.1
7.8
6.5
46.4
33.2
168.5
201.1
1.4
1.1
Jyothy Laboratories
Neutral
351
-
6,368
1,440
2,052
11.5
13.0
8.5
10.0
41.3
35.1
10.0
9.3
18.6
19.3
4.7
3.3
Kirloskar Engines India
Neutral
343
-
4,959
2,554
2,800
9.9
10.0
10.5
12.1
32.7
28.3
13.7
12.9
10.7
11.7
1.6
1.4
Linc Pen & Plastics
Neutral
267
-
395
382
420
9.3
9.5
13.5
15.7
19.8
17.0
3.4
2.9
17.1
17.3
1.1
1.0
M M Forgings
Neutral
495
-
597
546
608
20.4
20.7
41.3
48.7
12.0
10.2
67.7
60.0
16.6
17.0
0.9
0.8
Manpasand Bever.
Neutral
660
-
3,776
836
1,087
19.6
19.4
16.9
23.8
39.1
27.7
4.7
4.1
12.0
14.8
4.3
3.2
Mirza International
Buy
93
107
1,118
1,024
1,148
18.0
18.0
6.9
8.0
13.5
11.6
2.3
1.9
16.6
16.3
1.3
1.1
MT Educare
Neutral
127
-
507
366
417
17.7
18.2
9.4
10.8
13.6
11.8
3.0
2.6
22.2
22.3
1.3
1.1
Narayana Hrudaya
Neutral
334
-
6,827
1,873
2,166
11.5
11.7
2.6
4.0
126.3
84.3
7.7
7.0
6.1
8.3
3.7
3.2
Navkar Corporation
Buy
174
265
2,481
369
561
42.9
42.3
7.2
11.5
24.1
15.1
1.8
1.6
7.3
10.5
7.7
5.1
Navneet Education
Neutral
133
-
3,107
1,062
1,147
24.0
24.0
6.1
6.6
21.8
20.1
4.5
4.0
20.5
19.8
3.0
2.8
Nilkamal
Neutral
1,672
-
2,495
1,995
2,165
10.7
10.4
69.8
80.6
24.0
20.7
95.5
83.0
16.6
16.5
1.2
1.1
Page Industries
Neutral
14,238
-
15,880
2,450
3,124
20.1
17.6
299.0
310.0
47.6
45.9
317.1
242.1
47.1
87.5
6.5
5.1
Parag Milk Foods
Neutral
270
-
2,272
1,919
2,231
9.3
9.6
9.4
12.9
28.6
20.9
4.4
3.7
15.5
17.5
1.3
1.1
Quick Heal
Neutral
278
-
1,949
408
495
27.3
27.0
7.7
8.8
35.9
31.6
3.3
3.3
9.3
10.6
3.9
3.2
Radico Khaitan
Buy
122
147
1,629
1,667
1,824
13.0
13.2
6.6
8.2
18.4
15.0
1.7
1.5
9.0
10.2
1.4
1.2
Relaxo Footwears
Neutral
438
-
5,259
2,085
2,469
9.2
8.2
7.6
7.9
57.9
55.1
22.5
19.2
17.9
18.8
2.6
2.2
S H Kelkar & Co.
Neutral
312
-
4,517
1,036
1,160
15.1
15.0
6.1
7.2
51.2
43.5
5.5
5.0
10.7
11.5
4.2
3.7
Siyaram Silk Mills
Accumulate
1,548
1,720
1,451
1,652
1,857
11.6
11.7
92.4
110.1
16.7
14.1
2.5
2.1
14.7
15.2
1.1
1.0
Styrolution ABS India*
Neutral
637
-
1,119
1,440
1,537
9.2
9.0
40.6
42.6
15.7
14.9
40.0
36.4
12.3
11.6
0.7
0.6
Surya Roshni
Neutral
191
-
837
3,342
3,625
7.8
7.5
17.3
19.8
11.1
9.7
21.0
16.8
10.5
10.8
0.5
0.5
Team Lease Serv.
Neutral
941
-
1,608
3,229
4,001
1.5
1.8
22.8
32.8
41.3
28.6
4.4
3.8
10.7
13.4
0.4
0.3
The Byke Hospitality
Neutral
164
-
656
287
384
20.5
20.5
7.6
10.7
21.5
15.3
4.5
3.6
20.7
23.5
2.3
1.7
Transport Corp. of India
Neutral
183
-
1,404
2,671
2,911
8.5
8.8
13.9
15.7
13.2
11.7
1.8
1.6
13.7
13.8
0.6
0.6
TVS Srichakra
Neutral
3,306
-
2,531
2,304
2,614
13.7
13.8
231.1
266.6
14.3
12.4
371.4
292.5
33.9
29.3
1.1
0.9
UFO Moviez
Neutral
422
-
1,166
619
685
33.2
33.4
30.0
34.9
14.1
12.1
1.9
1.7
13.8
13.9
1.6
1.3
Visaka Industries
Neutral
207
-
329
1,051
1,138
10.3
10.4
21.0
23.1
9.9
9.0
26.6
24.9
9.0
9.2
0.6
0.5
VRL Logistics
Neutral
302
-
2,752
1,902
2,119
16.7
16.6
14.6
16.8
20.7
17.9
4.5
4.0
21.9
22.2
1.6
1.4
Wonderla Holidays
Neutral
377
-
2,129
287
355
38.0
40.0
11.3
14.2
33.3
26.5
4.8
4.2
21.4
23.9
7.1
5.8
Source: Company, Angel Research, Note: *December year end; #September year end;
&October year end; ^June year end; Price as of February 3, 2017
February 4, 2017
21
Top Picks Report | February 2017
Research Team Tel: 022 - 39357800
DISCLAIMER
Angel Broking Private Limited (hereinafter referred to as “Angel”) is a registered Member of National Stock Exchange of India Limited,
Bombay Stock Exchange Limited and Metropolitan Stock Exchange Limited. It is also registered as a Depository Participant with CDSL
and Portfolio Manager with SEBI. It also has registration with AMFI as a Mutual Fund Distributor. Angel Broking Private Limited is a
registered entity with SEBI for Research Analyst in terms of SEBI (Research Analyst) Regulations, 2014 vide registration number
INH000000164. Angel or its associates has not been debarred/ suspended by SEBI or any other regulatory authority for accessing
/dealing in securities Market. Angel or its associates/analyst has not received any compensation / managed or co-managed public
offering of securities of the company covered by Analyst during the past twelve months.
This document is solely for the personal information of the recipient, and must not be singularly used as the basis of any investment
decision. Nothing in this document should be construed as investment or financial advice. Each recipient of this document should
make such investigations as they deem necessary to arrive at an independent evaluation of an investment in the securities of the
companies referred to in this document (including the merits and risks involved), and should consult their own advisors to determine
the merits and risks of such an investment.
Reports based on technical and derivative analysis center on studying charts of a stock's price movement, outstanding positions and
trading volume, as opposed to focusing on a company's fundamentals and, as such, may not match with a report on a company's
fundamentals. Investors are advised to refer the Fundamental and Technical Research Reports available on our website to evaluate the
contrary view, if any.
The information in this document has been printed on the basis of publicly available information, internal data and other reliable
sources believed to be true, but we do not represent that it is accurate or complete and it should not be relied on as such, as this
document is for general guidance only. Angel Broking Pvt. Limited or any of its affiliates/ group companies shall not be in any way
responsible for any loss or damage that may arise to any person from any inadvertent error in the information contained in this report.
Angel Broking Pvt. Limited has not independently verified all the information contained within this document. Accordingly, we cannot
testify, nor make any representation or warranty, express or implied, to the accuracy, contents or data contained within this document.
While Angel Broking Pvt. Limited endeavors to update on a reasonable basis the information discussed in this material, there may be
regulatory, compliance, or other reasons that prevent us from doing so.
This document is being supplied to you solely for your information, and its contents, information or data may not be reproduced,
redistributed or passed on, directly or indirectly.
Neither Angel Broking Pvt. Limited, nor its directors, employees or affiliates shall be liable for any loss or damage that may arise from
or in connection with the use of this information.
Ratings (Based on expected returns
Buy (> 15%)
Accumulate (5% to 15%)
Neutral (-5 to 5%)
over 12 months investment period):
Reduce (-5% to -15%)
Sell (< -15)