Angel Top Picks - December 2016
Top Picks
Demonetization offers long term gains
Company
CMP (`)
TP (`)
Indian markets corrected sharply in November as demonetization coupled with
Banking/NBFC
outcome of US presidential election created a huge volatility in the markets.
Dewan Housing
257
350
Demonetization has been the boldest reform of the current government which has
Equitas Holdings
161
235
a potential to bring structural long term benefits in the economy, while causing
Consumption
pain in the short term. By far, this looks like the one of the biggest reforms in
Amara Raja
940
1,167
recent years. Due to extraordinary cash crunch in the country, consumption has
Asian Granito
222
351
taken a huge beating. This in our opinion is short term in the nature as consumers
Bajaj Electricals
223
274
are buying only essential items to save cash and as liquidity eases, consumption is
Blue Star
491
634
likely to resume. This implies that demonetization has temporarily slowed the
Mirza International
81
107
economy and growth is likely to return in H2FY2018E with spurt in consumption.
Siyaram Silk Mills
1,250
1,605
We also opine that despite unavoidable short term pain, demonetization offers
IT
several long term benefits like higher tax compliance, lower inflation, improved
HCL Tech
803
1,000
transparency, etc. which will have positive impact on economy.
Infosys
975
1,249
Media
Spending impacted in near term…
Jagran Prakashan
176
225
In the short term, demonetization looks negative for the economy as it impacts
TV Today
315
385
spending ability of the consumers. This means that cash dependent sectors would
Real Estate/Infra/Logistics/Power
be impacted the most in the near term. We believe that demonetization would
Larsen & Toubro
1383
1634
have short to medium term negative impact on sectors like Jewellery and Real
Mahindra Lifespace
377
522
Estate sectors due to involvement of black money in transactions. We also believe
Navkar Corp.
175
265
that recovery is likely to start from mid FY2018E in consumption sectors as
Powr Grid Corporation
192
223
consumers realign their preferences. Overall unorganized segment of the economy
Pharma
would be most hit as most small businesses are hugely dependent on cash for
Alkem Lab.
1,700
1,989
daily transactions.
Lupin
1,503
1,809
Source: Angel Research;
Owing to the temporary slump in demand, corporate earnings are likely to show
Note: CMP as of Nov 30, 2016
negative impact of demonetization in H2FY2017E. Some spillover can be expected
in H1FY2018E, however from H2FY2018E onwards, consumption is likely to pick-
up with ease in liquidity and realignment of consumer preferences. With ~6%
decline in the broader indices after demonetization, markets are likely to have
priced in the negative impact of demonetization; and as dust settles, markets will
track positive impact of the demonetization.
…Benefits in long term
Demonetization is an extraordinary measure to curb black money and corruption
in the country. This is expected to reduce the size of the parallel economy which is
believed to be about 1/4th of the GDP. With the demonization, a significant of this
unaccounted cash will return to the banking system. As of 29th November, 2016,
`8.44trillion of banned currency has returned to the banking system giving a huge
boost to the bank deposits.
Demonetization is going to benefit the economy in multiple ways:
Higher tax revenues to increase public expenditure…: With increased vigilance,
government is likely to receive huge tax revenues this year. Also with better tax
compliance, we believe that tax revenues are likely to be better than previous years
going ahead. This opens up a room for the government to increase spending on
infrastructure, agriculture, defense, rural sector, etc. This will benefit the economy
Please refer to important disclosures at the end of this report
1
Top Picks Report | December 2016
in terms of revival of capex cycle and new job creation leading to have a multiplier
effect on the economy.
…and increase tax benefits: With huge tax revenue collected, government can also
pass on the benefits in form of direct and indirect tax. An increase in tax exemption
limits or reduction in indirect taxes will leave consumers with surplus cash for
discretionary spending. This will also help in reviving the consumption in the
economy.
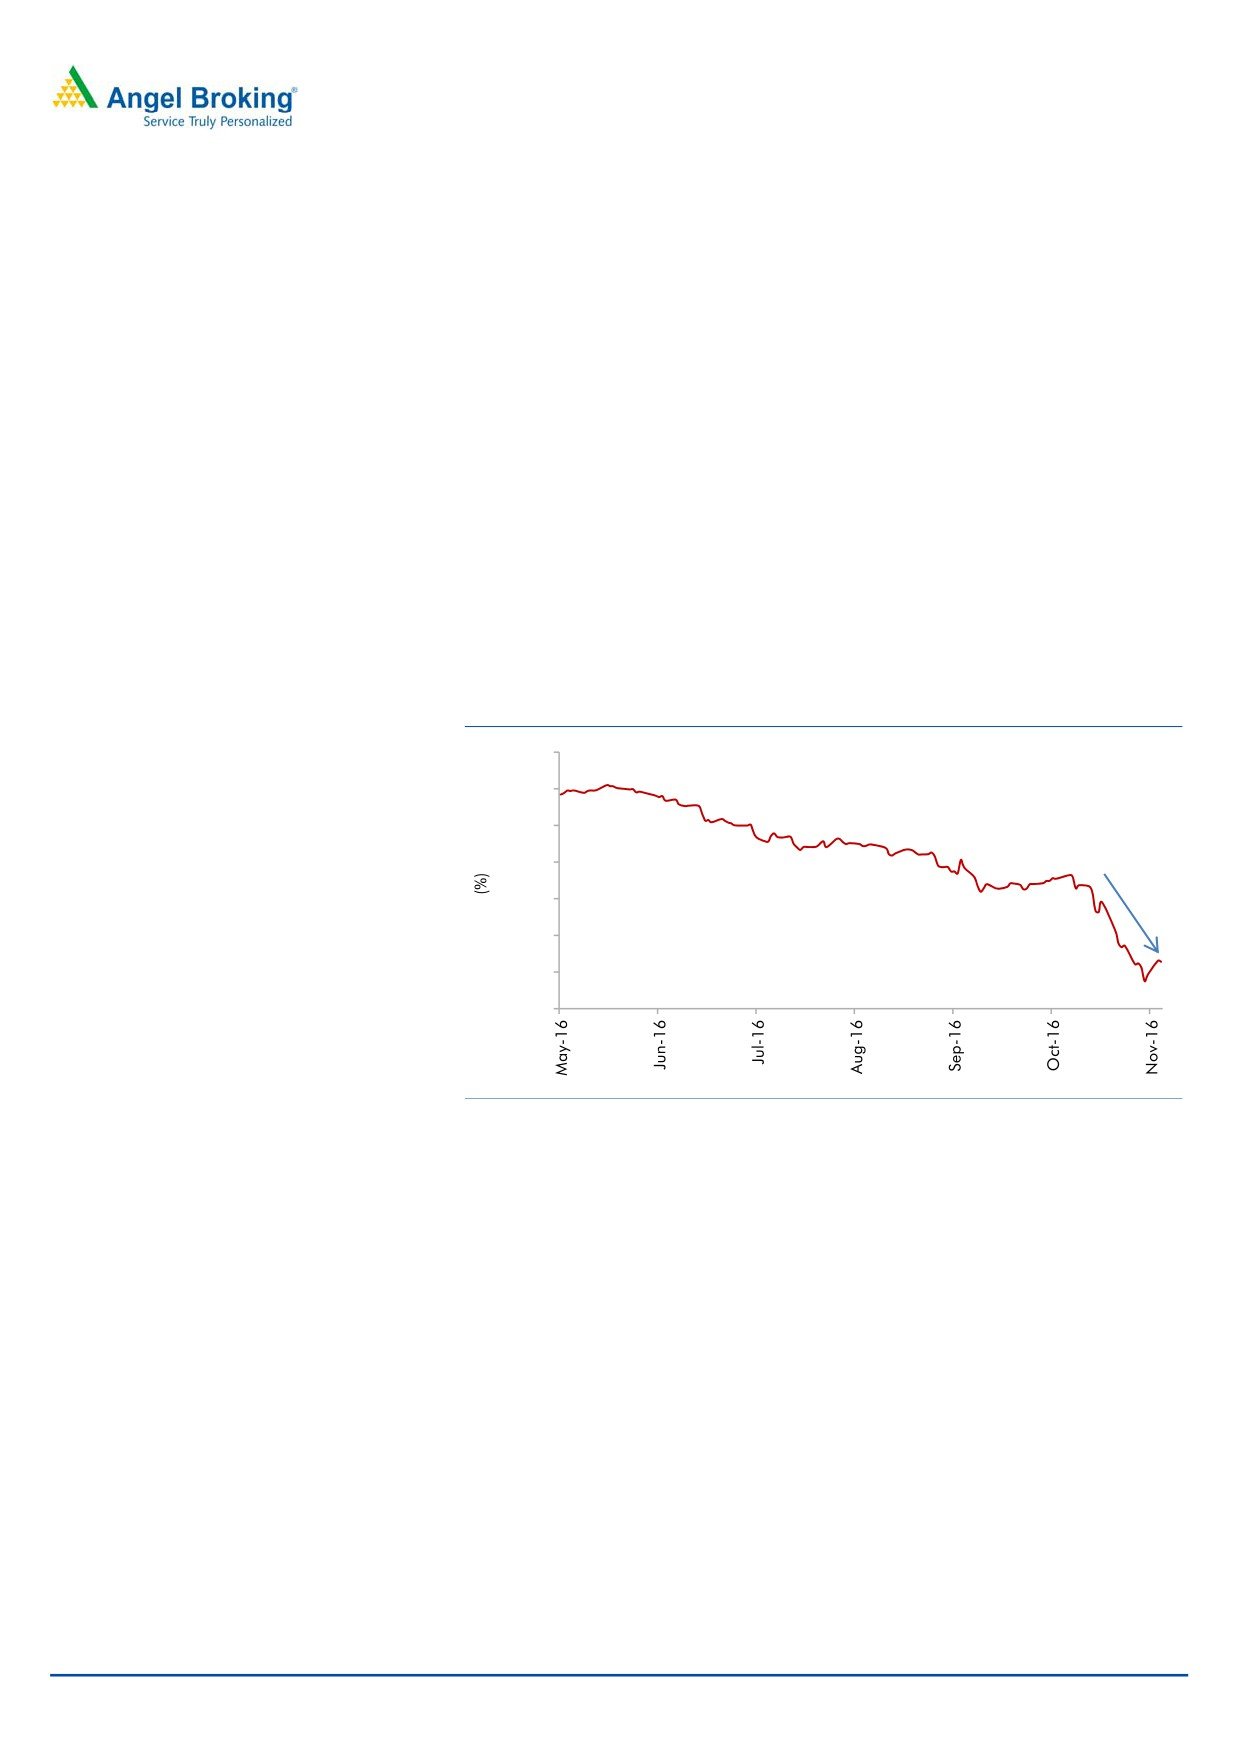
Easing inflation and availability of low cost funds creates room to cut interest rate:
As the consumer demand is expected to remain weak in near term; inflation is
likely to ease further. This month alone, G-Sec bond yield has declined by ~60bps
indicating expectation of aggressive rate cuts by RBI going ahead. Besides, due to
demonetization, banks have received huge amount of low cost funds, which should
also enable them to bring down the interest rates. With this kind of liquidity, bank
will be able to transmit a rate cut to the borrowers efficiently. This will also help to
revive consumption demand in the country.
Exhibit 1: G-sec bond yield has corrected sharply in November
7.8
7.5
7.3
7.0
6.8
6.5
6.3
6.0
Source: Angel Research
Organized players to benefit with acceleration in shift from unorganized to
organized segment: While demonetization is expected to impact all sectors with
varying degree, the unorganized players will be impacted the most. Unorganized
segment depends heavily on the cash transactions and together with
demonetization and forthcoming GST, they will suddenly have to become tax
compliant. This will lead to diminish their low price advantage making branded
products more attractive. This is directly going to benefit organized players in terms
of gains in the market share.
Improvement in transparency: Demonetization is also expected to derive some
intangible benefits in the economy by increasing transparency in transactions. This
will lead to improve our ranking in ease of doing business. With this, India will
continue to remain an attractive destination for foreign investors attracting foreign
investments in form of FDI and FII.
December 1, 2016
2
Top Picks Report | December 2016
Demonetization priced in, buy quality large caps
Overall we believe that that demonetization is a shot in the arm for the economy in
the long term as it improves our fundamentals. As liquidity eases, incrementally
pain will also wane out.
Consumption story is likely to pick up with easing rates while with higher
expenditure by government on infrastructure projects, capex cycle will see revival.
Lower interest rates would make sure that high debt quality companies derive the
benefit of lower rates and demonetization and GST will make sure that organized
players are benefitted the most. This in medium to long term looks good for the
stock markets which offer a good stock picking opportunity at the moment.
On this backdrop, we are adding L&T and Powergrid Corporation (government
spending and lower interest rates) and Lupin and Alkem (no impact of
demonetization). We also retain IT stocks given demonetization does not impact
their business and rupee depreciation is likely to be positive for exports. We also
expect pick up in the consumption in H2FY2018E and believe that correction in the
consumption stocks should be used to accumulate quality companies.
December 1, 2016
3
Top Picks Report | December 2016
Top Picks
December 1, 2016
4
Top Picks Report | December 2016
Stock Info
Dewan Housing
CMP
257
3rd largest private sector housing finance company: We expect DHFL’s AUM to
TP
350
grow at a CAGR of 21% over FY2016-18, as demand for housing in the middle
Upside
36.20%
and low income group picks up, while PAT CAGR is expected to be 23%.
Sector
Financials
Seasoned and granular loan book with stable asset quality: Individual
borrowers account for 72%, while the high yielding loan against property (LAP)
Market Cap (` cr)
8,029
+SME and projects loans account for 19% and 9% of advances respectively. Despite
Beta
1.6
strong loan growth, the GNPAs and NNPAs are likely to be at ~1.17% and 0.82%,
52 Week High / Low
337 / 141
respectively, for FY2017. We don’t expect any major deterioration in the asset
quality going ahead.
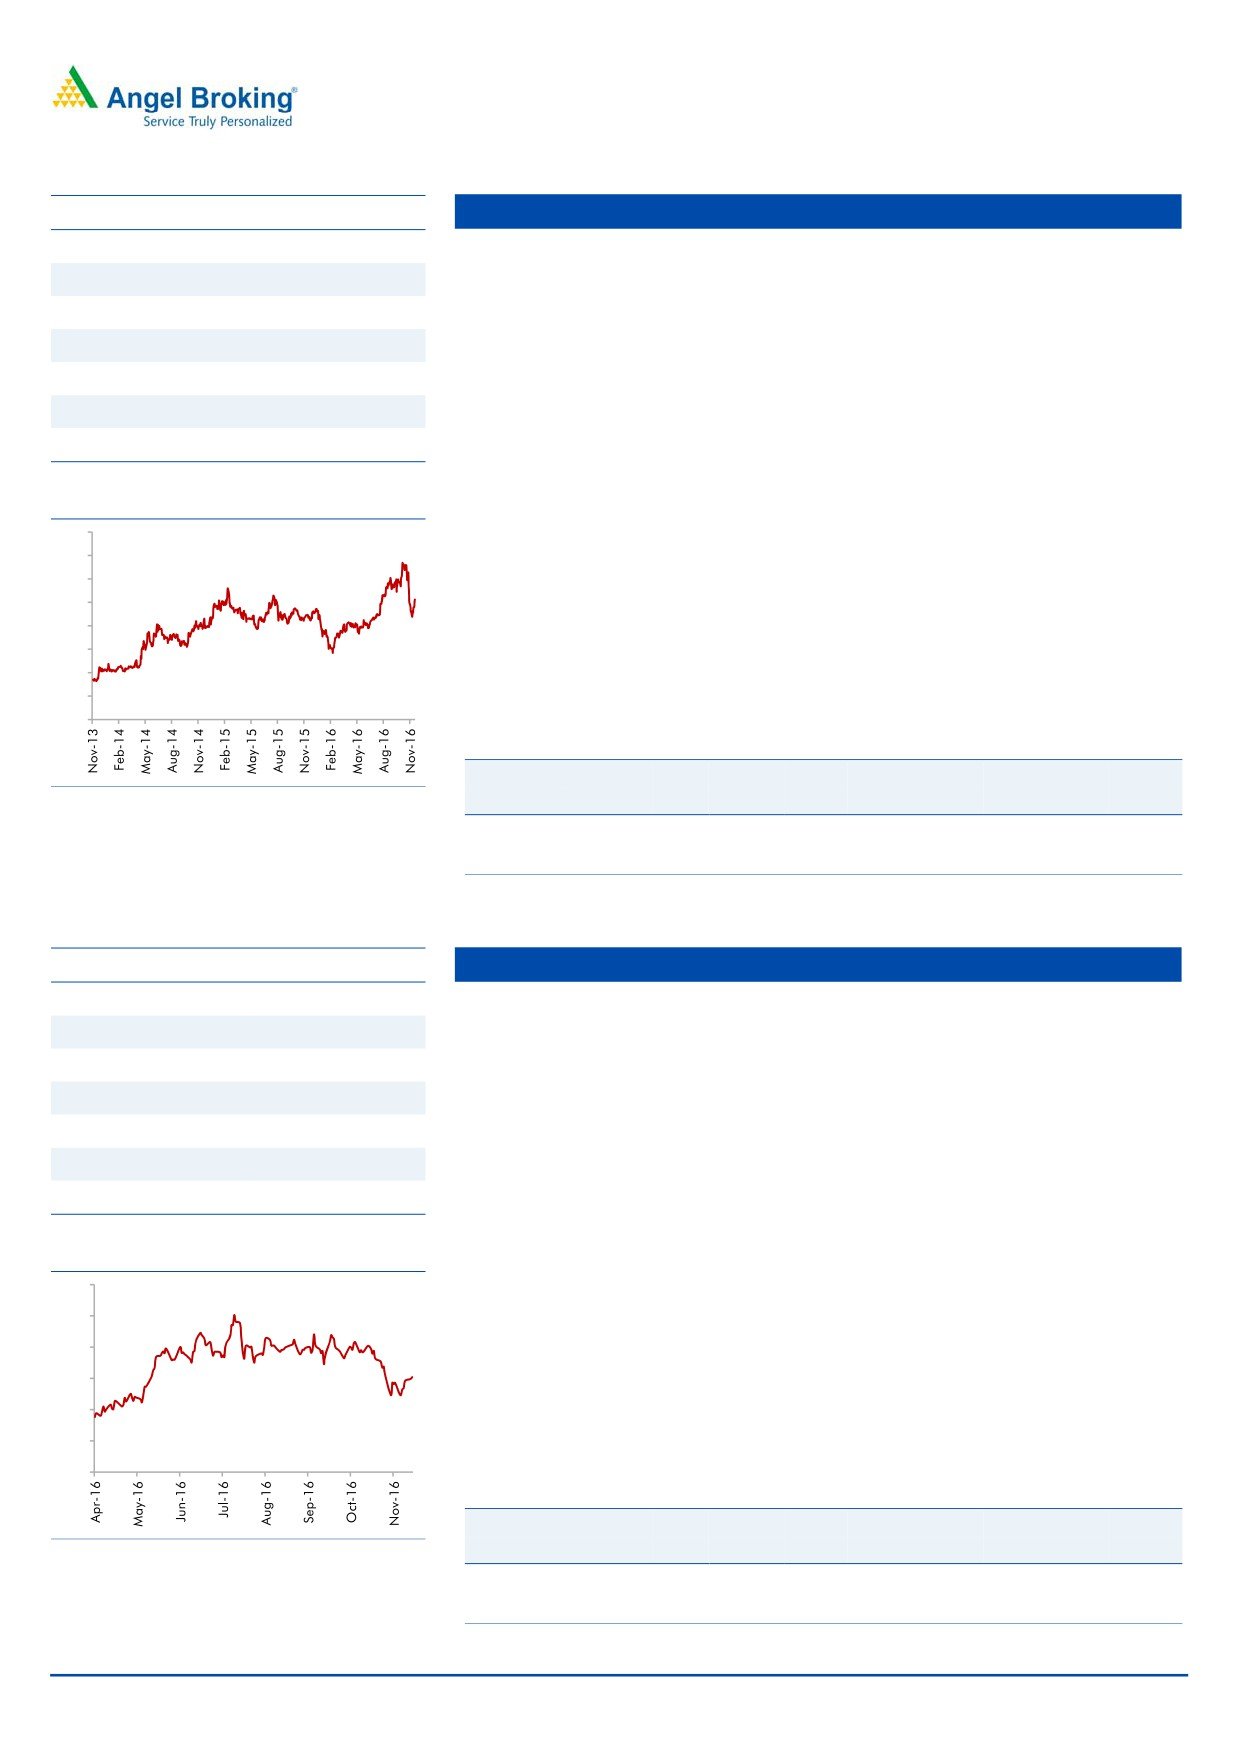
3 year-Chart
Lower cost of funds will help maintain NIM: Nearly
70% of the bank
400
borrowings are due for maturity over the next three years and recently DHFL
350
was able to raise large sum ~ Rs14, 000 cr via NCDs at a competitive rates
300
and this should help maintain its NIM at ~2.9%.
250
200
Outlook: We expect the company to post a healthy loan book CAGR of 21%
150
over FY2015-18E, which is likely to translate in earnings CAGR of 23%, over
100
the same period. The stock currently trades at 1.2x FY2018E ABV. We have a
50
Buy stand on the stock, with a target price of `350.
-
Key Financials
Y/E
Op. Inc NIM
PAT
EPS
ABV ROA ROE P/E P/ABV
Source: Company, Angel Research
March
(` cr)
(%)
(` cr)
(`)
(`)
(%)
(%)
(x)
(x)
FY2017E
2,225
2.9
879
29.7
187.8
1.2
16.1
8.7
1.4
FY2018E
2,688
2.9
1,111
34.6
216.4
1.2
16.8
7.4
1.2
Source: Company, Angel Research
Stock Info
Equitas Holdings
CMP
161
Early mover advantage in the SFB category: Equitas was one of the ten NBFCs
TP
235
to get the license to start a small finance bank (SFB). As the entire book of
Upside
46%
Equitas qualifies for PSL, meeting the 75% PSL target will not be a challenge.
Sizeable and diversified loan book will keep it ahead of other upcoming SFBs.
Sector
Financials
Asset quality and return ratios are likely to remain stable: Equitas will have to
Market Cap (` cr)
5,388
maintain CRR & SLR going ahead; hence yield on total assets is likely to come
Beta
0.9
down. However, as a bank it will be able to raise deposits and hence there will
52 Week High / Low
206 / 134
be reduction in cost of funds. As a result, spreads may not decline much which
in turn will help in maintaining the ROE & ROA which although could undergo
3 year-Chart
a marginal decline. Also we don’t expect any major deterioration in the asset
220
quality going ahead.
200
NIM likely to remain healthy: After conversion to SFB the company has started
180
raising deposits at a lower cost vs borrowings leading to better cost of funds.
160
Hence we expect the NIM to remain strong at ~10-11%, going ahead.
Outlook: We expect the company to post a strong loan book & earnings
140
CAGR of 38% & 37% over FY2016-18E. The stock currently trades at 2.1x
120
FY2018E ABV. We maintain Buy on the stock, with a target price of `235.
100
Key Financials
Y/E
Op. Inc NIM
PAT
EPS
ABV ROA ROE P/E P/ABV
March
(` cr)
(%)
(` cr)
(`)
(`)
(%)
(%)
(x)
(x)
Source: Company, Angel Research
FY2017E
9,39
11.7
224
5.8
68.2
2.8
10.9
27.8
2.4
FY2018E
1,281
11.5
315
8.2
77.6
2.8
11.5
19.6
2.1
Source: Company, Angel Research
December 1, 2016
5
Top Picks Report | December 2016
Stock Info
Amara Raja Batteries
CMP
940
Amara Raja Batteries Ltd (ARBL) is the second largest lead acid storage battery
TP
1,167
manufacturer in the country. It has been outpacing market leader Exide (ARBL
Upside
24.1%
grew at a 21% CAGR over FY2010-16 as compared to standalone Exide's
growth of 7%), leading to its market share improving from 25% in FY10 to
Sector
Auto Ancillary
about 35% currently. ARBL's outperformance has been mainly on back of its
Market Cap (` cr)
16,060
association with global battery leader Johnson Controls Inc (which also holds
Beta
0.8
26% stake in ARBL) for manufacturing ducts.
52 Week High / Low
1,077 / 773
With the automotive OEMs following a policy of having multiple vendors and
with ARBL’s products enjoying a strong brand recall in the replacement
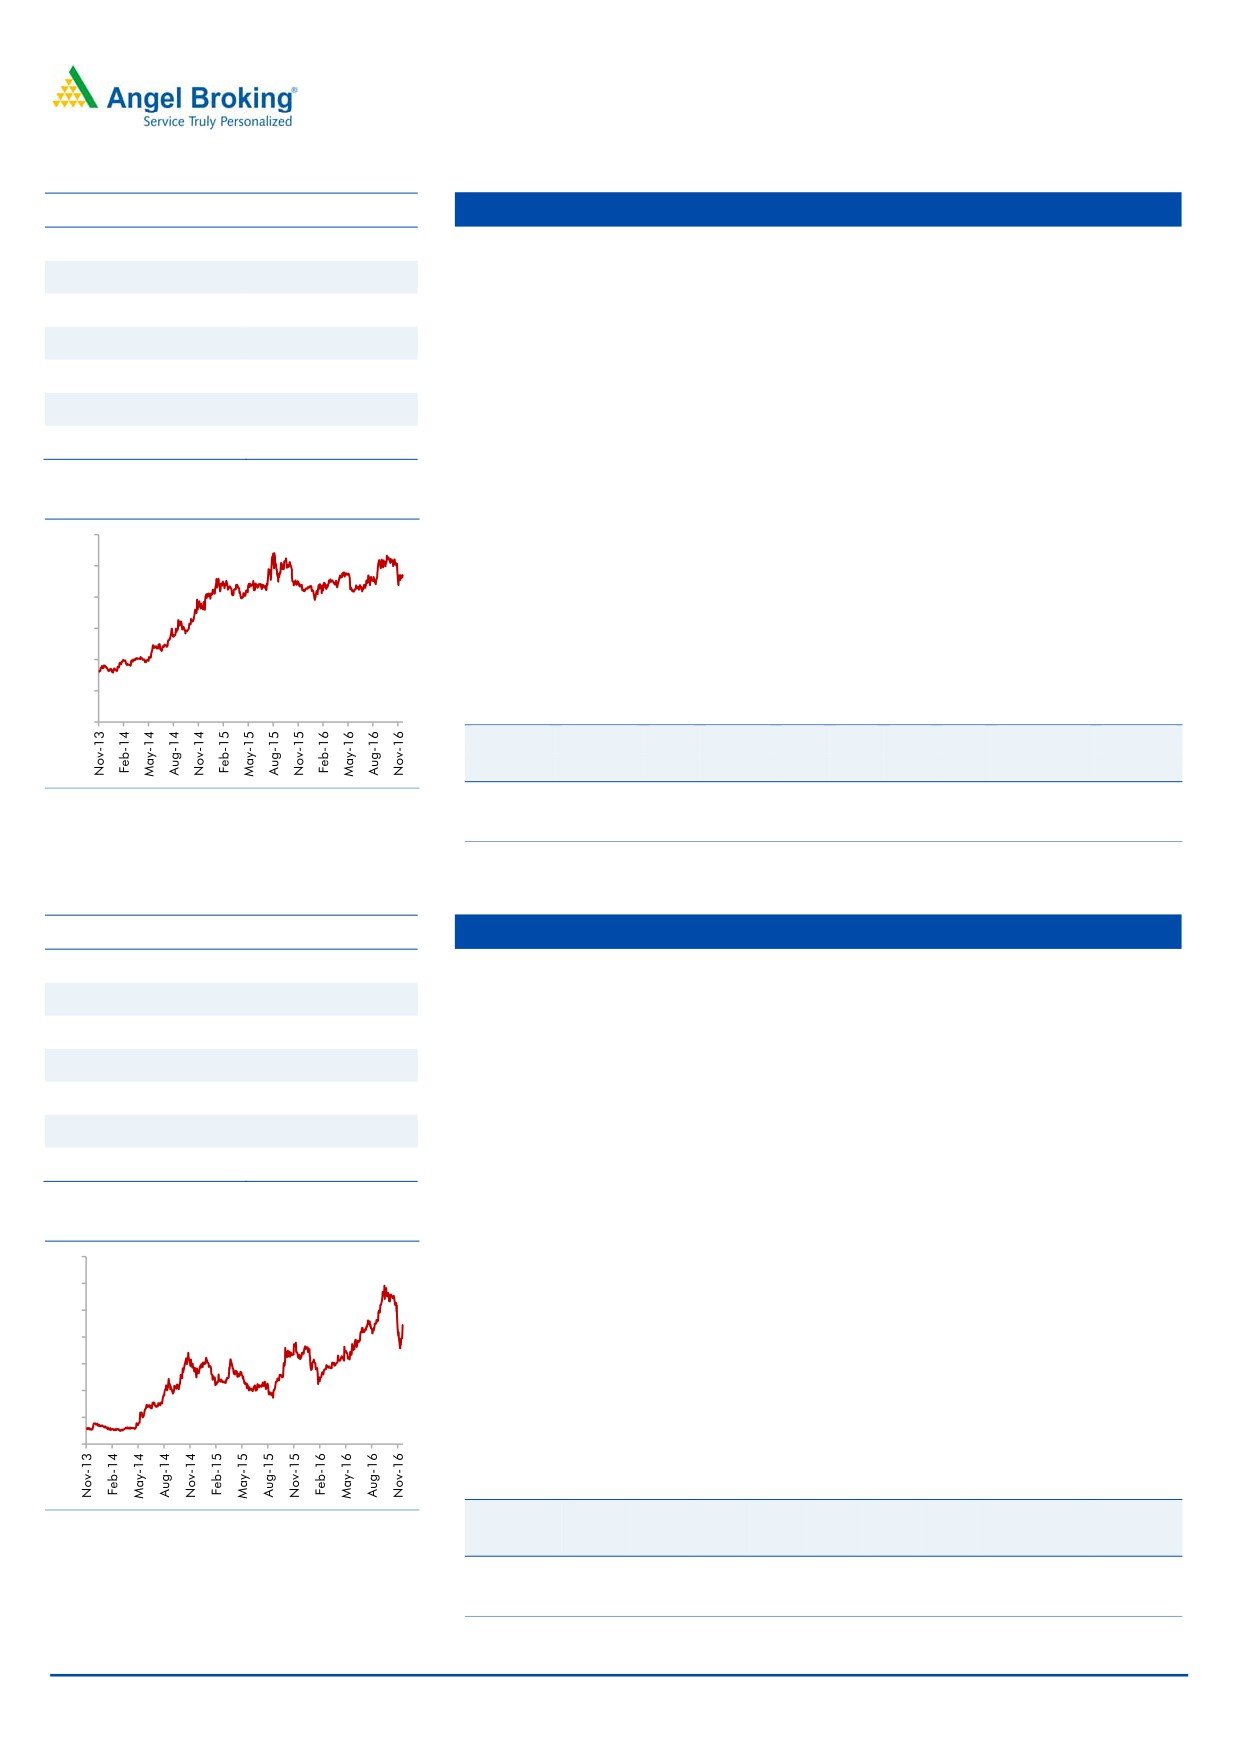
3 year-Chart
segment, the company is well poised to gain further market share. Given the
1,200
economic recovery and market share gains, the company is expected to grow at
a CAGR of 18% over the next two years as against industry growth of 10-12%.
1,000
800
ARBL is a well diversified auto ancillary player having presence across the
automotive and the industrial segment. It has a broad OEM as well as
600
replacement customer base. We believe ARBL is a high quality stock to play
400
the auto sector revival. We maintain our Buy rating on the stock.
200
Key Financials
-
Y/E
Sales
OPM PAT EPS ROE P/E P/BV EV/EBITDA EV/Sales
March
(` cr)
(%)
(` cr)
(`)
(%)
(x)
(x)
(x)
(x)
FY2017E
5,504
17.6
571
33.4
22.1
28.1
6.2
16.5
4.7
Source: Company, Angel Research
FY2018E
6,605
17.5
699
40.9
22.0
23.0
5.0
13.7
3.8
Source: Company, Angel Research
Stock Info
Asian Granito
CMP
222
AGIL’s current, vitrified sales (35%) are lower as compared to its peers like
TP
351
Somany Ceramics (47%) and Kajaria Ceramics (61%). Recently, AGIL has
Upside
58.1%
launched various products in premium segment. Going forward, we expect
AGIL’s profit margin to improve due to increase in focus for higher vitrified
Sector
Ceramics
product sales, which is a high margin business.
Market Cap (` cr)
668
AGIL is continuously putting efforts to increase the B2C sales from the current
Beta
1.4
level (35% in FY16). It is expected to reach up to 50% in next 2-3 years on the
52 Week High / Low
304 / 109
back of various initiatives taken by AGIL to increase direct interaction with customers
like strengthening distribution network, participation in key trade exhibition, etc.
3 year-Chart
In July FY2016, AGIL acquired Artistique Ceramic which has a better margin
350
profile. Going forward, we expect the company to improve its operating
300
margin from 7.5% in FY16 (excluding merger) to 12-12.5% in coming
250
financial year. Artisique Ceramics has a contract with RAS GAS to supply
200
quality natural gas at a discounted rate of 50% to current market rate, which
150
would reduce the overall power & fuel cost of the company.
100
We expect AGIL to report a net revenue CAGR of ~9% to ~`1,182cr and net
50
profit CAGR of ~39% to `48cr over FY2016-18E. We have a Buy rating on
-
the stock and target price of `351.
Key Financials
Y/E
Sales OPM PAT EPS ROE P/E P/BV EV/EBITDA EV/Sales
Source: Company, Angel Research
March
(` cr)
(%)
(` cr)
(`)
(%)
(x)
(x)
(x)
(x)
FY2017E
1,071
12.1
38
12.7
9.5
17.5
1.7
7.6
0.9
FY2018E
1,182
12.4
48
16.0
10.7
13.9
1.5
6.4
0.8
Source: Company, Angel Research
December 1, 2016
6
Top Picks Report | December 2016
Stock Info
Bajaj Electricals
CMP
223
The company is among the top 4 players in the consumer durables space
TP
274
across all its product categories (leader in small appliances; number-4 in fans
and lighting). It has a strong distribution reach with 4,000 distributors
Upside
22.9%
reaching out to 400,000 retailers.
Sector
Cons. Durable
In the 3 years preceding FY2016, the company’s E&P segment had been
Market Cap (` cr)
2,249
underperforming owing to cost overruns and delays in project executions.
Beta
0.9
However, the segment has turned around in FY2016 on the profitability front
52 Week High / Low
280 / 155
and delivered a healthy EBIT margin of ~6% for the year. Currently the
segment’s order book stands at `2,480cr.
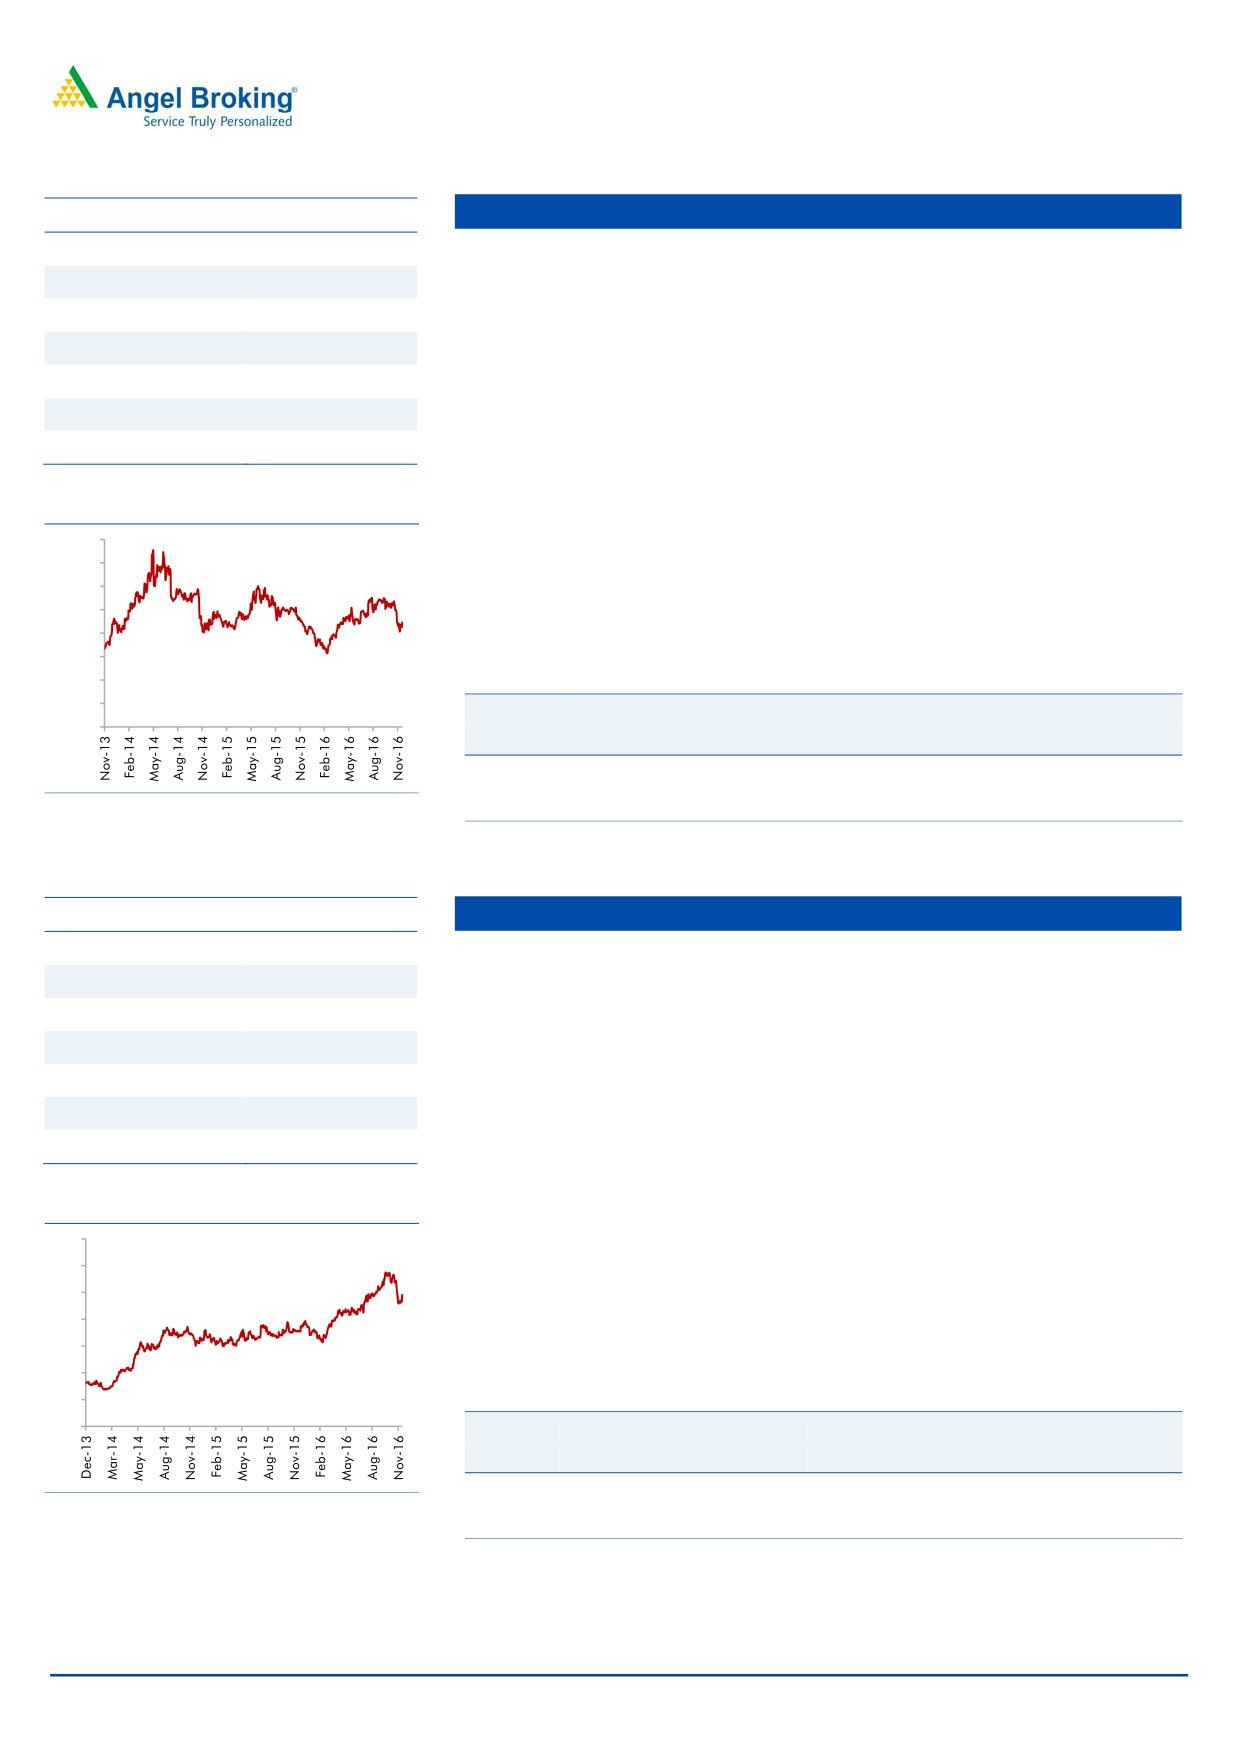
3 year-Chart
With expectation of timely execution of new projects in the E&P segment and
400
with the Lighting and Consumer Durables segments expected to benefit from
350
an improvement in consumer sentiments going forward, we expect the
300
company’s top-line to grow at a CAGR of ~8% to `5,351cr and bottom-line to
250
grow at a CAGR of 20% to `138cr over FY2016-FY2018E. We recommend a
200
Buy rating on the stock.
150
100
Key Financials
50
Y/E
Sales OPM PAT EPS ROE P/E P/BV EV/EBITDA EV/Sales
-
March
(` cr)
(%)
(` cr)
(`)
(%)
(x)
(x)
(x)
(x)
FY2017E
4,801
5.7
105
10.4
12.4
21.4
2.6
8.5
0.5
FY2018E
5,351
6.2
138
13.7
14.5
16.3
2.4
7.0
0.4
Source: Company, Angel Research
Source: Company, Angel Research
Stock Info
Blue Star
CMP
491
BSL is one of the largest air-conditioning companies in India. With a mere
TP
634
3% penetration level of ACs vs 25% in China, the overall outlook for the room
Upside
29.1%
air-conditioner (RAC) market in India is favourable.
Sector
Cons. Durable
BSL’s RAC business has been outgrowing the industry by ~10% points over the
Market Cap (` cr)
4,697
last few quarters, resulting in the company consistently increasing its market
share (~7% in FY2014 to 10.5% at present). This has resulted in the Cooling
Beta
0.6
Products Division (CPD)'s share in overall revenues increasing from~23% in
52 Week High / Low
581 / 306
FY2010 to ~42% in FY2016 (expected to improve to ~47% in FY2018E). With
strong brand equity and higher share in split ACs, we expect the CPD to
3 year-Chart
continue to drive growth.
700
Aided by increasing contribution from the CPD, we expect the overall top-line
600
to post a revenue CAGR of ~16% over FY2016-18E and margins to improve
500
from 5.3% in FY2015 to 7.3% in FY2018E. Moreover, the merger of Blue Star
400
Infotech has infused cash and strengthened the balance sheet. We have an
300
Accumulate recommendation on the stock.
200
100
Key Financials
-
Y/E
Sales OPM PAT EPS ROE P/E P/BV EV/EBITDA EV/Sales
March
(` cr)
(%)
(` cr)
(`)
(%)
(x)
(x)
(x)
(x)
FY2017E
4,283
5.9
141
14.9
20.4
33.0
6.4
18.1
1.1
Source: Company, Angel Research
FY2018E
5,077
7.3
211
22.1
26.4
22.2
5.4
12.6
1.0
Source: Company, Angel Research
December 1, 2016
7
Top Picks Report | December 2016
Stock Info
Mirza International
CMP
81
In the branded domestic segment, we expect the company to report a ~21%
TP
107
CAGR over FY2016-18E to `258cr. We anticipate strong growth for the
Upside
32.1%
company on the back of (a) the company’s wide distribution reach through its
1,000+ outlets including 120 exclusive brand outlets (EBOs) in 35+ cities and
Sector
Footwear
the same are expected to reach 200 over the next 2-3 years and (b) strong
Market Cap (` cr)
973
branding (Red Tape) in the shoes segment.
Beta
1.5
MIL’s major export revenue comes from the UK (73%), followed by the US
52 Week High / Low
143 /69
(14%) and the balance from ROW. Export constitutes ~75% of the company’s
total revenue. We expect the company to report healthy growth over the next
2-3 years on back of recovery in the UK market, strong growth in the US market
3 year-Chart
and with it tapping newer international geographies like the Middle East countries.
160
140
In FY2016, the company acquired Genesis Footwear which has a better
120
margin profile than it. The deal resulted in MIL’s EPS increasing by ~4% and
100
ROE improving from 15.9% to 17.5%. Further, due to this merger, the
80
company’s capacity has increased from 5.4mn to 6.4mn units.
60
We expect MIL to report a net revenue CAGR of ~9% to ~`1,106cr and net
40
profit CAGR of ~9% to `92cr over FY2016-18E. We have a Buy rating on the
20
-
stock and target price of `107.
Key Financials
Y/E
Sales OPM PAT EPS ROE P/E P/BV EV/EBITDA EV/Sales
Source: Company, Angel Research
March
(` cr)
(%)
(` cr)
(`)
(%)
(x)
(x)
(x)
(x)
FY2017E
987
18.0
79
6.5
15.9
12.4
2.0
6.6
1.2
FY2018E
1,106
18.0
92
7.6
15.7
10.6
1.7
5.9
1.1
Source: Company, Angel Research
Stock Info
Siyaram Silk Mills
CMP
1,250
SSML has strong brands which cater to premium as well as popular mass
TP
1,605
segments of the market. Further, SSML entered the ladies' salwar kameez and
Upside
28.4%
ethnic wear segment. Going forward, we believe that the company would be able to
Sector
Textile
leverage its brand equity and continue to post strong performance.
Market Cap (` cr)
1,172
The company has a nationwide network of about 1,600 dealers and business
partners. It has a retail network of 160 stores and plans to add another
Beta
0.8
300-350 stores going forward. Further, the company's brands are sold across
52 Week High / Low
1,690/925
3,00,000 multi brand outlets in the country.
Going forward, we expect SSML to report a net sales CAGR of ~10% to
3 year-Chart
~`1,948cr and adj.net profit CAGR of ~11% to `107cr over FY2016-18E on
1,800
back of market leadership in blended fabrics, strong brand building, wide
1,600
distribution channel, strong presence in tier II and tier III cities and emphasis
1,400
1,200
on latest designs and affordable pricing points. At the current market price,
1,000
SSML trades at an inexpensive valuation. We have a buy recommendation on
800
the stock and target price of `1,605.
600
400
Key Financials
200
-
Y/E
Sales
OPM PAT EPS ROE P/E P/BV EV/EBITDA EV/Sales
March
(` cr)
(%)
(` cr)
(`)
(%)
(x)
(x)
(x)
(x)
FY2017E
1,733
11.6
91
96.6
15.3
12.9
2.0
7.5
0.9
Source: Company, Angel Research
FY2018E
1,948
11.7
107
114.7
15.7
10.9
1.7
7.6
0.8
Source: Company, Angel Research
December 1, 2016
8
Top Picks Report | December 2016
Stock Info
HCL Technologies
CMP
803
Healthy pipeline: Company’s engineering services has been seeing lumpy
TP
1,000
growth over the last few quarters. This is however largely a function of the
Upside
24.5%
timing of large transformational deals. 6-8 of the large deals signed a few
Sector
IT
quarters ago will aid the company to continue to post industry leading growth.
Market Cap (` cr)
1,13,255
We expect HCL Tech to post a USD and INR revenue CAGR of 16.3% and
Beta
0.6
18.0%, respectively, over FY2016-18E (inclusive of the acquisition of
52 Week High / Low
890 / 707
Geometric Software and the Volvo deal).
Robust outlook: For FY2017 revenues are expected to grow between 12.0-
3 year-Chart
14.0% in CC. Revenue guidance is based on FY2016 (April to March’2016)
1,200
average exchange rates. The above constant currency guidance translates to
1,000
11.2% to 13.2% growth in US$ terms.
800
Outlook and Valuations: The stock is attractively valued at the current market
600
price and hence we maintain our Buy with a price target of `1,000.
400
Key Financials
200
Y/E
Sales
OPM PAT EPS ROE P/E P/BV EV/EBITDA EV/Sales
-
June
(`cr)
(%)
(`cr)
(`)
(%)
(x)
(x)
(x)
(x)
FY2017E
49,242
20.5
7,862
55.7
20.3
14.9
3.0
9.2
1.9
Source: Company, Angel Research
FY2018E
57,168
20.5
9,037
64.1
17.9
13.0
2.3
7.0
1.4
Source: Company, Angel Research
Stock Info
Infosys
CMP
975
Revenue guidance for FY17: The Management has lowered its guidance for
TP
1,249
FY2017, to 8-9% in CC terms and 9.2-10.2% in INR terms (exchange rate as
Upside
28.1%
on March 31, 2016). For FY2016, the company posted a 13.3% growth in CC
Sector
IT
terms V/s a guidance of 12.8-13.2% growth (in CC). We expect the company
Market Cap (` cr)
2,24,056
to post ~9.0% USD revenue growth in FY2017.
Beta
0.8
Aims to be US$20bn company by FY20: Company expects its revenue to rise
52 Week High / Low
1,278 / 900
to US$20bn by FY2020, up from US$8.7bn in FY2015, as it focuses on
acquisitions and winning more new technology services, implying a
3 year-Chart
14% CAGR over the period. Over the near term, we expect Infosys to post a
1,400
9.0% USD revenue growth in FY2017. Over FY2016-18E, we expect
1,200
USD and INR revenue to grow at a CAGR of 9.0% and 9.5%, respectively.
1,000
Outlook and Valuations: The stock trades at a valuation of 14.1x FY2018E
800
earnings. We recommend Buy on the stock with a price target of `1,249.
600
400
Key Financials
200
Y/E
Sales
OPM PAT EPS ROE P/E P/BV EV/EBITDA EV/Sales
-
March
(` cr)
(%)
(` cr)
(`)
(%)
(x)
(x)
(x)
(x)
FY2017E
68,350
27.0
14,354
62.5
21.3
15.7
3.3
10.8
2.9
FY2018E
77,236
27.0
15,928
69.4
21.6
14.1
3.1
9.4
2.5
Source: Company, Angel Research
Source: Company, Angel Research
December 1, 2016
9
Top Picks Report | December 2016
Stock Info
Jagran Prakashan
CMP
176
We expect JPL to register a net sales CAGR of ~12% over FY2016-18E, on
TP
225
back of (a) strong growth in advertising revenue due to improvement in GDP
Upside
27.8%
growth, and (b) improvement in circulation revenue owing to combination of
Sector
Media
increase in cover price and volume growth.
Market Cap (` cr)
5,744
Further the acquisition of Radio City would also boost the company's revenue
going ahead. Radio City has ~20 stations across 7 states in the country and is
Beta
0.6
second only to ENIL in all its operating circles, ie Delhi, Mumbai, Bengaluru,
52 Week High / Low
213/144
Chennai, Ahmedabad, Hyderabad, Pune and Lucknow. The company covers
~51% (~66mn people) of the total radio population.
3 year-Chart
Raw material prices have been in a declining trend. Thus, considering lower
250
news print costs, healthy sales, and higher margins in the radio business, we
200
expect an adj. net profit CAGR of ~12% over FY2016-18E to `409cr.
150
Considering Dainik Jagran's strong presence in the rapidly growing Hindi
markets, we expect JPL to benefit from an eventual recovery in the Indian
100
economy. Hence, we maintain a Buy rating on the stock with a target price of
50
`225.
-
Key Financials
Y/E
Sales
OPM PAT EPS ROE P/E P/BV EV/EBITDA EV/Sales
March
(` cr)
(%)
(` cr)
(`)
(%)
(x)
(x)
(x)
(x)
Source: Company, Angel Research
FY2017E
2,355
28.0
353
10.8
21.7
16.3
3.5
8.7
2.5
FY2018E
2,635
28.0
409
12.5
21.7
14.1
3.1
7.6
2.2
Source: Company, Angel Research
Stock Info
TV Today Network
CMP
315
TTNL enjoys a strong viewership ranking in the Hindi and English news
TP
385
channel categories. The company’s Hindi news channel - Aaj Tak has
Upside
22.2%
maintained its market leadership position occupying the No.1 rank for several
Sector
Media
consecutive years in terms of viewership. Its English news channel - India
Today too has been continuously gaining viewership; it has now captured the
Market Cap (` cr)
1,882
No. 2 ranking from No. 4 earlier. Its other channels like Dilli Aaj Tak and Tez
Beta
1.3
are also popular among viewers.
52 Week High / Low
360 /260
Out of the 7 radio stations, TTNL has sold off 4 (Jodhpur, Amritsar, Patiala
and Shimla) for `4cr. The remaining 3 stations are in the process of getting
3 year-Chart
sold off to ENIL but the sale will have to wait until concerns raised by the MIB
400
are resolved. Going forward, we expect them to be sold off and this would
350
prop up the company’s profitability.
300
250
We expect TTNL to report a net revenue CAGR of ~16% to ~`743cr and net
200
profit CAGR of ~16% to `128cr over FY2016-18E. We have an Accumulate
150
recommendation on the stock and target price of `385
100
50
Key Financials
-
Y/E
Sales
OPM PAT EPS ROE P/E P/BV EV/EBITDA EV/Sales
March
(` cr)
(%)
(` cr)
(`)
(%)
(x)
(x)
(x)
(x)
FY2017E
637
27.5
110
18.4
17.4
17.2
3.0
9.3
2.6
Source: Company, Angel Research
FY2018E
743
27.5
128
21.4
17.2
14.8
2.5
7.6
2.1
Source: Company, Angel Research
December 1, 2016
10
Top Picks Report | December 2016
Stock Info
Larsen & Toubro
CMP
1,383
L&T’s, order backlog remains robust at `2.5trn (2.5x of FY16 revenues) of
TP
1,634
which 29.0% is international order backlog. It’s consolidated order inflow
Upside
18.1%
increased by 8.7% yoy to `311bn due to higher domestic order inflows in
2QFY17. Domestic and international orders accounted for 76.3% and 23.7%
Sector
Infrastructure
respectively in the inflows. Order growth was mainly from domestic
Market Cap (` cr)
1,28,855
infrastructure and international hydrocarbon segment.
Beta
1.4
L&T has maintained its guidance of (a) 15% growth in consolidated order
52 Week High / Low
1,615 / 1,017
inflows; (b) a 12-15% rise in consolidated revenues; and (c) up to a 50bps
improvement in EBITDA margins in core engineering. However, management
3 year-Chart
acknowledged is uncertain of the impact of currency de-monetization at
2,000
present. L&T’s order book has ~6% exposure to the high-end realty space.
1,800
1,600
Going forward we expect the company to report healthy top-line and bottom-
1,400
line growth on the back of execution of domestic orders. L&T’s order prospects
1,200
1,000
continue to remain strong. We are of the view that L&T is a proxy play for
800
investors wanting to ride on Indian infrastructure growth story. We recommend
600
400
a Buy on the stock with Target Price of `1,634.
200
Key Financials
-
Y/E
Sales
OPM PAT EPS ROE P/E P/BV EV/EBITDA EV/Sales
March
(` cr)
(%)
(` cr)
(`)
(%)
(x)
(x)
(x)
(x)
FY2017E
1,11,017
11.0
5,691
61.1
13.1
22.6
2.7
7.2
2.2
Source: Company, Angel Research
FY2018E
1,24,908
11.0
6,216
66.7
13.0
20.7
2.5
6.6
2.0
Source: Company, Angel Research
Stock Info
Mahindra Lifespace
CMP
377
MLF has 13 projects under implementation across cities. MLF has exhibited
TP
522
fast completion of projects compared to others. Sales cycle in ~65% of
Upside
28.5%
projects is faster than execution cycle, contrary to industry trends. This fast
execution and sales is optimal, as it helps MLF in revenue recognition,
Sector
Real Estate
inventory cycle (better than Oberoi, DLF), cash flows and profitability. This
Market Cap (` cr)
1,547
translates in creating a virtuous cycle of continuous fast growth.
Beta
0.4
MLF as of 4QFY2016 is pursuing ~4.0mn sq. ft. of sale of the total ~15.0mn
52 Week High / Low
500 / 343
sq. ft. of saleable area. Having sold ~60% of ongoing projects, we expect MLF
to launch ~2.8mn sq.ft. of saleable area in rational way during 4QFY2016-
3 year-Chart
2QFY2018E, across 6 cities. Maturity at existing projects, new launches give better
700
revenue visibility for medium-term. Further, MLF is sitting on land bank of 11.0mn
600
sq.ft across 4 cities, which allays any concern over long-term revenue growth.
500
With Real Estate Regulatory Bill closer to reality, MLF should be minimally
400
impacted, given their strong parentage and ethically implemented processes.
300
In the longer-term organized, professionally run, well funded players would
200
enjoy strong trust due to their reliable and fast execution strategies. With
100
improvement in company’s fundamentals, strong earnings growth visibility
-
and long-term growth outlook, at current valuations of 1.1x FY2017E P/BV,
MLF looks attractive. We maintain BUY on MLF with target price of `522.
Key Financials
Source: Company, Angel Research
Y/E
Sales
OPM PAT EPS ROE P/E P/BV EV/EBITDA EV/Sales
March
(` cr)
(%)
(` cr)
(`)
(%)
(x)
(x)
(x)
(x)
FY2017E
1,152
22.7
75
29.9
7.6
12.6
0.9
14.7
2.1
FY2018E
1,300
24.6
138
35.8
8.6
10.5
0.9
9.1
1.7
Source: Company, Angel Research
December 1, 2016
11
Top Picks Report | December 2016
Stock Info
Navkar
CMP
175
NCL is one of the largest and one of the three CFS at JNPT with rail
TP
265
connectivity, helping it garner high market share at the port. NCL is in a massive
Upside
51.4%
expansion mode where it is increasing its capacity by 234% to 1,036,889 TEUs
Sector
Logistics
at JNPT and coming up with an ICD at Vapi (with Logistics Park).
Market Cap (` cr)
2,893
The ICD with rail link should benefit from first mover advantage in a region
Beta
0.6
that has huge market potential and accounts for ~27% of volumes at JNPT.
52 Week High / Low
224 / 151
The ICD should be able to capture the EXIM volumes from the region through
rail link that till now was being custom cleared at JNPT (Import) or being
3 year-Chart
transported via road and consolidated at JNPT (Export). South Gujarat
250
volumes will now head straight to the Vapi ICD; thus the company can now
200
cater to bulk commodities and domestic traffic that it had been rejecting owing
to capacity constraints at CFS.
150
We expect NCL to successfully use its rail advantage and scale up its
100
utilizations at both JNPT and Vapi ICD. We have a Buy rating on the stock.
50
Key Financials
-
Y/E
Sales
OPM PAT EPS ROE P/E P/BV EV/EBITDA EV/Sales
March
(` cr)
(%)
(` cr)
(`)
(%)
(x)
(x)
(x)
(x)
FY2017E
369
42.9
103
7.2
7.3
24.2
1.8
17.9
8.0
Source: Company, Angel Research
FY2018E
561
42.3
164
11.5
10.5
15.2
1.6
11.9
5.3
Source: Company, Angel Research
Stock Info
Power Grid Corporation
CMP
192
During the 1HFY2017, the company has already capitalized assets worth
TP
223
`120bn and is on track to achieve the capitalization guidance of `280bn-
Upside
16.2%
300bn for the full year. During the year, PGCIL has already commissioned
Sector
Power
pole-2 of the Assam-Agra HVDC line and is likely to commission its poles - 3
& 4, in addition to the `65bn Champa - Kurukshetra HVDC project, `19bn
Market Cap (` cr)
1,00,447
Srikakulam - Angul line and `36bn Wardha - Nizamabad line. Based on
Beta
0.71
status of pipeline of projects, we expect commissioning to be strong in rest of
52 Week High / Low
194 / 127
the year.
During the 1HFY2017, the total order awarded was `181bn. Total order size
3 year-Chart
to be awarded over next 18 months is ~ `330bn which indicates its healthy
250
prospects.
200
Going forward, we expect the company to report strong top-line CAGR of
150
~16% and bottom-line CAGR of ~19% on back of strong capitalization
guidance. We recommend a Buy on the stock with Target Price of `223.
100
50
Key Financials
Y/E
Sales
OPM PAT EPS ROE P/E P/BV EV/EBITDA EV/Sales
-
March
(` cr)
(%)
(` cr)
(`)
(%)
(x)
(x)
(x)
(x)
FY2017E
25,315
88.2
7,405
14.2
15.2
13.6
2.1
9.8
8.6
Source: Company, Angel Research
FY2018E
29,193
88.7
8,979
17.2
16.1
11.2
1.8
8.7
7.7
Source: Company, Angel Research
December 1, 2016
12
Top Picks Report | December 2016
Stock Info
Alkem Leboratories
CMP
1,700
Alkem is 5th largest pharma company is the domestic market. It has presence
TP
1,989
in India, US and a few other countries. The 73% of its revenues come from the
Upside
17.0%
Indian markets while 20% come from the US and rest from the other countries.
The company has leadership position in the anti infective segment in India and
Sector
Pharma
it is ranked as no. 3 in Gastro-Intestinal and Pain/Analgesics segments.
Market Cap (` cr)
20,314
Overall it holds 3.6% market share in the domestic formulations business and
Beta
0.25
7.9% share in in overall prescriptions in country.
52 Week High / Low
1,853/ 1,175
In the domestic market, company operates in acute and chronic segments. It is
a prominent player in acute segment but still an entrant in chronic segment. It
3 year-Chart
has aggressively hired sales force in last three years to increase its sales from
2,000
chronic segment. Alkem has a strong track record of growth in the domestic
1,500
market which is likely to continue. In the US, company is focusing on
monetization of its ANDA pipeline. As of September 2016, company has a
1,000
pipeline of 76 ANDAs of which 34 are approved. Company expects to launch
~7-8 ANDAs each year and expects to improve the filing rate as well. Overall
500
US revenues are expected to grow at ~25% growth rate.
-
Overall outlook remains strong with 17.6% CAGR in the topline and 22.3%
CAGR in the bottom-line. We have a Buy rating on the stock.
Key Financials
Source: Company, Angel Research
Y/E
Sales
OPM PAT EPS ROE P/E P/BV EV/EBITDA EV/Sales
March
(` cr)
(%)
(` cr)
(`)
(%)
(x)
(x)
(x)
(x)
FY2017E
6,043
18.7
962
80.5
22.3
21.1
4.7
17.6
3.3
FY2018E
6,893
19.3
1,062
88.8
20.3
19.1
3.9
14.8
2.8
Source: Company, Angel Research
Stock Info
Lupin
CMP
1,503
Lupin is the fastest growing company among the top 5 companies in domestic
TP
1,809
formulation space, registering a CAGR of 20.0% vs. market growth of ~13-
Upside
20.3%
14%. Six of Lupin's products are among the top 300 brands in the country.
Sector
Pharma
In US market, Lupin is currently the 5th largest generic player with 5.3% market
Market Cap (` cr)
67,770
share in prescriptions. Lupin has total 338 ANDA filings, of which 196 have
Beta
0.77
been approved, with 45 FTFs valued at more than US$13bn. Lupin plans to
launch 25-30 products in the US in FY2017. We expect a CAGR of 22.9% in
52 Week High / Low
1,912 / 1,294
US market during FY2016-18E on back of new product launches.
3 year-Chart
Lupin figures among the few Indian companies with a formidable presence in
2,500
Japan, the world’s second largest pharma market. Management believes that
there will be patent expiries of ~US$14-16bn in next two years in the
2,000
Japanese market, which along with increased generic penetration would drive
1,500
growth in the market. The Management expects improvement in growth in the
1,000
next 3-4 years. We recommend to buy this stock with price target of `1,809.
500
Key Financials
Y/E
Sales
OPM PAT EPS ROE P/E P/BV EV/EBITDA EV/Sales
-
March
(` cr)
(%)
(` cr)
(`)
(%)
(x)
(x)
(x)
(x)
FY2017E
15,912
26.4
2,611
58.1
21.4
25.9
5.0
16.4
4.3
Source: Company, Angel Research
FY2018E
18,644
26.7
3,117
69.3
20.9
21.7
4.1
13.3
3.6
Source: Company, Angel Research
December 1, 2016
13
Top Picks Report | December 2016
Macro watch
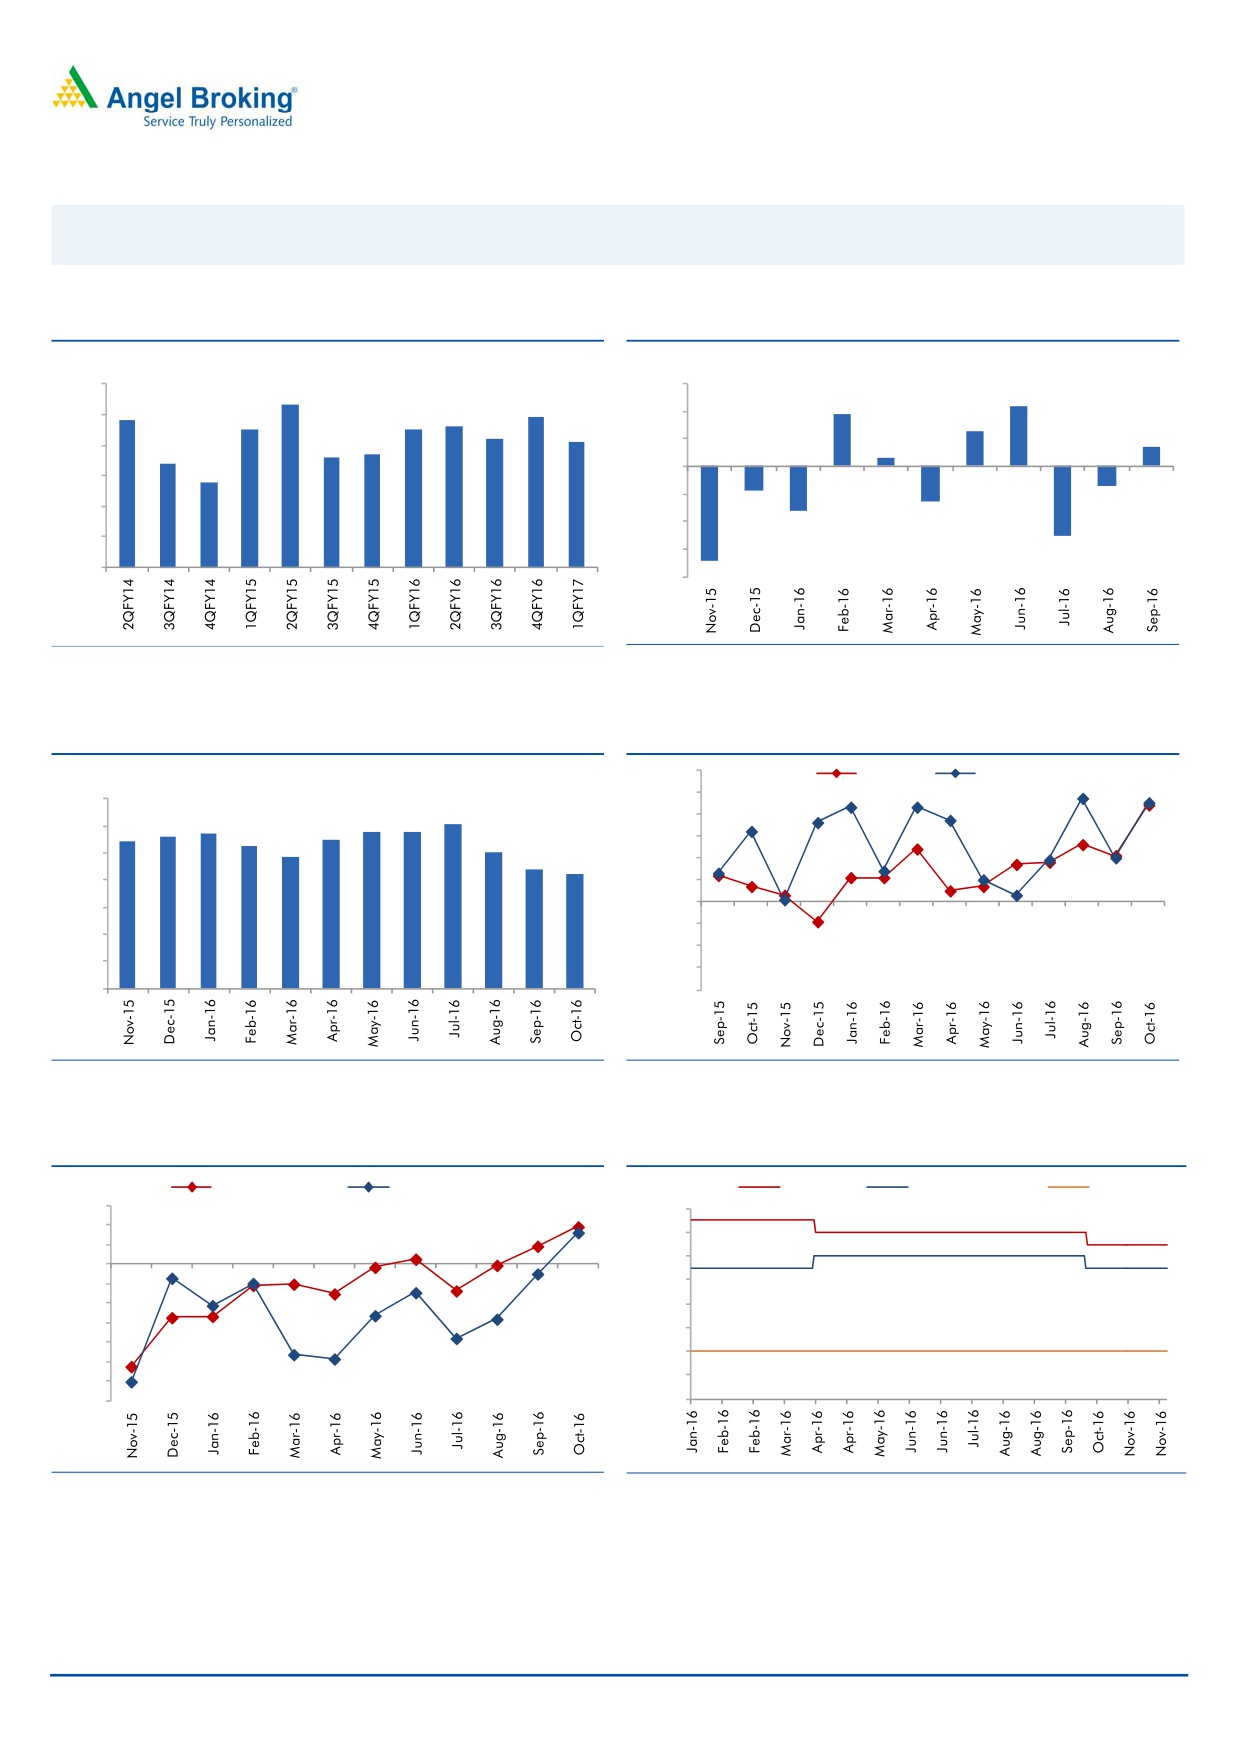
Exhibit 2: Quarterly GDP trends
Exhibit 3: IIP trends
(%)
(%)
9.0
8.3
3.0
2.2
7.9
1.9
7.8
8.0
7.5
7.5
7.6
2.0
1.3
7.2
7.1
0.7
6.6
6.7
1.0
0.3
7.0
6.4
5.8
-
6.0
(1.0)
5.0
(0.7)
(0.9)
(2.0)
(1.3)
(1.6)
4.0
(3.0)
(2.5)
3.0
(4.0)
(3.4)
Source: CSO, Angel Research
Source: MOSPI, Angel Research
Exhibit 4: Monthly CPI inflation trends
Exhibit 5: Manufacturing and services PMI
56.0
Mfg. PMI
Services PMI
(%)
55.0
7.0
6.1
5.6
5.7
5.8
5.8
54.0
5.4
5.5
6.0
5.3
4.8
5.1
53.0
5.0
4.4
4.2
52.0
4.0
51.0
50.0
3.0
49.0
2.0
48.0
1.0
47.0
-
46.0
Source: MOSPI, Angel Research
Source: Market, Angel Research; Note: Level above 50 indicates expansion
Exhibit 6: Exports and imports growth trends
Exhibit 7: Key policy rates
(%)
Exports yoy growth
Imports yoy growth
(%)
Repo rate
Reverse Repo rate
CRR
15.0
7.00
10.0
6.50
5.0
6.00
0.0
(5.0)
5.50
(10.0)
5.00
(15.0)
4.50
(20.0)
4.00
(25.0)
3.50
(30.0)
(35.0)
3.00
Source: Bloomberg, Angel Research
Source: RBI, Angel Research
December 1, 2016
14
Top Picks Report | December 2016
Global watch
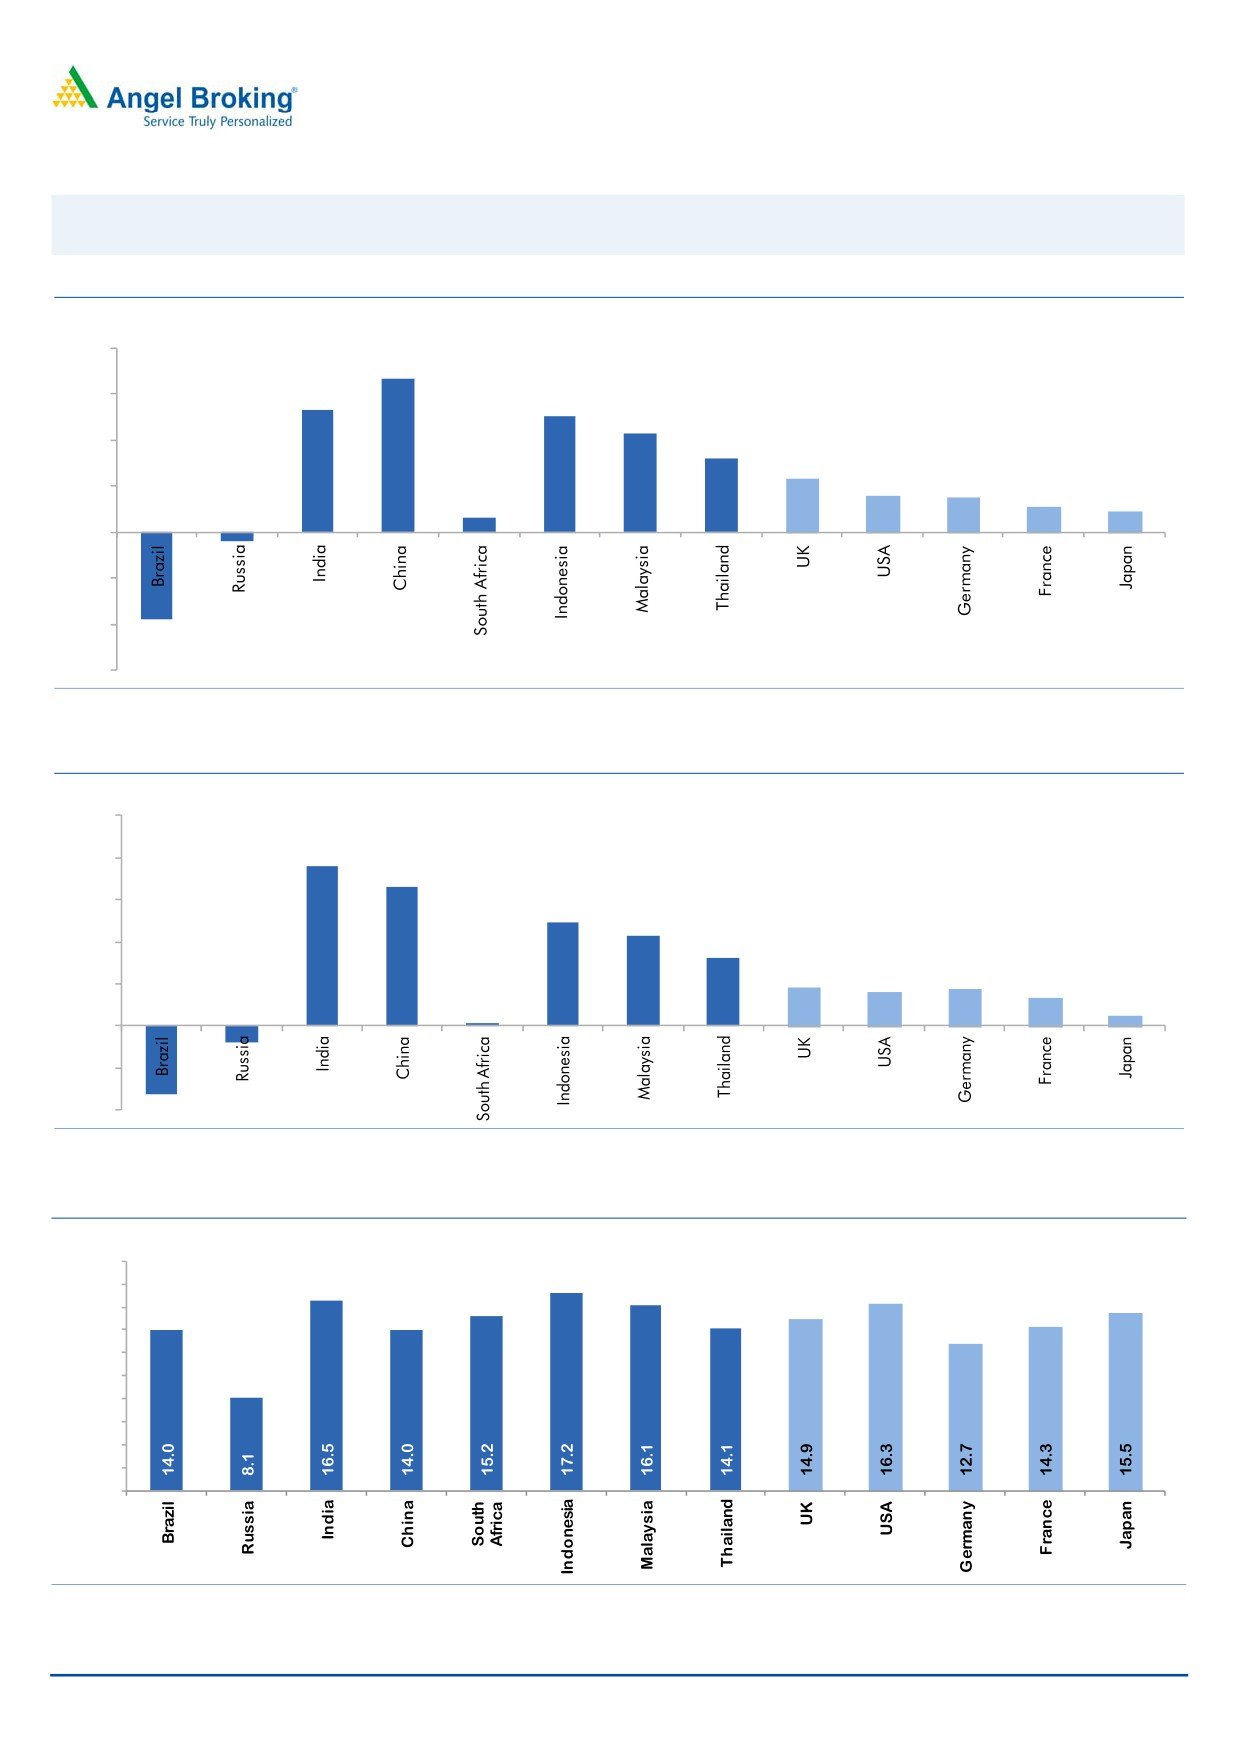
Exhibit 8: Latest quarterly GDP Growth (%, yoy) across select developing and developed countries
(%)
8.0
6.7
6.0
5.3
0.6
5.0
4.3
4.0
3.2
2.3
1.6
1.5
2.0
1.1
0.9
-
(2.0)
(0.4)
(4.0)
(3.8)
(6.0)
Source: Bloomberg, Angel Research
Exhibit 9: 2016 GDP Growth projection by IMF (%, yoy) across select developing and developed countries
(%)
10.0
7.6
8.0
6.6
6.0
4.9
4.3
4.0
3.2
1.8
1.6
1.7
2.0
1.3
(0.8)
0.5
(3.3)
0.1
-
(2.0)
(4.0)
Source: IMF, Angel Research
Exhibit 10: One year forward P-E ratio across select developing and developed countries
(x)
20.0
18.0
16.0
14.0
12.0
10.0
8.0
6.0
4.0
2.0
-
Source: IMF, Angel Research
December 1, 2016
15
Top Picks Report | December 2016
Exhibit 11: Relative performance of indices across globe
Returns (%)
Country
Name of index
Closing price
1M
3M
1YR
Brazil
Bovespa
61,906
(3.6)
7.3
32.1
Russia
Micex
2,105
6.2
6.8
18.9
India
Nifty
8,225
(4.8)
(4.3)
4.8
China
Shanghai Composite
3,250
4.7
5.9
(9.5)
South Africa
Top 40
43,691
(0.7)
(5.4)
(5.7)
Mexico
Mexbol
45,316
(5.8)
(4.8)
4.4
Indonesia
LQ45
857
(6.1)
(5.1)
11.4
Malaysia
KLCI
1,619
(3.2)
(3.8)
(3.5)
Thailand
SET 50
943
0.7
(4.1)
6.1
USA
Dow Jones
19,124
5.3
3.6
7.9
UK
FTSE
6,784
(2.5)
0.6
8.1
Japan
Nikkei
18,308
5.6
10.6
(7.8)
Germany
DAX
10,640
(0.2)
0.4
(1.4)
France
CAC
4,578
1.5
3.1
(1.3)
Source: Bloomberg, Angel Research
December 1, 2016
16
Top Picks Report | December 2016
Stock Watch
December 1, 2016
17
Stock Watch | December 2016
Company Name
Reco
CMP
Target
Mkt Cap
Sales (` cr)
OPM (%)
EPS (`)
PER (x)
P/BV (x)
RoE (%)
EV/Sales (x)
(`)
Price (`)
(` cr)
FY17E
FY18E
FY17E
FY18E
FY17E
FY18E
FY17E
FY18E
FY17E
FY18E
FY17E
FY18E
FY17E
FY18E
Agri / Agri Chemical
Rallis
Neutral
204
-
3,967
1,937
2,164
13.3
14.3
9.0
11.0
22.7
18.5
3.9
3.4
18.4
19.8
2.1
1.8
United Phosphorus
Accumulate
633
684
32,111
15,176
17,604
18.5
18.5
37.4
44.6
16.9
14.2
3.3
2.7
21.4
21.2
2.2
1.9
Auto & Auto Ancillary
Amara Raja Batteries
Buy
940
1,167
16,060
5,504
6,605
17.6
17.5
33.4
40.9
28.1
23.0
6.2
5.0
22.1
22.0
2.9
2.4
Apollo Tyres
Buy
191
235
9,725
12,877
14,504
14.3
13.9
21.4
23.0
8.9
8.3
1.4
1.2
16.4
15.2
0.9
0.9
Ashok Leyland
Buy
80
111
22,639
22,407
26,022
10.6
10.6
5.2
6.4
15.2
12.4
3.4
2.9
23.6
24.7
1.1
0.9
Bajaj Auto
Neutral
2,684
-
77,659
25,093
27,891
19.5
19.2
143.9
162.5
18.6
16.5
5.2
4.5
30.3
29.3
2.8
2.5
Bharat Forge
Neutral
905
-
21,059
7,726
8,713
20.5
21.2
35.3
42.7
25.6
21.2
4.7
4.3
18.9
20.1
2.8
2.4
Ceat
Accumulate
1,280
1,450
5,176
7,524
8,624
13.0
12.7
131.1
144.3
9.8
8.9
1.8
1.5
19.8
18.6
0.8
0.7
Eicher Motors
Neutral
21,620
-
58,722
16,583
20,447
17.5
18.0
598.0
745.2
36.2
29.0
12.4
9.4
41.2
38.3
3.4
2.7
Exide Industries
Neutral
181
-
15,389
7,439
8,307
15.0
15.0
8.1
9.3
22.4
19.5
3.1
2.8
14.3
16.7
1.7
1.5
Gabriel India
Buy
110
130
1,579
1,544
1,715
9.0
9.3
5.4
6.3
20.4
17.4
3.8
3.4
18.9
19.5
1.0
0.9
Hero Motocorp
Accumulate
3,169
3,541
63,281
30,958
34,139
15.7
15.7
193.6
208.3
16.4
15.2
6.4
5.3
34.2
30.5
1.9
1.7
Indag Rubber
Neutral
186
-
487
286
326
19.8
16.8
11.7
13.3
15.9
13.9
2.7
2.5
17.8
17.1
1.4
1.2
Jamna Auto Industries Neutral
178
-
1,423
1,486
1,620
9.8
9.9
15.0
17.2
11.9
10.4
2.6
2.2
21.8
21.3
1.0
0.9
JK Tyres
Neutral
122
-
2,764
7,455
8,056
15.0
15.0
21.8
24.5
5.6
5.0
1.2
1.0
22.8
21.3
0.5
0.4
L G Balakrishnan & Bros Neutral
615
-
965
1,302
1,432
11.6
11.9
43.7
53.0
14.1
11.6
2.0
1.8
13.8
14.2
0.8
0.8
Mahindra and Mahindra Neutral
1,186
-
73,658
46,534
53,077
11.6
11.7
67.3
78.1
17.6
15.2
2.9
2.5
15.4
15.8
1.6
1.3
Maruti
Accumulate
5,263
6,006
158,998
68,057
82,958
15.8
15.5
212.1
261.2
24.8
20.2
4.9
4.1
19.8
20.3
2.0
1.6
Minda Industries
Neutral
307
-
2,431
2,728
3,042
9.0
9.1
68.2
86.2
4.5
3.6
1.0
0.8
23.8
24.3
0.9
0.8
Motherson Sumi
Neutral
309
-
43,414
45,896
53,687
7.8
8.2
13.0
16.1
23.7
19.2
7.6
6.1
34.7
35.4
1.0
0.8
Rane Brake Lining
Neutral
974
-
771
511
562
11.3
11.5
28.1
30.9
34.7
31.5
5.3
4.8
15.3
15.0
1.6
1.5
Setco Automotive
Neutral
39
-
518
741
837
13.0
13.0
15.2
17.0
2.6
2.3
0.4
0.4
15.8
16.3
1.1
1.0
Subros
Neutral
172
-
1,032
1,488
1,681
11.7
11.9
6.4
7.2
26.9
24.0
2.8
2.6
10.8
11.4
0.9
0.8
Swaraj Engines
Neutral
1,327
-
1,648
660
810
15.2
16.4
54.5
72.8
24.4
18.2
7.6
6.9
31.5
39.2
2.3
1.9
Tata Motors
Neutral
459
-
132,624
300,209
338,549
8.9
8.4
42.7
54.2
10.8
8.5
1.7
1.5
15.6
17.2
0.6
0.5
TVS Motor
Neutral
372
-
17,676
13,390
15,948
6.9
7.1
12.8
16.5
29.2
22.5
7.3
5.7
26.3
27.2
1.4
1.1
Banking
Axis BaAxis Bank
Buy
470
630
112,118
46,932
53,575
3.5
3.4
32.3
44.6
14.5
10.5
1.9
1.62
13.6
16.5
-
-
Bank of Baroda
Neutral
164
-
37,846
19,980
23,178
1.8
1.8
11.5
17.3
14.3
9.5
1.6
1.3
8.3
10.1
-
-
Canara Bank
Neutral
318
-
17,278
15,225
16,836
1.8
1.8
14.5
28.0
21.9
11.4
1.5
1.2
5.8
8.5
-
-
Dewan Housing Finance Buy
257
350
8,029
2,225
2,688
2.9
2.9
29.7
34.6
8.6
7.4
1.4
1.2
16.1
16.8
-
-
Equitas Holdings
Buy
161
235
5,388
939
1,281
11.7
11.5
5.8
8.2
27.7
19.6
2.4
2.1
10.9
11.5
-
-
Federal Bank
Neutral
71
-
12,139
9,353
10,623
2.9
2.9
4.4
5.8
16.1
12.2
1.5
1.4
9.5
11.0
-
-
HDFC
Neutral
1,265
-
199,945
11,475
13,450
3.4
3.4
45.3
52.5
27.9
24.1
5.4
4.8
20.2
20.5
-
-
HDFC Bank
Accumulate
1,200
1,350
303,708
46,097
55,433
4.5
4.5
58.4
68.0
20.5
17.6
3.6
3.01
18.8
18.6
-
-
ICICI Bank
Buy
265
315
154,208
42,800
44,686
3.1
3.3
18.0
21.9
14.7
12.1
2.0
1.9
11.1
12.3
-
-
Lakshmi Vilas Bank
Buy
149
174
2,682
3,339
3,799
2.7
2.8
11.0
14.0
13.6
10.7
1.4
1.3
11.2
12.7
-
-
December 1, 2016
18
Stock Watch | December 2016
Company Name
Reco
CMP
Target
Mkt Cap
Sales (` cr)
OPM (%)
EPS (`)
PER (x)
P/BV (x)
RoE (%)
EV/Sales (x)
(`)
Price (`)
(` cr)
FY17E
FY18E
FY17E
FY18E
FY17E
FY18E
FY17E
FY18E
FY17E
FY18E
FY17E
FY18E
FY17E
FY18E
LIC Housing Finance
Accumulate
564
630
28,453
3,712
4,293
2.6
2.5
39.0
46.0
14.5
12.3
2.7
2.3
19.9
20.1
-
-
Punjab Natl.Bank
Neutral
138
-
29,409
23,532
23,595
2.3
2.4
6.8
12.6
20.3
11.0
3.1
2.2
3.3
6.5
-
-
RBL Bank
Neutral
364
-
13,452
1,783
2,309
2.6
2.6
12.7
16.4
28.6
22.2
3.1
2.8
12.8
13.3
-
-
South Ind.Bank
Neutral
22
-
2,903
6,435
7,578
2.5
2.5
2.7
3.1
8.0
6.9
1.0
0.9
10.1
11.2
-
-
St Bk of India
Neutral
258
-
200,590
88,650
98,335
2.6
2.6
13.5
18.8
19.1
13.7
1.8
1.6
7.0
8.5
-
-
Union Bank
Neutral
152
-
10,442
13,450
14,925
2.3
2.3
25.5
34.5
6.0
4.4
0.9
0.7
7.5
10.2
-
-
Yes Bank
Neutral
1,171
-
49,316
8,978
11,281
3.3
3.4
74.0
90.0
15.8
13.0
3.0
2.5
17.0
17.2
-
-
Capital Goods
ACE
Neutral
50
-
498
709
814
4.1
4.6
1.4
2.1
35.9
24.0
1.5
1.4
4.4
6.0
0.9
0.8
BEML
Neutral
842
-
3,507
3,451
4,055
6.3
9.2
31.4
57.9
26.8
14.5
1.6
1.5
6.3
10.9
1.1
0.9
Bharat Electronics
Neutral
1,439
-
32,143
8,137
9,169
16.8
17.2
58.7
62.5
24.5
23.0
3.8
3.4
44.6
46.3
2.9
2.6
Voltas
Buy
315
407
10,406
6,511
7,514
7.9
8.7
12.9
16.3
24.4
19.3
4.4
3.8
16.7
18.5
1.3
1.1
BGR Energy
Neutral
112
-
807
16,567
33,848
6.0
5.6
7.8
5.9
14.3
19.0
0.8
0.8
4.7
4.2
0.1
0.1
BHEL
Neutral
130
-
31,904
28,797
34,742
-
2.8
2.3
6.9
56.7
18.9
1.0
0.9
1.3
4.8
0.8
0.5
Blue Star
Buy
491
634
4,679
4,283
5,077
5.9
7.3
14.9
22.1
33.0
22.2
6.4
5.4
20.4
26.4
1.1
1.0
Crompton Greaves
Neutral
77
-
4,832
5,777
6,120
5.9
7.0
3.3
4.5
23.4
17.1
1.0
1.0
4.4
5.9
0.8
0.7
Greaves Cotton
Neutral
126
-
3,079
1,755
1,881
16.8
16.9
7.8
8.5
16.2
14.8
3.2
3.0
20.6
20.9
1.4
1.3
Inox Wind
Neutral
191
-
4,232
5,605
6,267
15.7
16.4
24.8
30.0
7.7
6.4
2.1
1.6
25.9
24.4
0.8
0.7
KEC International
Neutral
146
-
3,741
9,294
10,186
7.9
8.1
9.9
11.9
14.7
12.2
2.2
1.9
15.6
16.3
0.6
0.6
Thermax
Neutral
843
-
10,050
5,421
5,940
7.3
7.3
25.7
30.2
32.8
27.9
4.0
3.6
12.2
13.1
1.7
1.6
VATech Wabag
Buy
496
681
2,705
3,136
3,845
8.9
9.1
26.0
35.9
19.1
13.8
2.4
2.0
13.4
15.9
0.8
0.6
Cement
ACC
Neutral
1,343
-
25,212
11,225
13,172
13.2
16.9
44.5
75.5
30.2
17.8
2.9
2.6
11.2
14.2
2.2
1.9
Ambuja Cements
Neutral
210
-
41,778
9,350
10,979
18.2
22.5
5.8
9.5
36.3
22.1
3.0
2.7
10.2
12.5
4.5
3.8
India Cements
Neutral
120
-
3,671
4,364
4,997
18.5
19.2
7.9
11.3
15.1
10.6
1.1
1.1
8.0
8.5
1.6
1.4
JK Cement
Neutral
728
-
5,091
4,398
5,173
15.5
17.5
31.2
55.5
23.3
13.1
2.8
2.4
12.0
15.5
1.7
1.4
J K Lakshmi Cement
Buy
412
565
4,849
2,913
3,412
14.5
19.5
7.5
22.5
54.9
18.3
3.4
2.8
12.5
18.0
2.2
1.9
Orient Cement
Buy
136
215
2,783
2,114
2,558
18.5
20.5
8.1
11.3
16.8
12.0
2.5
2.1
9.0
14.0
1.9
1.5
UltraTech Cement
Neutral
3,594
-
98,638
25,768
30,385
21.0
23.5
111.0
160.0
32.4
22.5
4.1
3.6
13.5
15.8
3.9
3.3
Construction
Engineers India
Neutral
293
-
9,866
1,725
1,935
16.0
19.1
11.4
13.9
25.7
21.1
3.5
3.4
13.4
15.3
4.6
4.2
Gujarat Pipavav Port
Neutral
140
-
6,773
705
788
52.2
51.7
5.0
5.6
28.0
25.0
2.8
2.5
11.2
11.2
9.3
7.8
ITNL
Neutral
101
-
3,329
8,946
10,017
31.0
31.6
8.1
9.1
12.5
11.1
0.5
0.5
4.2
5.0
3.7
3.4
KNR Constructions
Accumulate
735
802
2,068
1,385
1,673
14.7
14.0
41.2
48.5
17.8
15.2
3.3
2.9
14.9
15.2
1.6
1.3
Larsen & Toubro
Buy
1,383
1,634
128,855
111,017
124,908
11.0
11.0
61.1
66.7
22.6
20.7
2.7
2.5
13.1
13.0
2.2
2.0
MEP Infra
Neutral
37
-
597
1,877
1,943
30.6
29.8
3.0
4.2
12.3
8.8
5.9
4.0
0.6
0.6
1.7
1.5
Nagarjuna Const.
Neutral
80
-
4,459
8,842
9,775
9.1
8.8
5.3
6.4
15.1
12.5
1.2
1.1
8.2
9.1
0.7
0.6
NBCC
Neutral
228
-
13,686
7,428
9,549
7.9
8.6
8.2
11.0
27.8
20.7
1.4
1.1
28.2
28.7
1.6
1.1
PNC Infratech
Buy
111
143
2,837
2,350
2,904
13.1
13.2
9.0
8.8
12.3
12.6
0.4
0.4
15.9
13.9
1.3
1.1
December 1, 2016
19
Stock Watch | December 2016
Company Name
Reco
CMP
Target
Mkt Cap
Sales (` cr)
OPM (%)
EPS (`)
PER (x)
P/BV (x)
RoE (%)
EV/Sales (x)
(`)
Price (`)
(` cr)
FY17E
FY18E
FY17E
FY18E
FY17E
FY18E
FY17E
FY18E
FY17E
FY18E
FY17E
FY18E
FY17E
FY18E
Power Mech Projects
Neutral
469
-
689
1,801
2,219
12.7
14.6
72.1
113.9
6.5
4.1
1.2
1.0
16.8
11.9
0.4
0.3
Sadbhav Engineering
Accumulate
276
298
4,734
3,598
4,140
10.3
10.6
9.0
11.9
30.7
23.2
3.2
2.8
9.9
11.9
1.6
1.4
Simplex Infra
Neutral
302
-
1,494
6,829
7,954
10.5
10.5
31.4
37.4
9.6
8.1
1.0
0.9
9.9
13.4
0.6
0.5
SIPL
Neutral
90
-
3,174
1,036
1,252
65.5
66.2
(8.4)
(5.6)
-
-
3.4
3.9
(22.8)
(15.9)
11.3
9.4
FMCG
Asian Paints
Neutral
970
-
93,028
17,128
18,978
16.8
16.4
19.1
20.7
50.8
46.9
17.7
16.7
34.8
35.5
5.3
4.8
Britannia
Buy
3,038
3,626
36,444
9,594
11,011
14.6
14.9
80.3
94.0
37.8
32.3
15.6
12.0
41.2
-
3.7
3.1
Colgate
Accumulate
934
995
25,408
4,605
5,149
23.4
23.4
23.8
26.9
39.3
34.7
21.7
17.0
64.8
66.8
5.4
4.8
Dabur India
Accumulate
283
304
49,845
8,315
9,405
19.8
20.7
8.1
9.2
35.0
30.8
9.7
8.1
31.6
31.0
5.6
5.0
GlaxoSmith Con*
Neutral
4,992
-
20,993
4,350
4,823
21.2
21.4
179.2
196.5
27.9
25.4
7.4
6.3
27.1
26.8
4.2
3.7
Godrej Consumer
Neutral
1,452
-
49,444
10,235
11,428
18.4
18.6
41.1
44.2
35.3
32.8
7.8
6.6
24.9
24.8
4.9
4.3
HUL
Neutral
844
-
182,727
35,252
38,495
17.8
17.8
20.6
22.4
40.9
37.7
39.1
33.5
95.6
88.9
5.0
4.6
ITC
Buy
233
284
281,129
40,059
44,439
38.3
39.2
9.0
10.1
25.9
23.0
7.2
6.3
27.8
27.5
6.5
5.9
Marico
Buy
252
300
32,551
6,430
7,349
18.8
19.5
6.4
7.7
39.4
32.8
11.9
10.0
33.2
32.5
4.9
4.2
Nestle*
Neutral
6,257
-
60,324
10,073
11,807
20.7
21.5
124.8
154.2
50.1
40.6
20.6
18.5
34.8
36.7
5.8
4.9
Procter & Gamble
Accumulate
6,639
7,369
21,551
2,939
3,342
23.2
23.0
146.2
163.7
45.4
40.6
101.7
97.5
25.3
23.5
6.9
6.0
Tata Global
Neutral
124
-
7,817
8,675
9,088
9.8
9.8
7.4
8.2
16.7
15.1
1.9
1.8
7.9
8.1
0.8
0.8
IT
HCL Tech^
Buy
803
1,000
113,255
49,242
57,168
20.5
20.5
55.7
64.1
14.4
12.5
2.9
2.2
20.3
17.9
2.2
1.7
Infosys
Buy
975
1,249
224,056
68,350
77,326
27.0
27.0
62.5
69.4
15.6
14.1
3.3
3.0
21.3
21.6
2.7
2.3
TCS
Buy
2,277
2,620
448,617
119,025
133,308
27.6
27.6
131.2
145.5
17.4
15.6
5.6
5.2
32.4
33.1
3.5
3.1
Tech Mahindra
Buy
485
600
47,123
29,673
32,937
15.5
17.0
32.8
39.9
14.8
12.2
2.9
2.5
19.6
20.7
1.3
1.1
Wipro
Buy
465
590
113,053
55,440
60,430
18.1
18.1
35.9
39.9
13.0
11.7
2.3
2.1
19.0
19.3
1.7
1.6
Media
D B Corp
Neutral
363
-
6,676
2,297
2,590
27.4
28.2
21.0
23.4
17.3
15.5
4.0
3.5
23.7
23.1
2.7
2.3
Hindustan Media Ven.
Neutral
271
-
1,991
1,016
1,138
24.3
25.2
27.3
30.1
9.9
9.0
1.9
1.7
16.2
15.8
1.3
1.1
HT Media
Neutral
72
-
1,664
2,693
2,991
12.6
12.9
7.9
9.0
9.1
7.9
0.8
0.7
7.8
8.3
0.2
0.1
Jagran Prakashan
Buy
176
225
5,744
2,355
2,635
28.0
28.0
10.8
12.5
16.3
14.1
3.5
3.0
21.7
21.7
2.5
2.1
Sun TV Network
Neutral
471
-
18,557
2,850
3,265
70.1
71.0
26.2
30.4
18.0
15.5
4.6
4.1
24.3
25.6
6.1
5.2
TV Today Network
Buy
315
385
1,882
637
743
27.5
27.5
18.4
21.4
17.2
14.8
3.0
2.5
17.4
17.2
2.6
2.1
Metal
Coal India
Neutral
308
-
194,670
84,638
94,297
21.4
22.3
24.5
27.1
12.6
11.4
5.2
5.0
42.6
46.0
1.8
1.6
Hind. Zinc
Neutral
282
-
119,260
14,252
18,465
55.9
48.3
15.8
21.5
17.9
13.1
2.9
2.5
17.0
20.7
8.4
6.5
Hindalco
Neutral
176
-
36,323
107,899
112,095
7.4
8.2
9.2
13.0
19.1
13.5
0.9
0.9
4.8
6.6
0.9
0.8
JSW Steel
Neutral
1,727
-
41,733
53,201
58,779
16.1
16.2
130.6
153.7
13.2
11.2
1.8
1.6
14.0
14.4
1.5
1.3
NMDC
Neutral
122
-
38,599
6,643
7,284
44.4
47.7
7.1
7.7
17.2
15.8
1.5
1.4
8.8
9.2
3.6
3.2
SAIL
Neutral
51
-
21,146
47,528
53,738
(0.7)
2.1
(1.9)
2.6
-
19.7
0.6
0.5
(1.6)
3.9
1.3
1.2
Tata Steel
Neutral
415
-
40,301
121,374
121,856
7.2
8.4
18.6
34.3
22.3
12.1
1.4
1.3
6.1
10.1
1.0
0.9
Vedanta
Neutral
230
-
68,143
71,744
81,944
19.2
21.7
13.4
20.1
17.2
11.4
1.5
1.3
8.4
11.3
1.3
1.0
December 1, 2016
20
Stock Watch | December 2016
Company Name
Reco
CMP
Target
Mkt Cap
Sales (` cr)
OPM (%)
EPS (`)
PER (x)
P/BV (x)
RoE (%)
EV/Sales (x)
(`)
Price (`)
(` cr)
FY17E
FY18E
FY17E
FY18E
FY17E
FY18E
FY17E
FY18E
FY17E
FY18E
FY17E
FY18E
FY17E
FY18E
Oil & Gas
Cairn India
Neutral
252
-
47,275
9,127
10,632
4.3
20.6
8.8
11.7
28.7
21.6
0.9
0.9
3.3
4.2
6.6
5.5
GAIL
Neutral
425
-
53,885
56,220
65,198
9.3
10.1
27.1
33.3
15.7
12.8
1.4
1.3
9.3
10.7
1.1
1.0
Indian Oil Corp
Neutral
307
-
148,931
373,359
428,656
5.9
5.5
54.0
59.3
5.7
5.2
0.9
0.8
16.0
15.6
0.5
0.5
ONGC
Neutral
289
-
247,254
137,222
152,563
15.0
21.8
19.5
24.1
14.8
12.0
1.3
1.2
8.5
10.1
2.1
1.9
Reliance Industries
Neutral
993
-
321,894
301,963
358,039
12.1
12.6
87.7
101.7
11.3
9.8
1.2
1.1
10.7
11.3
1.5
1.3
Pharmaceuticals
Alembic Pharma
Neutral
663
-
12,490
3,483
4,083
20.2
21.4
24.3
30.4
27.3
21.8
6.2
5.0
25.5
25.3
3.5
2.9
Aurobindo Pharma
Buy
740
877
43,294
15,720
18,078
23.7
23.7
41.4
47.3
17.9
15.6
4.6
3.6
29.6
26.1
3.0
2.6
Aventis*
Neutral
4,466
-
10,284
2,277
2,597
17.3
18.3
149.4
172.0
29.9
26.0
5.0
4.0
25.1
28.8
4.2
3.4
Cadila Healthcare
Neutral
402
-
41,129
10,429
12,318
22.6
22.0
16.9
19.2
23.8
20.9
6.1
4.9
28.5
25.7
3.9
3.2
Cipla
Reduce
567
490
45,526
15,378
18,089
17.4
18.4
21.6
27.2
26.2
20.8
3.4
3.0
13.7
15.2
3.2
2.6
Dr Reddy's
Neutral
3,199
-
53,004
16,043
18,119
20.8
22.4
112.4
142.9
28.5
22.4
3.8
3.3
14.1
15.9
3.3
2.9
Dishman Pharma
Neutral
237
-
3,827
1,718
1,890
22.7
22.8
9.5
11.3
25.0
21.0
2.4
2.2
10.1
10.9
2.7
2.3
GSK Pharma*
Neutral
2,694
-
22,815
3,000
3,312
15.4
20.6
46.5
60.8
57.9
44.3
13.9
13.9
26.3
30.6
7.3
6.7
Indoco Remedies
Reduce
258
240
2,377
1,112
1,289
16.2
18.2
11.6
16.0
22.2
16.1
3.6
3.0
17.0
20.1
2.3
1.9
Ipca labs
Accumulate
578
613
7,298
3,303
3,799
15.3
15.3
17.3
19.7
33.4
29.4
2.9
2.7
9.1
9.4
2.3
2.0
Lupin
Buy
1,503
1,809
67,770
15,912
18,644
26.4
26.7
58.1
69.3
25.9
21.7
5.0
4.1
21.4
20.9
4.3
3.6
Sun Pharma
Buy
710
847
170,947
31,129
35,258
32.0
32.9
30.2
35.3
23.5
20.1
3.8
3.2
20.0
20.1
5.1
4.3
Power
NTPC
Neutral
163
-
134,525
86,605
95,545
17.5
20.8
11.8
13.4
13.8
12.2
1.4
1.3
10.5
11.1
2.9
2.9
Power Grid
Buy
192
223
100,447
25,315
29,193
88.2
88.7
14.2
17.2
13.6
11.2
2.1
1.8
15.2
16.1
8.6
7.7
Tata Power
Neutral
74
-
20,028
36,916
39,557
17.4
27.1
5.1
6.3
14.5
11.8
1.3
1.2
9.0
10.3
1.6
1.4
Real Estate
MLIFE
Buy
377
522
1,547
1,152
1,300
22.7
24.6
29.9
35.8
12.6
10.5
0.9
0.9
7.6
8.6
2.1
1.7
Prestige Estate
Buy
153
210
5,736
4,707
5,105
25.2
26.0
10.3
13.0
14.8
11.8
1.2
1.1
10.3
10.2
2.4
2.1
Telecom
Bharti Airtel
Neutral
325
-
129,716
105,086
114,808
34.5
34.7
12.2
16.4
26.6
19.8
1.8
1.7
6.8
8.4
2.1
1.9
Idea Cellular
Neutral
78
-
27,924
40,133
43,731
37.2
37.1
6.4
6.5
12.1
11.9
1.0
0.9
8.2
7.6
1.7
1.5
Others
Abbott India
Neutral
4,896
-
10,404
3,153
3,583
14.1
14.4
152.2
182.7
32.2
26.8
157.9
134.9
25.6
26.1
3.0
2.6
Asian Granito
Buy
222
351
668
1,071
1,182
12.1
12.4
12.7
16.0
17.5
13.9
1.7
1.5
9.5
10.7
0.9
0.8
Bajaj Electricals
Buy
223
274
2,249
4,801
5,351
5.7
6.2
10.4
13.7
21.4
16.3
2.6
2.4
12.4
14.5
0.5
0.4
Banco Products (India)
Neutral
196
-
1,404
1,353
1,471
12.3
12.4
14.5
16.3
13.5
12.0
18.7
16.8
14.5
14.6
1.0
0.9
Coffee Day Enterprises
Neutral
210
-
4,323
2,964
3,260
20.5
21.2
4.7
8.0
-
26.2
2.4
2.2
5.5
8.5
1.9
1.7
Competent Automobiles Neutral
162
-
100
1,137
1,256
3.1
2.7
28.0
23.6
5.8
6.9
31.2
28.2
14.3
11.5
0.1
0.1
Elecon Engineering
Neutral
52
-
570
1,482
1,660
13.7
14.5
3.9
5.8
13.4
9.0
3.2
2.9
7.8
10.9
0.7
0.6
Finolex Cables
Neutral
413
-
6,323
2,883
3,115
12.0
12.1
14.2
18.6
29.1
22.2
15.5
13.5
15.8
14.6
1.9
1.7
Garware Wall Ropes
Neutral
627
-
1,371
873
938
14.3
14.3
35.1
37.5
17.8
16.7
3.1
2.7
17.5
15.9
1.5
1.4
December 1, 2016
21
Stock Watch | December 2016
Company Name
Reco
CMP
Target
Mkt Cap
Sales (` cr)
OPM (%)
EPS (`)
PER (x)
P/BV (x)
RoE (%)
EV/Sales (x)
(`)
Price (`)
(` cr)
FY17E
FY18E
FY17E
FY18E
FY17E
FY18E
FY17E
FY18E
FY17E
FY18E
FY17E
FY18E
FY17E
FY18E
Goodyear India*
Neutral
750
-
1,730
1,598
1,704
10.4
10.2
49.4
52.6
15.2
14.3
70.1
61.5
18.2
17.0
0.8
0.7
Hitachi
Neutral
1,448
-
3,937
2,081
2,433
8.8
8.9
33.4
39.9
43.4
36.3
35.0
29.1
22.1
21.4
1.9
1.6
HSIL
Neutral
294
-
2,129
2,384
2,515
15.8
16.3
15.3
19.4
19.2
15.2
19.1
16.5
7.8
9.3
1.1
1.0
Interglobe Aviation
Neutral
860
-
30,983
21,122
26,005
14.5
27.6
110.7
132.1
7.8
6.5
46.5
33.2
168.5
201.1
1.4
1.1
Jyothy Laboratories
Neutral
352
-
6,383
1,440
2,052
11.5
13.0
8.5
10.0
41.4
35.2
10.0
9.3
18.6
19.3
4.7
3.3
Kirloskar Engines India
Neutral
335
-
4,843
2,554
2,800
9.9
10.0
10.5
12.1
31.9
27.7
13.3
12.6
10.7
11.7
1.5
1.4
Linc Pen & Plastics
Neutral
237
-
350
382
420
9.3
9.5
13.5
15.7
17.6
15.1
3.0
2.6
17.1
17.3
1.0
0.9
M M Forgings
Neutral
424
-
512
546
608
20.4
20.7
41.3
48.7
10.3
8.7
58.1
51.4
16.6
17.0
0.8
0.7
Manpasand Bever.
Neutral
615
-
3,515
836
1,087
19.6
19.4
16.9
23.8
36.4
25.8
4.4
3.8
12.0
14.8
3.9
2.9
Mirza International
Buy
81
107
973
987
1,106
18.0
18.0
6.5
7.6
12.4
10.6
2.0
1.7
15.9
15.7
1.2
1.1
MT Educare
Neutral
117
-
465
366
417
17.7
18.2
9.4
10.8
12.5
10.8
2.8
2.4
22.2
22.3
1.2
1.0
Narayana Hrudaya
Neutral
345
-
7,055
1,873
2,166
11.5
11.7
2.6
4.0
130.5
87.1
8.0
7.2
6.1
8.3
3.9
3.3
Navkar Corporation
Buy
175
265
2,496
369
561
42.9
42.3
7.2
11.5
24.2
15.2
1.8
1.6
7.3
10.5
7.8
5.1
Navneet Education
Neutral
111
-
2,653
1,062
1,147
24.0
24.0
6.1
6.6
18.3
16.8
3.8
3.3
20.5
19.8
2.6
2.4
Nilkamal
Neutral
1,400
-
2,089
1,995
2,165
10.7
10.4
69.8
80.6
20.1
17.4
80.0
69.5
16.6
16.5
1.0
0.9
Page Industries
Neutral
13,388
-
14,933
2,450
3,124
20.1
17.6
299.0
310.0
44.8
43.2
298.2
227.6
47.1
87.5
6.1
4.8
Parag Milk Foods
Neutral
271
-
2,277
1,919
2,231
9.3
9.6
9.4
12.9
28.7
20.9
4.4
3.7
15.5
17.5
1.3
1.1
Quick Heal
Neutral
236
-
1,650
408
495
27.3
27.0
7.7
8.8
30.4
26.8
2.8
2.8
9.3
10.6
3.2
2.6
Radico Khaitan
Buy
119
147
1,589
1,667
1,824
13.0
13.2
6.6
8.2
18.0
14.6
1.6
1.5
9.0
10.2
1.3
1.2
Relaxo Footwears
Neutral
430
-
5,158
2,085
2,469
9.2
8.2
7.6
7.9
56.8
54.1
22.0
18.8
17.9
18.8
2.6
2.2
S H Kelkar & Co.
Neutral
296
-
4,287
1,036
1,160
15.1
15.0
6.1
7.2
48.5
41.3
5.2
4.8
10.7
11.5
4.0
3.5
Siyaram Silk Mills
Buy
1,250
1,605
1,172
1,733
1,948
11.6
11.7
96.6
114.7
12.9
10.9
2.0
1.7
15.3
15.7
0.9
0.8
Styrolution ABS India*
Neutral
588
-
1,034
1,440
1,537
9.2
9.0
40.6
42.6
14.5
13.8
37.0
33.6
12.3
11.6
0.7
0.6
Surya Roshni
Neutral
207
-
906
3,342
3,625
7.8
7.5
17.3
19.8
12.0
10.5
22.7
18.2
10.5
10.8
0.5
0.5
Team Lease Serv.
Neutral
868
-
1,484
3,229
4,001
1.5
1.8
22.8
32.8
38.1
26.4
4.1
3.5
10.7
13.4
0.4
0.3
The Byke Hospitality
Neutral
173
-
695
287
384
20.5
20.5
7.6
10.7
22.8
16.2
4.8
3.9
20.7
23.5
2.4
1.8
Transport Corp. of India
Neutral
175
-
1,341
2,671
2,911
8.5
8.8
13.9
15.7
12.6
11.2
1.7
1.5
13.7
13.8
0.6
0.6
TVS Srichakra
Neutral
3,493
-
2,675
2,304
2,614
13.7
13.8
231.1
266.6
15.1
13.1
392.5
309.1
33.9
29.3
1.2
1.0
UFO Moviez
Neutral
442
-
1,220
619
685
33.2
33.4
30.0
34.9
14.7
12.7
2.0
1.8
13.8
13.9
1.7
1.3
Visaka Industries
Neutral
200
-
317
1,051
1,138
10.3
10.4
21.0
23.1
9.5
8.6
25.6
24.0
9.0
9.2
0.6
0.5
VRL Logistics
Neutral
275
-
2,509
1,902
2,119
16.7
16.6
14.6
16.8
18.9
16.3
4.1
3.6
21.9
22.2
1.4
1.3
Wonderla Holidays
Neutral
339
-
1,916
287
355
38.0
40.0
11.3
14.2
30.0
23.9
4.3
3.8
21.4
23.9
6.4
5.2
Source: Company, Angel Research, Note: *December year end; #September year end;
&October year end; ^June year end; Price as of November 30, 2016
December 1, 2016
22
Top Picks Report | December 2016
Research Team Tel: 022 - 39357800
DISCLAIMER
Angel Broking Private Limited (hereinafter referred to as “Angel”) is a registered Member of National Stock Exchange of India Limited,
Bombay Stock Exchange Limited and Metropolitan Stock Exchange Limited. It is also registered as a Depository Participant with CDSL
and Portfolio Manager with SEBI. It also has registration with AMFI as a Mutual Fund Distributor. Angel Broking Private Limited is a
registered entity with SEBI for Research Analyst in terms of SEBI (Research Analyst) Regulations, 2014 vide registration number
INH000000164. Angel or its associates has not been debarred/ suspended by SEBI or any other regulatory authority for accessing
/dealing in securities Market. Angel or its associates/analyst has not received any compensation / managed or co-managed public
offering of securities of the company covered by Analyst during the past twelve months.
This document is solely for the personal information of the recipient, and must not be singularly used as the basis of any investment
decision. Nothing in this document should be construed as investment or financial advice. Each recipient of this document should
make such investigations as they deem necessary to arrive at an independent evaluation of an investment in the securities of the
companies referred to in this document (including the merits and risks involved), and should consult their own advisors to determine
the merits and risks of such an investment.
Reports based on technical and derivative analysis center on studying charts of a stock's price movement, outstanding positions and
trading volume, as opposed to focusing on a company's fundamentals and, as such, may not match with a report on a company's
fundamentals. Investors are advised to refer the Fundamental and Technical Research Reports available on our website to evaluate the
contrary view, if any.
The information in this document has been printed on the basis of publicly available information, internal data and other reliable
sources believed to be true, but we do not represent that it is accurate or complete and it should not be relied on as such, as this
document is for general guidance only. Angel Broking Pvt. Limited or any of its affiliates/ group companies shall not be in any way
responsible for any loss or damage that may arise to any person from any inadvertent error in the information contained in this report.
Angel Broking Pvt. Limited has not independently verified all the information contained within this document. Accordingly, we cannot
testify, nor make any representation or warranty, express or implied, to the accuracy, contents or data contained within this document.
While Angel Broking Pvt. Limited endeavors to update on a reasonable basis the information discussed in this material, there may be
regulatory, compliance, or other reasons that prevent us from doing so.
This document is being supplied to you solely for your information, and its contents, information or data may not be reproduced,
redistributed or passed on, directly or indirectly.
Neither Angel Broking Pvt. Limited, nor its directors, employees or affiliates shall be liable for any loss or damage that may arise from
or in connection with the use of this information.
Ratings (Based on expected returns
Buy (> 15%)
Accumulate (5% to 15%)
Neutral (-5 to 5%)
over 12 months investment period):
Reduce (-5% to -15%)
Sell (< -15)