3QCY2015 Result Update | Cement
October 30, 2015
Ambuja Cements
ACCUMULATE
CMP
`207
Performance Highlights
Target Price
`233
Quarterly results (Standalone)
Investment Period
12 Months
Y/E Dec. (` cr)
3QCY2015
2QCY2015
% chg qoq 3QCY2014
% chg yoy
Net Sales
2,095
2,493
(16.0)
2,188
(4.2)
Stock Info
EBIDTA
310
384
(19.2)
393
(21.2)
Sector
Cement
EBIDTA Margin (%)
14.7
15.4
(70bp)
17.9
(317bp
Market Cap (` cr)
32,396
Net Profit
154
226
(32.2)
239
(35.8)
Net Debt (` cr)
(4,610)
Source: Company, Angel Research
Beta
1.1
For 3QCY2015, Ambuja Cements (ACEM) reported an in line set of numbers on
52 Week High / Low
287/196
the operational front. The company reported a 1.7% yoy growth in cement
Avg. Daily Volume
193,085
volumes to
4.9mt (marginally below our estimate of
4.95mt). The
Face Value (`)
2
realization/tonne declined by 5.8% yoy to `4,276 (below our estimate of `4,345).
BSE Sensex
26,838
The EBITDA fell by 21.2% yoy to `310.1cr (in line with our estimate of `318.6cr).
Nifty
8,112
The EBITDA/tonne at `633, is down by 22.5% on a yoy basis (in line of our
Reuters Code
ABUJ.BO
estimate of `643).
Bloomberg Code
ACEM@IN
EBIDTA margin down 317bp yoy: For 3QCY2015, ACEM’s top-line fell by 4.2%
yoy to `2,095.2cr, impacted by weak demand and fall in realization. The
Shareholding Pattern (%)
company’s volume rose by 1.7% yoy (fell 16.7% qoq) to 4.9mt, while realization
Promoters
50.3
was down by 5.8% yoy due to pricing pressure in its key markets of North and
West regions. However, the operating performance was in line with our estimates,
MF / Banks / Indian Fls
12.8
led by operational efficiency. The company’s EBIDTA declined by 21.2% yoy to
FII / NRIs / OCBs
27.1
`310.1cr but was in line with our estimate of `318.9cr. The EBIDTA decline was
Indian Public / Others
9.9
led by weak realization and increase in other expenses (led by `40cr provision for
DMF). Hence the EBIDTA margin, at 14.7%, declined by 317bp yoy, but was in
Abs. (%)
3m 1yr
3yr
line with our estimate. The Reported PAT fell by 35.8% yoy to `153.6cr (below our
Sensex
(1.5)
0.6
45.1
estimate of `220.2cr), mainly due to higher depreciation and lower other income.
ACL
(9.4)
(6.8)
0.0
Outlook and valuation: Going forward, we expect ACEM’s volume growth to
remain under pressure due to lack of capacity, for the next two years. However,
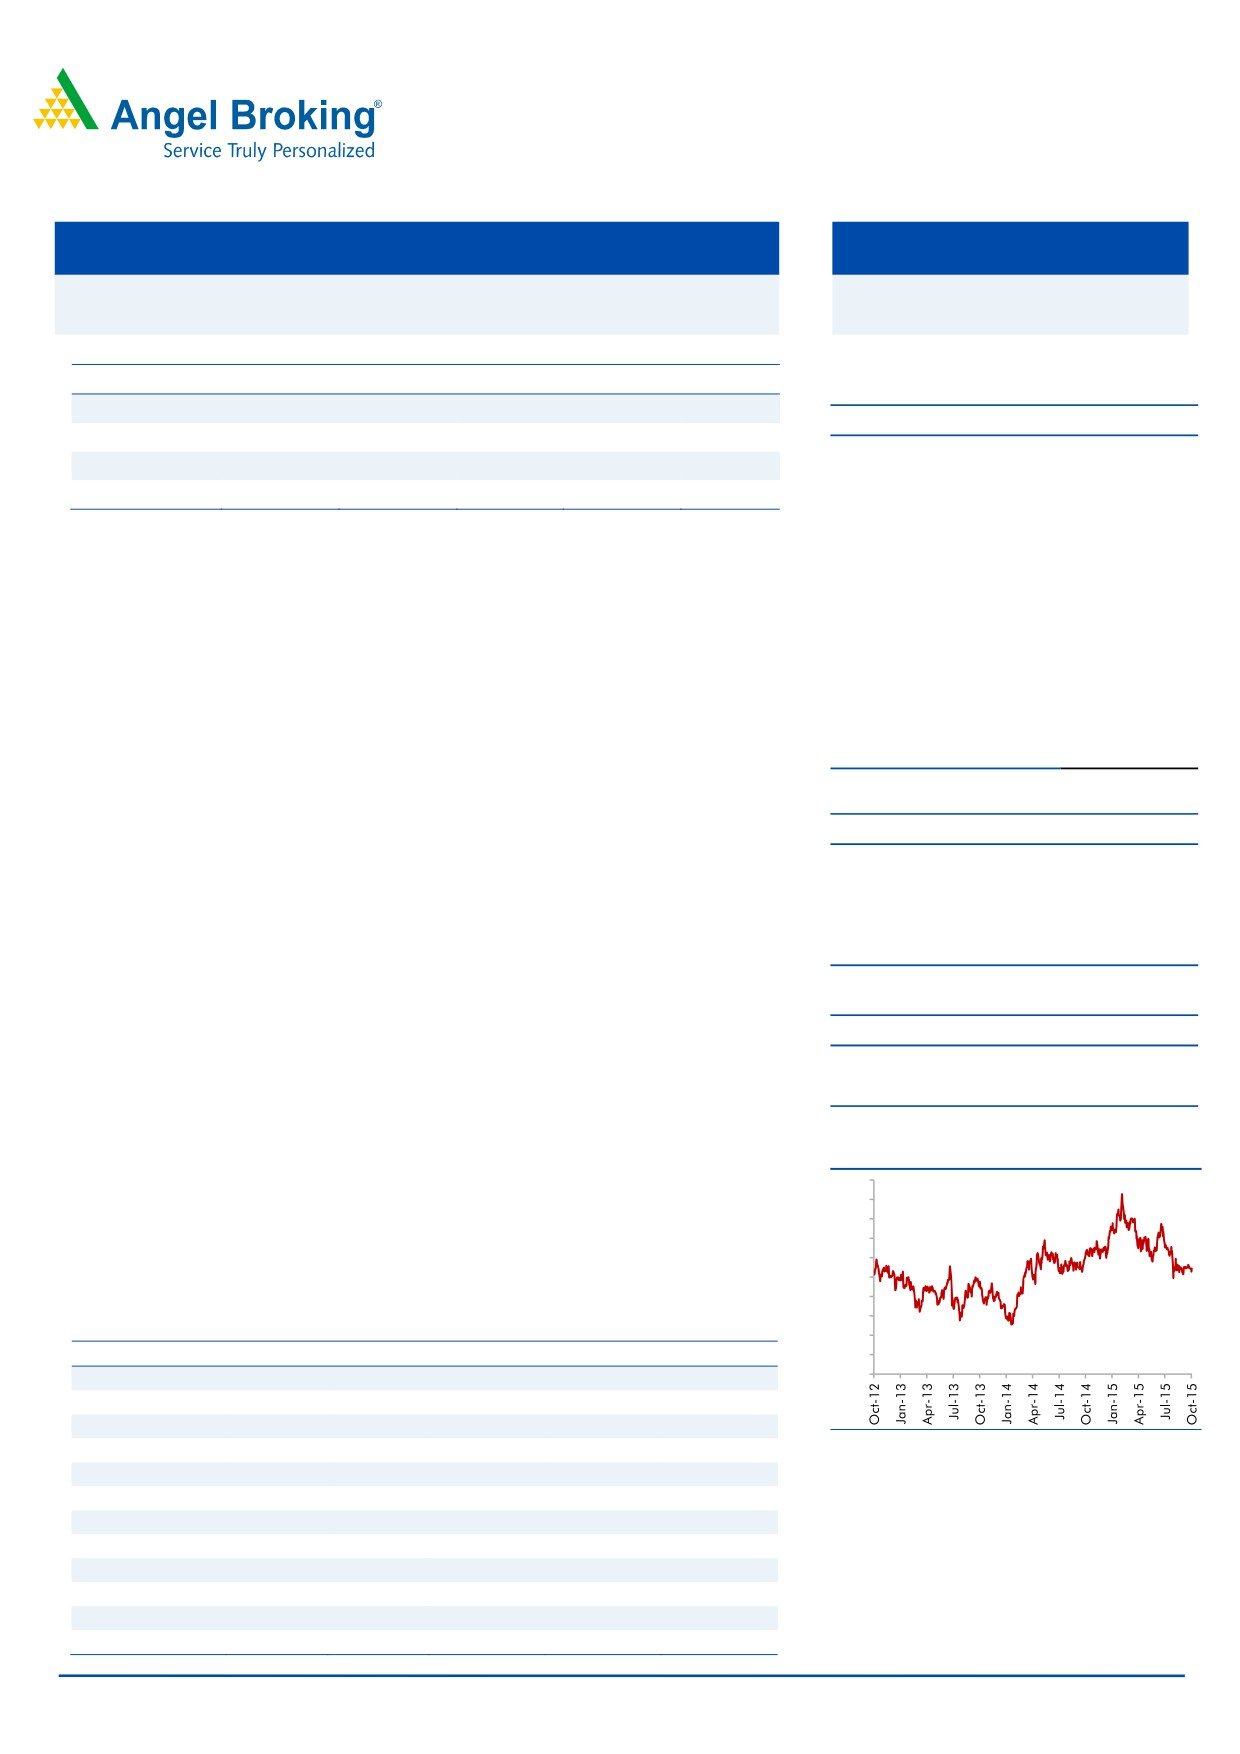
3-year price chart
we expect the top-line to register an 8.1% CAGR over CY2014-17E. At the current
300
market price, the stock is trading at an EV/tonne of US$150 on CY2017E
280
260
installed capacity and
10.6x EV/EBIDTA of CY2017E. We maintain our
240
Accumulate rating on the stock with target price of `233 on 12.5x EV/EBIDTA and
220
200
EV/tonne of US$165 on CY2017E installed capacity.
180
160
Key financials (Standalone)
140
Y/E Dec. (` cr)
CY2013
CY2014
CY2015E
CY2016E
CY2017E
120
100
Net sales
9,176
9,978
10,241
11,624
12,616
% chg
(6.1)
9.1
2.6
13.8
8.6
Adj. net profit
1,030
1,496
1,026
1,375
1,568
% chg
(34.7)
45.3
(31.4)
34.0
14.1
Source: Company, Angel Research
OPM (%)
18.4
19.5
16.8
19.4
20.7
FDEPS (`)
6.7
9.7
6.6
8.9
10.1
P/E (x)
31.1
21.4
31.3
23.3
20.5
P/BV (x)
3.4
3.2
3.1
2.9
2.8
RoE (%)
11.3
15.3
10.0
12.8
13.8
RoCE (%)
11.8
13.3
10.4
14.2
16.0
Shrenik Gujrathi
EV/Sales
3.1
2.8
2.7
2.4
2.2
022-39357800 Ext 6872
EV/EBITDA (x)
16.7
14.2
16.2
12.4
10.6
Source: Company, Angel Research; Note: CMP as of October 29, 2015
Please refer to important disclosures at the end of this report
1
Ambuja Cements | 3QCY2015 Result Update
Exhibit 1: 3QCY2015 performance (Standalone)
Y/E Dec. (` cr)
3QCY15
2QCY15
% chg qoq
3QCY14
% chg yoy
9MCY15
9MCY14
% chg
Net sales
2,095
2,492.76
(16.0)
2,188
(4.2)
70,125
75,337
(6.9)
Other operating income
16
18
(11.4)
15
8.3
719
377
90.5
Total operating income
2,111
2,510
(15.9)
2,202
(4.1)
70,844
75,714
(6.4)
Net raw-material costs
109
178
(38.9)
149
(26.7)
4,954
5,532
(10.5)
(% of sales)
5.2
7.1
6.8
7.0
7.3
Power & fuel
486
584
(16.8)
510
(4.6)
16,073
17,123
(6.1)
(% of sales)
23.0
23.3
23.2
22.7
22.6
Staff costs
151
150
0.9
142
6.4
4,497
4,122
9.1
(% of sales)
7.2
6.0
6.5
6.3
5.4
Freight & forwarding
554
715
(22.5)
548
1.0
18,897
18,952
(0.3)
(% of sales)
26.2
28.5
24.9
26.7
25.0
Other expenses
500
499
0.3
459
8.9
14,344
14,045
2.1
(% of sales)
23.7
19.9
20.9
20.2
18.5
Total expenditure
1,801
2,127
(15.3)
1,809
(0.4)
58,763
59,773
(1.7)
Operating profit
310
384
(19.2)
393
(21.2)
12,081
15,941
(24.2)
OPM (%)
14.7
15.4
(70bp)
17.9
(317)bp
17.1
21.1
(400bp)
Interest
21
32
(34.3)
18
16.1
737
542
35.9
Depreciation
155
149
4.5
130
19.3
4,615
3,740
23.4
Other income
74
106
(29.9)
89
(16.3)
2,749
3,585
(23.3)
Exceptional Inc./(Exp.)
-
-
-
0
0
PBT
208
309
(32.7)
334
(37.6)
9,478
15,244
(37.8)
Provision for taxation
55
83
(34.2)
95
(42.4)
2,460
3,308
(25.6)
(% of PBT)
26.2
26.8
28.4
26.0
21.7
Reported PAT
154
226
(32.2)
239
(35.8)
7,018
11,936
(41.2)
PATM (%)
7.3
9.0
(174bp)
10.9
(358bp)
9.9
15.8
(586bp)
EPS (`)
1.0
1.5
1.5
4.5
7.5
Source: Company, Angel Research
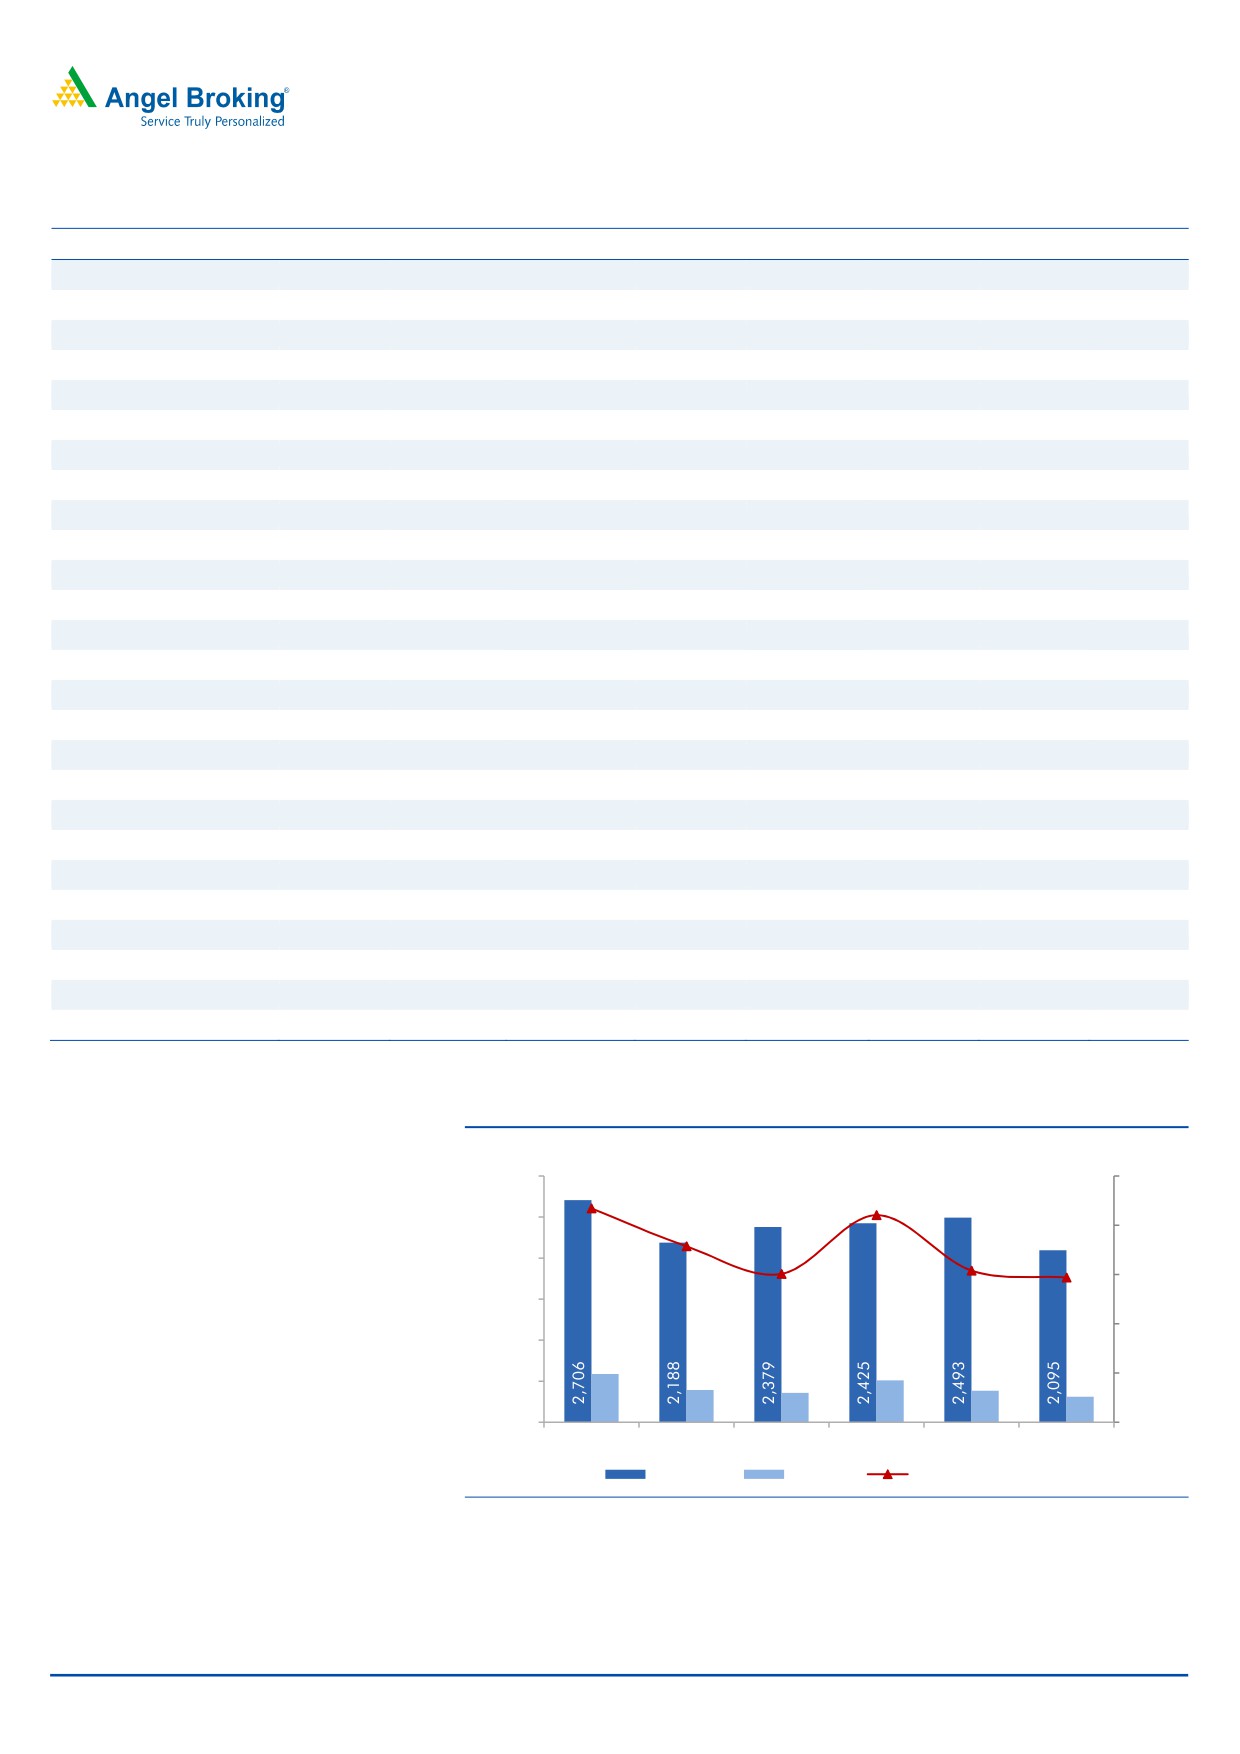
Exhibit 2: Financial performance
(` cr)
(%)
3,000
25.0
21.7
2,500
21.0
20.0
17.9
2,000
15.1
15.4
14.7
15.0
1,500
10.0
1,000
588
510
393
358
384
5.0
500
310
-
0.0
2QCY14
3QCY14
4QCY14
1QCY15
2QCY15
3QCY15
Net Sales
EBITDA
EBITDA margin (%)
Source: Company, Angel Research
October 30, 2015
2
Ambuja Cements | 3QCY2015 Result Update
Exhibit 3: 3QCY2015 - Actual vs Angel estimates
(` cr)
Actual
Estimates
Variation (%)
Net sales
2,095
2,153
(2.7)
EBIDTA
310
319
(2.7)
EBIDTA Margin (%)
14.7
14.7
-
Net profit
154
220
(30.3)
Source: Company, Angel Research
Performance highlights
Top-line declines 4.2% yoy
ACEM’s standalone top-line for the quarter fell by 4.2% yoy to `2,095.2cr
(marginally below our estimate of `2.152.7cr), impacted by weak demand and
higher-than-expected fall in realization. The company registered a volume growth
of
1.7% yoy to
4.9mt, but the same was below our estimate of
4.95mt.
Realization/tonne was down by 5.8% yoy to `4,276 (below our estimate of
`4,345), mainly due to pricing pressure in its key markets of North and West
regions.
EBIDTA margin down 317bp yoy
ACEM’s EBIDTA margin fell by 317bp yoy to 14.7% impacted by fall in realization
and increase in other expenses (led by `40cr provision for DMF). Total operating
expenses were down by 0.4% yoy, led by 26.7% yoy fall in raw material costs and
4.6% yoy fall in power costs. Power costs were down mainly due to lower pet coke
and imported coal prices. The EBIDTA declined by 21.2% yoy to `310.1cr and was
in line with our estimate of `318.6cr. The EBITDA/tonne was down by 22.5% yoy
to `633 (in line with our estimate of `643).
Per-tonne analysis
For 3QCY2015, ACEM’s realization/tonne fell 5.8% on a yoy basis, (up 0.9%
qoq). Raw material cost/tonne declined 17.3%/26.6% yoy/qoq. Freight cost/tonne
declined by 0.6%/7.1% yoy/qoq to `1,130, led by fall in diesel prices. Power and
fuel (P&F) costs/tonne fell by 6.2%/0.2% yoy/qoq to `992. Other expenses/tonne
increased 7.1%/20.3% yoy/qoq to `1,021, mainly due to provision related to
DMF. The operating profit/tonne stood at `633, down by 22.5% yoy, led by fall in
realization and increase in other expenses.
Exhibit 4: Per tonne analysis
(`/tonne)
3QCY15
3QCY14
2QCY15
% chg (yoy)
% chg (qoq)
Realization/tonne
4,276
4,538
4,239
(5.8)
0.9
Raw-material cost/tonne
222
269
303
(17.3)
(26.6)
Power and fuel cost/tonne
992
1,058
994
(6.2)
(0.2)
Freight cost/tonne
1,130
1,138
1,216
(0.6)
(7.1)
Other costs/tonne
1,021
953
848
7.1
20.3
Operating costs/tonne
3,675
3,752
3,617
(2.1)
1.6
Operating Profit/tonne
633
816
653
(22.5)
(3.0)
Source: Company, Angel Research
October 30, 2015
3
Ambuja Cements | 3QCY2015 Result Update
Investment rationale
Lack of capacity addition impacting top-line growth
ACEM has seen a 6.9% yoy decline in its top-line during 9MCY2015, led by soft
demand and weak pricing environment in its key markets. There has been a
volume de-growth of 4.2% yoy during the same period. Going forward, we believe
the company will continue to lose market share as there is no visibility of new
capacity addition for the next two years. We expect ACEM’s volumes to grow at a
CAGR of 4.1% during CY2014-17. Lack of capacity addition would lead to
underperformance in terms of volume growth. However cement prices are
expected to remain strong on back of demand boost led by government spending
on infrastructure, housing and smart cities schemes.
Outlook and valuation
Going forward, we expect ACEM’s volume growth to remain under pressure due to
lack of capacity. However, we expect the top-line to register an 8.1% CAGR over
CY2014-17E. At the current market price, the stock is trading at an EV/tonne of
US$150 on CY2017E capacity and 10.6x EV/EBIDTA of CY2017E. We maintain
our Accumulate rating on the stock with a target price of `233 on 12.5x
EV/EBIDTA and EV/tonne of US$165 on CY2017E installed capacity.
October 30, 2015
4
Ambuja Cements | 3QCY2015 Result Update
Company Background
Swiss cement major, Holcim acquired a controlling stake in ACEM in 2005. In
India, the Holcim Group currently controls one-fifth of the total cement capacity
through ACEM and ACC. On a standalone basis, ACEM is the third largest cement
player in India with total capacity of 27mtpa. The company majorly focuses on
northern and western India, with no plants in southern India. Of its current total
capacity, 40% capacity is in the western, 38% in northern, 16% in eastern and
northeastern and 6% capacity is in the central region of the country.
October 30, 2015
5
Ambuja Cements | 3QCY2015 Result Update
Profit & loss statement (Standalone)
Y/E December (` cr)
CY2013
CY2014
CY2015E
CY2016E
CY2017E
Net Sales
9,087
9,911
10,166
11,564
12,556
Other operating income
90
67
74
60
60
Total operating income
9,176
9,978
10,241
11,624
12,616
% chg
(5.8)
8.7
2.6
13.5
8.5
Total Expenditure
7,509
8,050
8,532
9,382
10,018
Net Raw Materials
765
810
820
928
1,012
Other Mfg costs
2,063
2,265
2,337
2,544
2,699
Personnel
502
582
640
704
760
Other
4,179
4,393
4,736
5,205
5,547
EBITDA
1,668
1,928
1,708
2,242
2,598
% chg
(32.9)
15.6
(11.4)
31.3
15.9
(% of Net Sales)
18.4
19.5
16.8
19.4
20.7
Depreciation& Amortisation
490
510
545
594
643
EBIT
1,178
1,419
1,163
1,648
1,955
% chg
(38.7)
20.5
(18.0)
41.7
18.6
(% of Net Sales)
13.0
14.3
11.4
14.3
15.6
Interest & other Charges
65
64
71
76
76
Other Income
378
429
440
480
462
(% of PBT)
25
24
29
23
20
Recurring PBT
1,490
1,783
1,531
2,052
2,341
% chg
(31.7)
19.7
(14.1)
34.0
14.1
Extraordinary Expense/(Inc.)
(266)
-
-
-
-
PBT (reported)
1,756
1,783
1,531
2,052
2,341
Tax
460
287
505
677
772
(% of PBT)
26.2
16.1
33.0
33.0
33.0
PAT (reported)
1,295
1,496
1,026
1,375
1,568
ADJ. PAT
1,030
1,496
1,026
1,375
1,568
% chg
(34.7)
45.3
(31.4)
34.0
14.1
(% of Net Sales)
11.3
15.1
10.1
11.9
12.5
Basic EPS (`)
6.7
9.7
6.6
8.9
10.1
Fully Diluted EPS (`)
6.7
9.7
6.6
8.9
10.1
October 30, 2015
6
Ambuja Cements | 3QCY2015 Result Update
Balance sheet (Standalone)
Y/E December (` cr)
CY2013
CY2014
CY2015E
CY2016E
CY2017E
SOURCES OF FUNDS
Equity Share Capital
309
310
310
310
310
Preference Capital
-
-
-
-
-
Reserves& Surplus
9,176
9,793
10,188
10,716
11,319
Shareholders Funds
9,486
10,103
10,498
11,026
11,629
Total Loans
40
21
21
21
21
Deferred Tax Liability
564
589
589
589
589
Other Long term liabilities
18
18
18
18
18
Long term provisions
248
248
248
248
248
Total Liabilities
10,356
10,979
11,373
11,902
12,504
APPLICATION OF FUNDS
Gross Block
10,826
11,429
12,229
13,329
14,429
Less: Acc. Depreciation
4,764
5,202
5,747
6,341
6,985
Net Block
6,063
6,227
6,482
6,988
7,444
Capital Work-in-Progress
695
690
890
790
490
Other non current assets
-
289
289
289
289
Intangible assets
-
-
-
-
-
Investments
1,788
2,173
2,173
2,173
2,173
Long term loans and advances
647
647
647
647
647
Current Assets
3,771
3,874
3,660
3,963
4,587
Cash
2,341
2,458
1,971
1,986
2,445
Loans & Advances
208
254
287
332
383
Other
1,223
1,162
1,402
1,645
1,760
Current liabilities
2,609
2,922
2,769
2,948
3,126
Net Current Assets
1,163
952
892
1,014
1,461
Mis. Exp. not written off
-
-
-
-
-
Total Assets
10,356
10,979
11,373
11,902
12,504
October 30, 2015
7
Ambuja Cements | 3QCY2015 Result Update
Cash flow statement (Standalone)
Y/E December (` cr)
CY2013
CY2014
CY2015E CY2016E CY2017E
Profit before tax
1,756
1,783
1,531
2,052
2,341
Depreciation
490
510
545
594
643
(Inc)/Dec in Working Capital
(150)
328
(427)
(108)
12
Add: Interest expenses
65
64
71
76
76
Less: Other income
378
429
440
480
462
Less: Direct taxes paid
460
287
505
677
772
Cash Flow from Operations
1,322
1,969
776
1,457
1,838
(Inc)/ Dec in Fixed Assets
(885)
(598)
(1,000)
(1,000)
(800)
(Inc)/ Dec in Investments
(133)
(384)
-
-
-
Other income
378
429
440
480
462
Cash Flow from Investing
(640)
(553)
(560)
(520)
(338)
Issue of Equity
42
52
-
-
-
Inc./(Dec.) in loans
(2)
(20)
-
-
-
Dividend Paid (Incl. Tax)
651
921
632
846
965
Others
(16)
409
71
76
76
Cash Flow from Financing
(595)
(1,298)
(703)
(922)
(1,041)
Inc./(Dec.) in Cash
88
117
(487)
15
459
Opening Cash balances
2,253
2,341
2,458
1,971
1,986
Closing Cash balances
2,341
2,458
1,972
1,986
2,445
October 30, 2015
8
Ambuja Cements | 3QCY2015 Result Update
Key ratios
Y/E December
CY2013
CY2014
CY2015E
CY2016E
CY2017E
Valuation Ratio (x)
P/E (on FDEPS)
31.1
21.4
31.3
23.3
20.5
P/CEPS
17.9
16.0
20.4
16.3
14.5
P/BV
3.4
3.2
3.1
2.9
2.8
Dividend yield (%)
1.7
2.4
1.7
2.2
2.5
EV/Sales
3.1
2.8
2.7
2.4
2.2
EV/EBITDA
16.7
14.2
16.2
12.4
10.6
EV / Total Assets
2.7
2.5
2.4
2.3
2.2
Per Share Data (`)
EPS (Basic)
6.7
9.7
6.6
8.9
10.1
EPS (fully diluted)
6.7
9.7
6.6
8.9
10.1
Cash EPS
11.5
12.9
10.1
12.7
14.3
DPS
3.6
5.0
3.4
4.6
5.2
Book Value
61.4
65.2
67.7
71.1
75.0
Dupont Analysis
EBIT margin
12.8
14.2
11.4
14.2
15.5
Tax retention ratio
73.8
83.9
67.0
67.0
67.0
Asset turnover (x)
1.2
1.2
1.1
1.2
1.3
ROIC (Post-tax)
11.3
14.4
8.7
11.4
13.1
Returns (%)
ROCE (Pre-tax)
11.8
13.3
10.4
14.2
16.0
Angel ROIC (Pre-tax)
16.6
18.7
14.2
18.7
20.9
ROE
11.3
15.3
10.0
12.8
13.8
Turnover ratios (x)
Asset Turnover (Gross Block)
0.9
0.9
0.9
0.9
0.9
Inventory / Sales (days)
38
33
35
38
39
Receivables (days)
9
8
9
9
9
Payables (days)
129
125
122
111
111
WC cycle (ex-cash) (days)
(50)
(49)
(46)
(32)
(28)
Solvency ratios (x)
Net debt to equity
(0.2)
(0.2)
(0.2)
(0.2)
(0.2)
Net debt to EBITDA
(1.4)
(1.3)
(1.1)
(0.9)
(0.9)
Interest Coverage (EBIT / Int.)
18.1
22.0
16.3
21.6
25.6
October 30, 2015
9
Ambuja Cements | 3QCY2015 Result Update
Research Team Tel: 022 - 39357800
DISCLAIMER
Angel Broking Private Limited (hereinafter referred to as “Angel”) is a registered Member of National Stock Exchange of India Limited,
Bombay Stock Exchange Limited and Metropolitan Stock Exchange of India Limited. It is also registered as a Depository Participant with
CDSL and Portfolio Manager with SEBI. It also has registration with AMFI as a Mutual Fund Distributor. Angel Broking Private Limited is
a registered entity with SEBI for Research Analyst in terms of SEBI (Research Analyst) Regulations, 2014 vide registration number
INH000000164. Angel or its associates has not been debarred/ suspended by SEBI or any other regulatory authority for accessing
/dealing in securities Market. Angel or its associates including its relatives/analyst do not hold any financial interest/beneficial
ownership of more than 1% in the company covered by Analyst. Angel or its associates/analyst has not received any compensation /
managed or co-managed public offering of securities of the company covered by Analyst during the past twelve months. Angel/analyst
has not served as an officer, director or employee of company covered by Analyst and has not been engaged in market making activity
of the company covered by Analyst.
This document is solely for the personal information of the recipient, and must not be singularly used as the basis of any investment
decision. Nothing in this document should be construed as investment or financial advice. Each recipient of this document should
make such investigations as they deem necessary to arrive at an independent evaluation of an investment in the securities of the
companies referred to in this document (including the merits and risks involved), and should consult their own advisors to determine
the merits and risks of such an investment.
Reports based on technical and derivative analysis center on studying charts of a stock's price movement, outstanding positions and
trading volume, as opposed to focusing on a company's fundamentals and, as such, may not match with a report on a company's
fundamentals.
The information in this document has been printed on the basis of publicly available information, internal data and other reliable
sources believed to be true, but we do not represent that it is accurate or complete and it should not be relied on as such, as this
document is for general guidance only. Angel Broking Pvt. Limited or any of its affiliates/ group companies shall not be in any way
responsible for any loss or damage that may arise to any person from any inadvertent error in the information contained in this report.
Angel Broking Pvt. Limited has not independently verified all the information contained within this document. Accordingly, we cannot
testify, nor make any representation or warranty, express or implied, to the accuracy, contents or data contained within this document.
While Angel Broking Pvt. Limited endeavors to update on a reasonable basis the information discussed in this material, there may be
regulatory, compliance, or other reasons that prevent us from doing so.
This document is being supplied to you solely for your information, and its contents, information or data may not be reproduced,
redistributed or passed on, directly or indirectly.
Neither Angel Broking Pvt. Limited, nor its directors, employees or affiliates shall be liable for any loss or damage that may arise from
or in connection with the use of this information.
Note: Please refer to the important ‘Stock Holding Disclosure' report on the Angel website (Research Section). Also, please refer to the
latest update on respective stocks for the disclosure status in respect of those stocks. Angel Broking Pvt. Limited and its affiliates may
have investment positions in the stocks recommended in this report.
Disclosure of Interest Statement
Ambuja Cements
1. Analyst ownership of the stock
No
2. Angel and its Group companies ownership of the stock
No
3. Angel and its Group companies' Directors ownership of the stock
No
4. Broking relationship with company covered
No
Note: We have not considered any Exposure below ` 1 lakh for Angel, its Group companies and Directors
Ratings (Based on expected returns
Buy (> 15%)
Accumulate (5% to 15%)
Neutral (-5 to 5%)
over 12 months investment period):
Reduce (-5% to -15%)
Sell (< -15)
October 30, 2015
10