3QFY2016 Result Update | Auto Ancillary
February 4, 2016
Amara Raja Batteries
BUY
CMP
`863
Performance Highlights
Target Price
`1,039
Y/E March (` cr)
3QFY16 3QFY15
% chg (yoy) 2QFY16
% chg (qoq)
Investment Period
12 Months
Net Sales
1,225
1,060
15.6
1,158
5.8
EBITDA
229
173
32.0
199
15.1
Stock Info
EBITDA Margin (%)
18.7
16.3
240 bp
17.2
150 bp
Sector
Auto Ancillary
Adj. PAT
136
102
33.1
123
11.1
Source: Company, Angel Research
Market Cap (` cr)
14,732
Net Debt (` cr)
(148)
Results ahead of estimates: Amara Raja Batteries Ltd (ARBL)’s 3QFY2016 results
Beta
0.9
have come in ahead of our estimates, driven by a strong operating performance.
52 Week High / Low
1,132/773
On the expected lines, the company’s top-line grew by a healthy 16% yoy to
`1,225cr. The Automotive segment, forming about 55% of revenues, grew in
Avg. Daily Volume
35,585
double digits on back of market share gains in both the OEM as well as the
Face Value (`)
1
replacement segment. The Industrial segment also reported a double-digit
BSE Sensex
24,223
growth, led by the telecom sub-segment (telecom forms about 50% of the overall
Nifty
7,362
Industrial segment’s revenues). Given soft lead prices and a better product mix,
Reuters Code
AMAR.BO
the company’s margins improved by 240bp yoy to 18.7%, coming in higher than
Bloomberg Code
AMRJ@IN
our estimate of 17.4%. The margins for the quarter are the highest ever in the last
six years. Given the robust operating performance, the net profit at `136cr, came
in ahead of our estimate of `126cr.
Shareholding Pattern (%)
Promoters
52.1
Outlook and Valuation: ARBL is likely to continue gaining market share in the
MF / Banks / Indian Fls
21.3
automotive battery segment. The strategy followed by automotive OEMs of
FII / NRIs / OCBs
12.1
sourcing from multiple vendors as against having a single vendor is likely to
Indian Public / Others
14.5
benefit ARBL. Further, with the company’s strengthening distribution network in
the Western and Eastern markets, we expect replacement sales to grow in strong
double digits, going forward. We also expect the Industrial segment growth to be
Abs. (%)
3m 1yr
3yr
in healthy double digits over FY2017-2018, given that the telecom players are
Sensex
(8.9)
(16.5)
22.5
resorting to aggressive network expansion, and also with ARBL entering tubular
Amara Raja
(1.5)
(5.3)
186.5
battery manufacturing. We expect ARBL to record a healthy top-line CAGR of 17%
over FY2015 to FY2017. Also, given the softness in lead prices, margins are
expected to remain at elevated levels. We expect ARBL to clock 24% earnings
3-year price chart
CAGR over the next two years. We maintain our positive view on the stock and
1,200
reiterate our Buy rating on the stock with a target price of `1,039 (based on 28x
1,000
FY2017 earnings).
800
600
Key financials (Standalone)
400
Y/E March (` cr)
FY2014
FY2015
FY2016E
FY2017E
200
Net Sales
3,452
4,230
4,790
5,748
0
% chg
16.7
22.5
13.2
20.0
Net Profit
371
418
516
634
% chg
25.5
12.6
23.4
22.9
Source: Company, Angel Research
EBITDA (%)
16.7
17.2
18.0
17.7
EPS (`)
21.7
24.5
30.2
37.1
P/E (x)
39.7
35.3
28.6
23.2
P/BV (x)
10.8
8.7
6.9
5.6
RoE (%)
27.2
24.6
24.2
23.9
RoCE (%)
36.6
34.1
34.3
33.6
Bharat Gianani
EV/Sales (x)
4.2
3.4
3.1
2.5
022-3935 7800 Ext: 6817
EV/EBITDA (x)
25.2
20.0
17.0
14.1
Source: Company, Angel Research; Note: CMP as of February 3, 2016
Please refer to important disclosures at the end of this report
1
Amara Raja Batteries | 3QFY2016 Result Update
Exhibit 1: Quarterly financial performance (Standalone)
Y/E March (` cr)
3QFY16
3QFY15
% chg (yoy)
2QFY16
% chg (qoq)
9MFY16
9MFY15
% chg (yoy)
Net Sales
1,225
1,060
15.6
1,158
5.8
3,521
3,149
11.8
Consumption of RM
754
696
8.4
742
1.7
2,231
2,086
7.0
(% of Sales)
61.6
65.7
64.0
63.4
66.2
Staff Costs
62
49
24.8
58
6.5
176
145
21.5
(% of Sales)
5.0
4.7
5.0
5.0
4.6
Other Expenses
180
141
27.7
160
12.9
488
390
25.2
(% of Sales)
14.7
13.3
13.8
13.9
12.4
Total Expenditure
997
886
12.4
960
3.8
2,895
2,620
10.5
Operating Profit
229
173
32.0
199
15.1
626
529
18.4
OPM (%)
18.7
16.3
17.2
17.8
16.8
Interest
0
0
466.7
0
750.0
0
0
266.7
Depreciation
36
29
23.4
34
3.6
103
96
6.5
Other Income
11
12
(2.5)
12
(2.8)
36
28
26.5
PBT (incl. Extr. Items)
204
156
30.9
176
15.9
559
461
21.4
(% of Sales)
16.7
14.7
15.2
15.9
14.6
Provision for Taxation
68
54
26.8
53
27.0
178
152
26.5
(% of PBT)
33.3
34.4
30.4
31.9
33.0
Exceptional items
-
-
-
-
-
Reported PAT
136
102
33.1
123
11.1
381
309
23.4
Adj PAT
136
102
33.1
123
11.1
381
309
23.4
Adj. PATM
11.1
9.7
10.6
10.8
9.8
Equity capital (cr)
17.1
17.1
17.1
17.1
17.1
Reported EPS (`)
8.0
6.0
33.1
7.2
11.1
22.3
18.1
23.4
Source: Company, Angel Research
Exhibit 2: 3QFY2016 - Actual vs Angel estimates
Y/E March (` cr)
Actual
Estimates
Variation (%)
Net Sales
1,225
1,216
0.8
EBITDA
229
212
7.9
EBITDA margin (%)
18.7
17.4
130 bp
Adj. PAT
136
126
8.4
Source: Company, Angel Research
Top-line maintains double-digit growth: ARBL maintained its healthy double-digit
revenue growth momentum, reporting a 16% yoy growth in 3QFY2016. The
company continued to gain market share in the automotive segment which
contributes by ~55% of the top-line. Increased supplies to OEM customers and
increased penetration in the after-market space enabled the company to gain
market share in both the OEM and the replacement segments. The Industrial
segment (contributing ~45% of revenues) also grew in double digits led by the
telecom sub-segment (telecom forms 50% of the company’s Industrial division’s
revenues). In 9MFY2016, the company’s revenues have grown by 12% yoy to
`3,521cr.
February 4, 2016
2
Amara Raja Batteries | 3QFY2016 Result Update
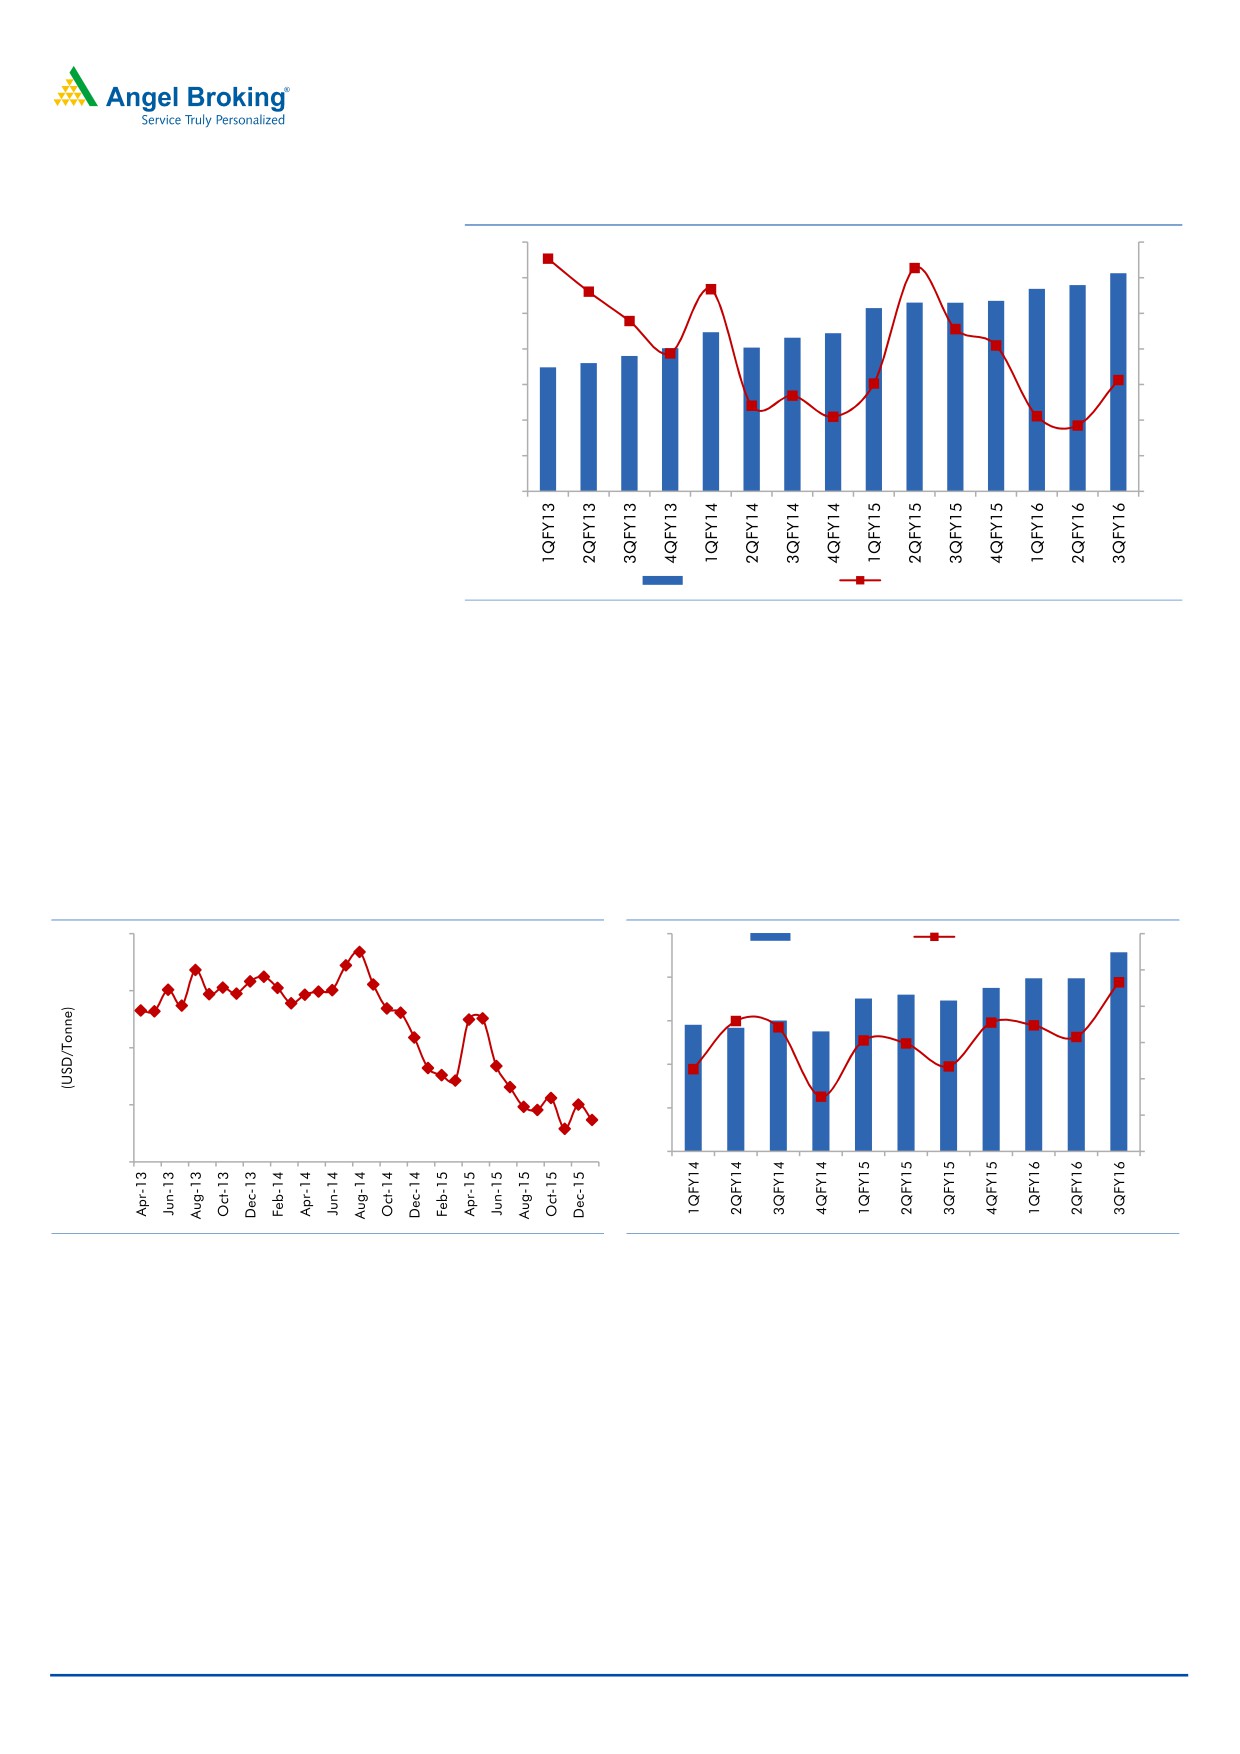
Exhibit 3: Double digit top-line growth continues
1,400
35
1,200
30
1,000
25
800
20
600
15
400
10
200
5
0
0
Net sales (` cr)
% yoy growth
Source: Company, Angel Research
Soft lead prices and a better product mix boost operating performance: In
3QFY2016, ARBL posted a record margin of 18.7%. The margins are the highest
in a quarter in the last six years. The operating margins improved 240bp yoy and
150bp on a sequential basis. Soft lead prices coupled with a better product mix
(higher sales in automotive after-market segment) boosted the operating margins.
Raw material cost as a percentage of sales dipped 410bp yoy to 61.6%, given the
softness in the price of lead, which is its key raw material.
Exhibit 4: Average lead price trend
Exhibit 5: Soft lead prices boost EBITDA margin
2,300
250
EBIDTA (` cr)
Margin (%)
20
19
200
2,100
18
150
17
1,900
100
16
1,700
50
15
14
0
1,500
Source: Company, Angel Research
Source: Company, Angel Research
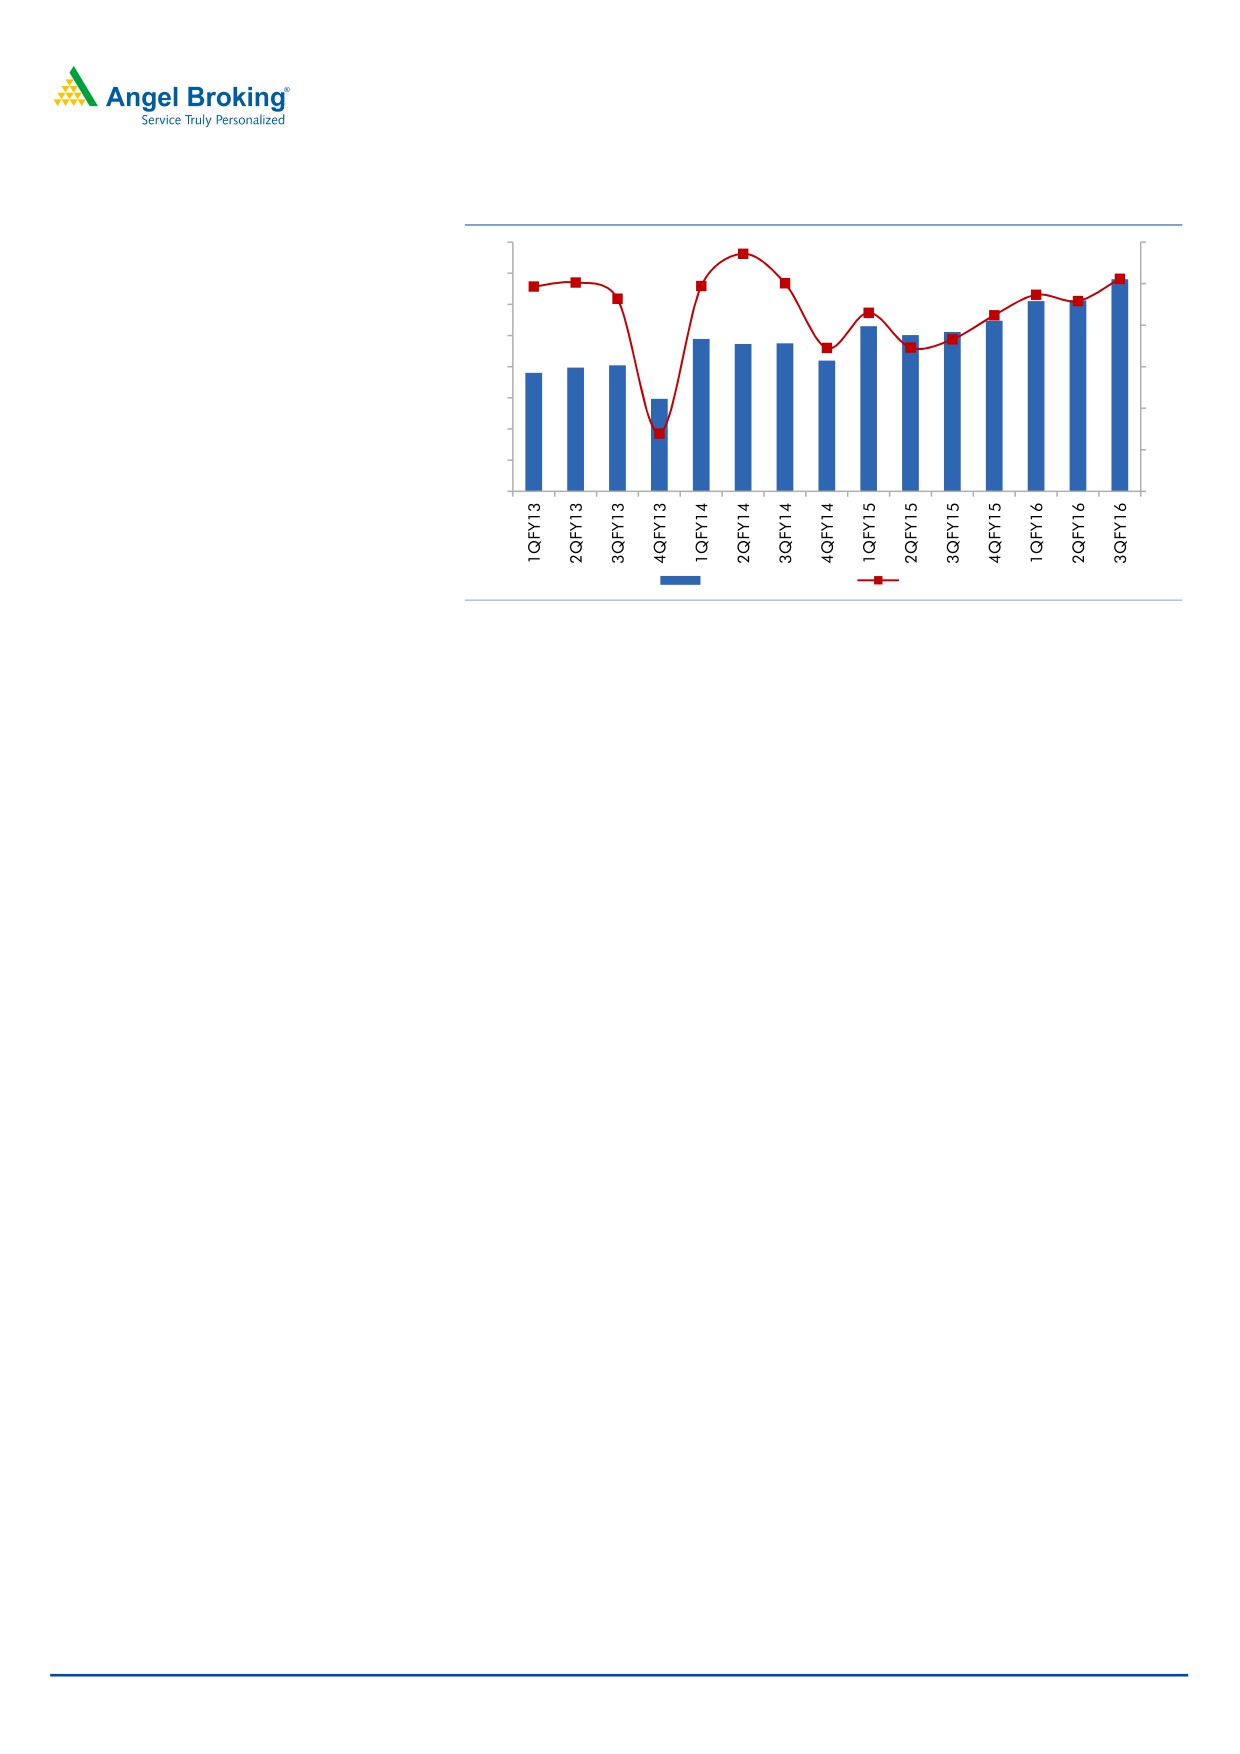
Net profit grows strongly on back of healthy top-line growth and margin
improvement: ARBL’s adjusted net profit for the quarter was ahead of our estimate
given the strong operating performance. The net profit grew strongly by 33% yoy
to `136cr, beating our estimate of `126cr.
February 4, 2016
3
Amara Raja Batteries | 3QFY2016 Result Update
Exhibit 6: Strong bottom-line growth
160
12
140
11
120
10
100
80
9
60
8
40
7
20
0
6
Net Profit (` cr)
Margin (%)
Source: Company, Angel Research
February 4, 2016
4
Amara Raja Batteries | 3QFY2016 Result Update
Investment arguments
Demand scenario for automotive and industrial batteries to remain positive in
the long run: We expect growth traction in the automotive battery segment to
continue over the next two years. The automotive OEM segment is likely to
witness strong growth over the next two years on back of higher income levels,
subdued fuel prices and further easing of interest rates. Also, robust
automotive replacement demand is likely to maintain growth momentum.
Further, given the economic recovery, the industrial segment (railways, UPS
and telecom) is also poised to register double-digit growth over the next two
years.
Likely to outpace industry growth on increased sourcing by automotive OEM
segment: ARBL has outpaced the battery industry over the last four to five
years. Penetration into the new automotive OEM segment has led to market
share gains for ARBL. OEM customers both in the 4W and 2W segments have
strategically opted to source from ARBL in order to follow multiple sourcing
and reduce dependence on a single supplier. Also, by strengthening its
distribution reach in the Eastern and Western markets, ARBL is likely to gain
market share in the automotive replacement segment as well. We believe
ARBL would continue to gain market share in the near term and expect it to
post a top-line CAGR of 17% over FY2015-2017.
Outlook and valuation
ARBL is likely to continue gaining market share in the automotive battery segment.
The strategy followed by automotive OEMs of sourcing from multiple vendors as
against having a single vendor is likely to benefit ARBL. Further, with the
company’s strengthening distribution network in the Western and Eastern markets,
we expect replacement sales to grow in strong double digits, going forward. We
also expect the Industrial segment growth to be in healthy double digits over
FY2017-2018, given that the telecom players are resorting to aggressive network
expansion, and also with ARBL entering tubular battery manufacturing. We expect
ARBL to record a healthy top-line CAGR of 17% over FY2015 to FY2017. Also,
given the softness in lead prices, margins are expected to remain at elevated
levels. We expect ARBL to clock 24% earnings CAGR over the next two years. We
maintain our positive view on the stock and reiterate our Buy rating on the stock
with a target price of `1,039 (based on 28x FY2017 earnings).
Company background
Amara Raja Batteries Ltd (ARBL) is a leading automobile and industrial battery
manufacturer in India. It is the second largest lead acid battery manufacturer
having a market share of about 35% in the organized battery industry. ARBL has a
technological tie-up with US based Johnson Controls, which also holds 26% stake
in it. The Automotive and Industrial battery segments each accounted for ~50% of
the company's total revenue in FY2015.
February 4, 2016
5
Amara Raja Batteries | 3QFY2016 Result Update
Profit and loss statement (Standalone)
Y/E March (` cr)
FY2012
FY2013
FY2014
FY2015
FY2016E
FY2017E
Total operating income
2,375
2,959
3,452
4,230
4,790
5,748
% chg
34.4
24.6
16.7
22.5
13.2
20.0
Total expenditure
2,017
2,508
2,876
3,502
3,928
4,732
Net raw material costs
1,598
1,991
2,283
2,776
3,042
3,696
Employee expenses
100
126
158
195
238
278
Other expenses
319
390
435
531
648
758
EBITDA
357
451
575
728
862
1,016
% chg
38.4
26.1
27.6
26.5
18.5
17.7
(% of total op. income)
15.1
15.2
16.7
17.2
18.0
17.7
Depreciation & amort.
46
66
65
134
153
176
EBIT
323
431
541
617
759
920
% chg
45.4
33.7
25.5
14.1
23.0
21.1
(% of total op. income)
13.6
14.6
15.7
14.6
15.9
16.0
Interest and other charges
4
0
1
0
1
1
Other income
12
47
30
24
50
80
Recurring PBT
319
431
541
617
759
919
% chg
44.5
35.3
25.4
14.2
22.9
21.1
Extraordinary items
-
(9)
(4)
(7)
PBT (reported)
319
422
537
610
759
919
Tax
104
135
169
199
243
285
(% of PBT)
32.5
31.4
31.3
32.2
32.0
31.0
PAT (reported)
215
287
367
411
516
634
ADJ. PAT
215
296
371
418
516
634
% chg
45.7
37.6
25.5
12.6
23.4
22.9
(% of total op. income)
9.1
10.0
10.8
9.9
10.8
11.0
Adj. EPS (`)
12.6
17.3
21.7
24.5
30.2
37.1
% chg
45.7
37.6
25.5
12.6
23.4
22.9
February 4, 2016
6
Amara Raja Batteries | 3QFY2016 Result Update
Balance sheet statement (Standalone)
Y/E March (` cr)
FY2012 FY2013 FY2014 FY2015 FY2016E FY2017E
SOURCES OF FUNDS
Equity share capital
17
17
17
17
17
17
Reserves & surplus
806
1,043
1,346
1,682
2,111
2,637
Shareholders’ Funds
823
1,060
1,363
1,700
2,128
2,654
Total loans
84
87
84
74
50
50
Deferred tax liability
22
20
30
37
37
37
Other long term liabilities
-
-
-
-
-
-
Total Liabilities
930
1,166
1,477
1,811
2,215
2,741
APPLICATION OF FUNDS
Gross block
621
680
996
1,441
2,041
2,341
Less: Acc. depreciation
267
321
372
497
650
826
Net Block
355
359
623
944
1,391
1,516
Capital work-in-progress
32
103
145
86
100
100
Investments
16
16
16
16
22
25
Other noncurrent assets
0
0
0
0
0
0
Current assets
949
1,292
1,199
1,341
1,376
1,910
Cash
229
411
295
222
139
419
Loans & advances
131
201
113
140
157
188
Other
589
680
792
980
1,080
1,302
Current liabilities
422
604
506
578
674
809
Net current assets
527
688
693
764
701
1,100
Total Assets
930
1,166
1,477
1,811
2,215
2,741
February 4, 2016
7
Amara Raja Batteries | 3QFY2016 Result Update
Cash flow statement (Standalone)
Y/E March (` cr)
FY2012 FY2013 FY2014 FY2015 FY2016E FY2017E
Profit before tax
319
422
537
610
759
919
Depreciation
43
55
51
125
153
176
Change in working capital
55
21
(121)
(143)
(20)
(119)
Others
2
(2)
11
5
-
-
Direct taxes paid
(104)
(135)
(169)
(199)
(243)
(285)
Cash Flow from Operations
314
360
308
397
649
691
(Inc.)/Dec. in fixed assets
(76)
(130)
(357)
(388)
(614)
(300)
(Inc.)/Dec. in investments
(0)
-
-
-
(6)
(3)
Cash Flow from Investing
(76)
(130)
(357)
(388)
(620)
(303)
Issue of equity
-
-
-
-
-
-
Inc./(Dec.) in loans
(11)
3
(3)
(10)
(24)
-
Dividend paid (Incl. Tax)
(38)
(50)
(65)
(72)
(88)
(108)
Others
0
0
(0)
(0)
-
-
Cash Flow from Financing
(48)
(47)
(68)
(82)
(112)
(108)
Inc./(Dec.) in cash
189
182
(117)
(72)
(83)
280
Opening Cash balances
40
229
412
295
222
140
Closing Cash balances
229
412
295
222
140
419
February 4, 2016
8
Amara Raja Batteries | 3QFY2016 Result Update
Key ratios
Y/E March
FY2012
FY2013
FY2014
FY2015
FY2016E
FY2017E
Valuation Ratio (x)
P/E (on FDEPS)
68.6
49.8
39.7
35.3
28.6
23.2
P/CEPS
56.4
40.7
33.8
26.7
22.0
18.2
P/BV
17.9
13.9
10.8
8.7
6.9
5.6
Dividend yield (%)
0.2
0.3
0.4
0.4
0.6
0.7
EV/Sales
6.1
4.9
4.2
3.4
3.1
2.5
EV/EBITDA
40.8
31.9
25.2
20.0
17.0
14.1
EV / Total Assets
15.7
12.3
9.8
8.1
6.6
5.2
Per Share Data (`)
EPS (Basic)
12.6
17.3
21.7
24.5
30.2
37.1
EPS (fully diluted)
12.6
17.3
21.7
24.5
30.2
37.1
Cash EPS
15.3
21.2
25.5
32.3
39.2
47.4
DPS
1.9
2.5
3.2
3.6
5.1
6.3
Book Value
48.2
62.0
79.8
99.5
124.6
155.4
Returns (%)
ROCE (Pre-tax)
34.7
37.0
36.6
34.1
34.3
33.6
Angel ROIC (Pre-tax)
46.1
57.1
45.8
38.9
36.6
39.6
ROE
26.1
27.9
27.2
24.6
24.2
23.9
Turnover ratios (x)
Asset Turnover (Gross Block)
3.8
4.3
3.5
2.9
2.3
2.5
Inventory / Sales (days)
41.0
36.1
35.4
36.1
34.9
35.4
Receivables (days)
49.1
47.0
47.9
47.8
46.8
46.8
Payables (days)
64.9
74.5
53.5
49.8
51.4
51.4
WC cycle (ex-cash) (days)
45.8
34.2
42.1
46.7
42.8
43.2
Solvency ratios (x)
Net debt to equity
(0.2)
(0.3)
(0.2)
(0.1)
(0.0)
(0.1)
Net debt to EBITDA
(0.4)
(0.7)
(0.4)
(0.2)
(0.1)
(0.4)
Interest Coverage (EBIT / Int.)
80.5
1603.1
753.9
2572.4
949.2
920.0
February 4, 2016
9
Amara Raja Batteries | 3QFY2016 Result Update
Research Team Tel: 022 - 39357800
DISCLAIMER
Angel Broking Private Limited (hereinafter referred to as “Angel”) is a registered Member of National Stock Exchange of India Limited,
Bombay Stock Exchange Limited and Metropolitan Stock Exchange of India Limited. It is also registered as a Depository Participant with
CDSL and Portfolio Manager with SEBI. It also has registration with AMFI as a Mutual Fund Distributor. Angel Broking Private Limited is
a registered entity with SEBI for Research Analyst in terms of SEBI (Research Analyst) Regulations, 2014 vide registration number
INH000000164. Angel or its associates has not been debarred/ suspended by SEBI or any other regulatory authority for accessing
/dealing in securities Market. Angel or its associates including its relatives/analyst do not hold any financial interest/beneficial
ownership of more than 1% in the company covered by Analyst. Angel or its associates/analyst has not received any compensation /
managed or co-managed public offering of securities of the company covered by Analyst during the past twelve months. Angel/analyst
has not served as an officer, director or employee of company covered by Analyst and has not been engaged in market making activity
of the company covered by Analyst.
This document is solely for the personal information of the recipient, and must not be singularly used as the basis of any investment
decision. Nothing in this document should be construed as investment or financial advice. Each recipient of this document should
make such investigations as they deem necessary to arrive at an independent evaluation of an investment in the securities of the
companies referred to in this document (including the merits and risks involved), and should consult their own advisors to determine
the merits and risks of such an investment.
Reports based on technical and derivative analysis center on studying charts of a stock's price movement, outstanding positions and
trading volume, as opposed to focusing on a company's fundamentals and, as such, may not match with a report on a company's
fundamentals.
The information in this document has been printed on the basis of publicly available information, internal data and other reliable
sources believed to be true, but we do not represent that it is accurate or complete and it should not be relied on as such, as this
document is for general guidance only. Angel Broking Pvt. Limited or any of its affiliates/ group companies shall not be in any way
responsible for any loss or damage that may arise to any person from any inadvertent error in the information contained in this report.
Angel Broking Pvt. Limited has not independently verified all the information contained within this document. Accordingly, we cannot
testify, nor make any representation or warranty, express or implied, to the accuracy, contents or data contained within this document.
While Angel Broking Pvt. Limited endeavors to update on a reasonable basis the information discussed in this material, there may be
regulatory, compliance, or other reasons that prevent us from doing so.
This document is being supplied to you solely for your information, and its contents, information or data may not be reproduced,
redistributed or passed on, directly or indirectly.
Neither Angel Broking Pvt. Limited, nor its directors, employees or affiliates shall be liable for any loss or damage that may arise from
or in connection with the use of this information.
Note: Please refer to the important ‘Stock Holding Disclosure' report on the Angel website (Research Section). Also, please refer to the
latest update on respective stocks for the disclosure status in respect of those stocks. Angel Broking Pvt. Limited and its affiliates may
have investment positions in the stocks recommended in this report.
Disclosure of Interest Statement
Amara Raja Batteries
1. Analyst ownership of the stock
No
2. Angel and its Group companies ownership of the stock
No
3. Angel and its Group companies' Directors ownership of the stock
No
4. Broking relationship with company covered
No
Note: We have not considered any Exposure below ` 1 lakh for Angel, its Group companies and Directors
Ratings (Based on expected returns
Buy (> 15%)
Accumulate (5% to 15%)
Neutral (-5 to 5%)
over 12 months investment period):
Reduce (-5% to -15%)
Sell (< -15)
February 4, 2016
10