4QFY2017 Result Update | Pharma
May 30, 2017
Alkem Laboratories
BUY
CMP
`1,868
Performance Highlights
Target Price
`2,161
Y/E March (` cr)
4QFY17 4QFY16 % chg (yoy) FY17
FY16
% chg (yoy)
Investment Period
12 Months
Net Sales
1,251
1,149
9.0
5,853
4,992
17.2
EBITDA
149
156
(4.2)
999
848
17.8
Stock Info
EBITDA Margin (%)
11.9
13.6
-164 bp
17.1
17.0
7 bp
Sector
Pharma
Adj. PAT
137
87
58.6
892
673
32.6
Market Cap (` cr)
22,331
Source: Company, Angel Research
Net Debt (` cr)
(23)
Slower growth in domestic and US business: Alkem reported yoy revenue grew of
Beta
0.3
9% in 4QFY17. Domestic revenue grew by 7% yoy to `856cr while exports grew
52 Week High / Low
2,238/1,200
by 14.5% to `385cr. US revenue grew by 19.4% yoy to `291cr. Other exports
Avg. Daily Volume
67,071
were flat at `95cr. Domestic business contributed 69% of the total revenue during
Face Value (`)
2
the quarter. Exports mix remains unchanged (vs. 3QFY17), with US contribution
BSE Sensex
31,159
remaining at 23% of total revenues in 4QFY17.
Nifty
9,625
Reuters Code
ALKE.BO
Gross margins declined by ~35bps on qoq basis but improved by 67bps on yoy
Bloomberg Code
ALKEM IN
basis. EBITDA declined by 4.2% yoy at `149cr vs. `156r in 4QFY16. EBITDA
margins were at 11.9% vs. 13.6% in 4QFY16 and 18.1% in 3QFY17. The decline
in EBITDA margins was largely on account of higher employee cost and increased
Shareholding Pattern (%)
R&D expenditure. PAT was at `137cr in 4QFY17 showing a yoy growth of 58.6%,
Promoters
67.0
due to the lower tax in the quarter.
MF / Banks / Indian Fls
2.5
FII / NRIs / OCBs
6.7
Outlook and valuation: The stock at the CMP of `1,868 is available at P/E of
Indian Public / Others
23.8
18.6x of FY19E EPS of `101. We have cut our EPS estimates by ~5% due to the
recent slowdown in domestic business, likely disruption in the pharma industry
due to higher GST and pricing pressure in the US. We expect company to report
Abs. (%)
3m 6m 1yr
CAGR of 15.8% and 15.3% in top line and bottom line respectively in next two
Sensex
8.5
17.0
16.9
years. The company is expected to witness improvement in its return ratios owing
Alkem
(12.8)
10.1
48.4
to the rising profitability of US business. Moreover Alkem’s all manufacturing
facilities are current with USFDA which gives confidence that company will deliver
3-year price chart
strong results over next two years. Considering these factors, we rate Alkem Buy
2,500
with price target of `2,161 based on 21.5x of FY19E EPS.
2,000
Key financials (Consolidated)
Y/E March (` cr)
FY15
FY16
FY17
FY18E
FY19E
1,500
Net Sales
3,743
4,992
5,853
6,901
7,850
1,000
% chg
19.7
33.3
17.2
17.9
13.8
500
Net Profit
392
684
905
1,016
1,202
0
% chg
(10.0)
71.9
32.6
13.9
18.3
OPM (%)
11.3
17.0
17.1
18.4
19.1
EPS (`)
32.8
56.3
74.6
85.0
100.5
Source: Company, Angel Research
P/E (x)
57.0
33.2
25.0
22.0
18.6
P/BV (x)
7.4
6.4
5.3
4.4
3.7
RoE (%)
13.1
19.2
21.1
20.2
20.1
RoCE (%)
8.0
17.6
18.0
19.7
20.0
EV/Sales (x)
6.0
4.4
3.8
3.2
2.8
Shrikant Akolkar
EV/EBITDA (x)
53.2
25.8
22.2
17.5
14.7
022-3935 7800 Ext: 6846
Source: Company, Angel Research; Note: CMP as of May 30, 2017
Please refer to important disclosures at the end of this report
1
Alkem Laboratories |4QFY2017 Result Update
Exhibit 1: Quarterly financial performance
Y/E March (` cr)
4QFY17
4QFY16
% chg (yoy) 3QFY17
% chg (qoq) FY17 FY16
% chg (yoy)
Net sales
1,251
1,149
9.0
1,482
(15.6)
5,853
4,992
17.2
Consumption of RM
461
431
7.0
540
(14.7)
2,222
1,961
13.3
(% of Sales)
36.8
37.5
36.5
38.0
39.3
Staff costs
229
191
19.3
271
(15.7)
1004
917
9.5
(% of Sales)
18.3
16.7
18.3
17.2
18.4
Other expenses
413
371
11.4
402
2.6
1628
1265
28.7
(% of Sales)
33.0
32.3
27.1
27.8
25.3
Total Expenditure
1,102
993
11.0
1,214
(9.2)
4,854
4,143
17.1
Operating Profit
149
156
(4.2)
268
(44.3)
999
848
17.8
OPM
11.93
13.57
18.1
17.1
17.0
Depreciation
26
24
9.2
26
0.0
101
101
0.6
Other income
25
104
(76.2)
25
(3.1)
112
165
(31.9)
Finance cost
11
10
13.8
12
(2.3)
45
67
(32.7)
PBT (excl. Extr. Items)
136
225
(39.6)
255
(46.7)
965
845
14.1
Extr. Income/(Expense)
0
0
0
0
0
PBT (incl. Extr. Items)
136
225
(39.6)
255
(46.7)
965
845
14.1
(% of Sales)
10.9
19.6
17.2
16.5
16.9
Tax
(1)
139
(100.7)
19
(104.7)
60
161
(62.7)
(% of PBT)
-0.7
61.6
7.5
6.2
19.0
Reported PAT
137
87
58.3
236
(42.0)
905
684
32.2
Minority interest and Associate Company
(0)
0
(1,600.0)
3
(110.5)
12
11
8.9
Adj PAT
137
87
58.6
233
(41.2)
892
673
32.6
Adj. PATM
11.0
7.5
15.7
15.2
13.5
Equity capital (cr)
24
24
24
24
24
Adjusted EPS (`)
11
7
58.6
20
(41.2)
75
56
32.6
Source: Company, Angel Research
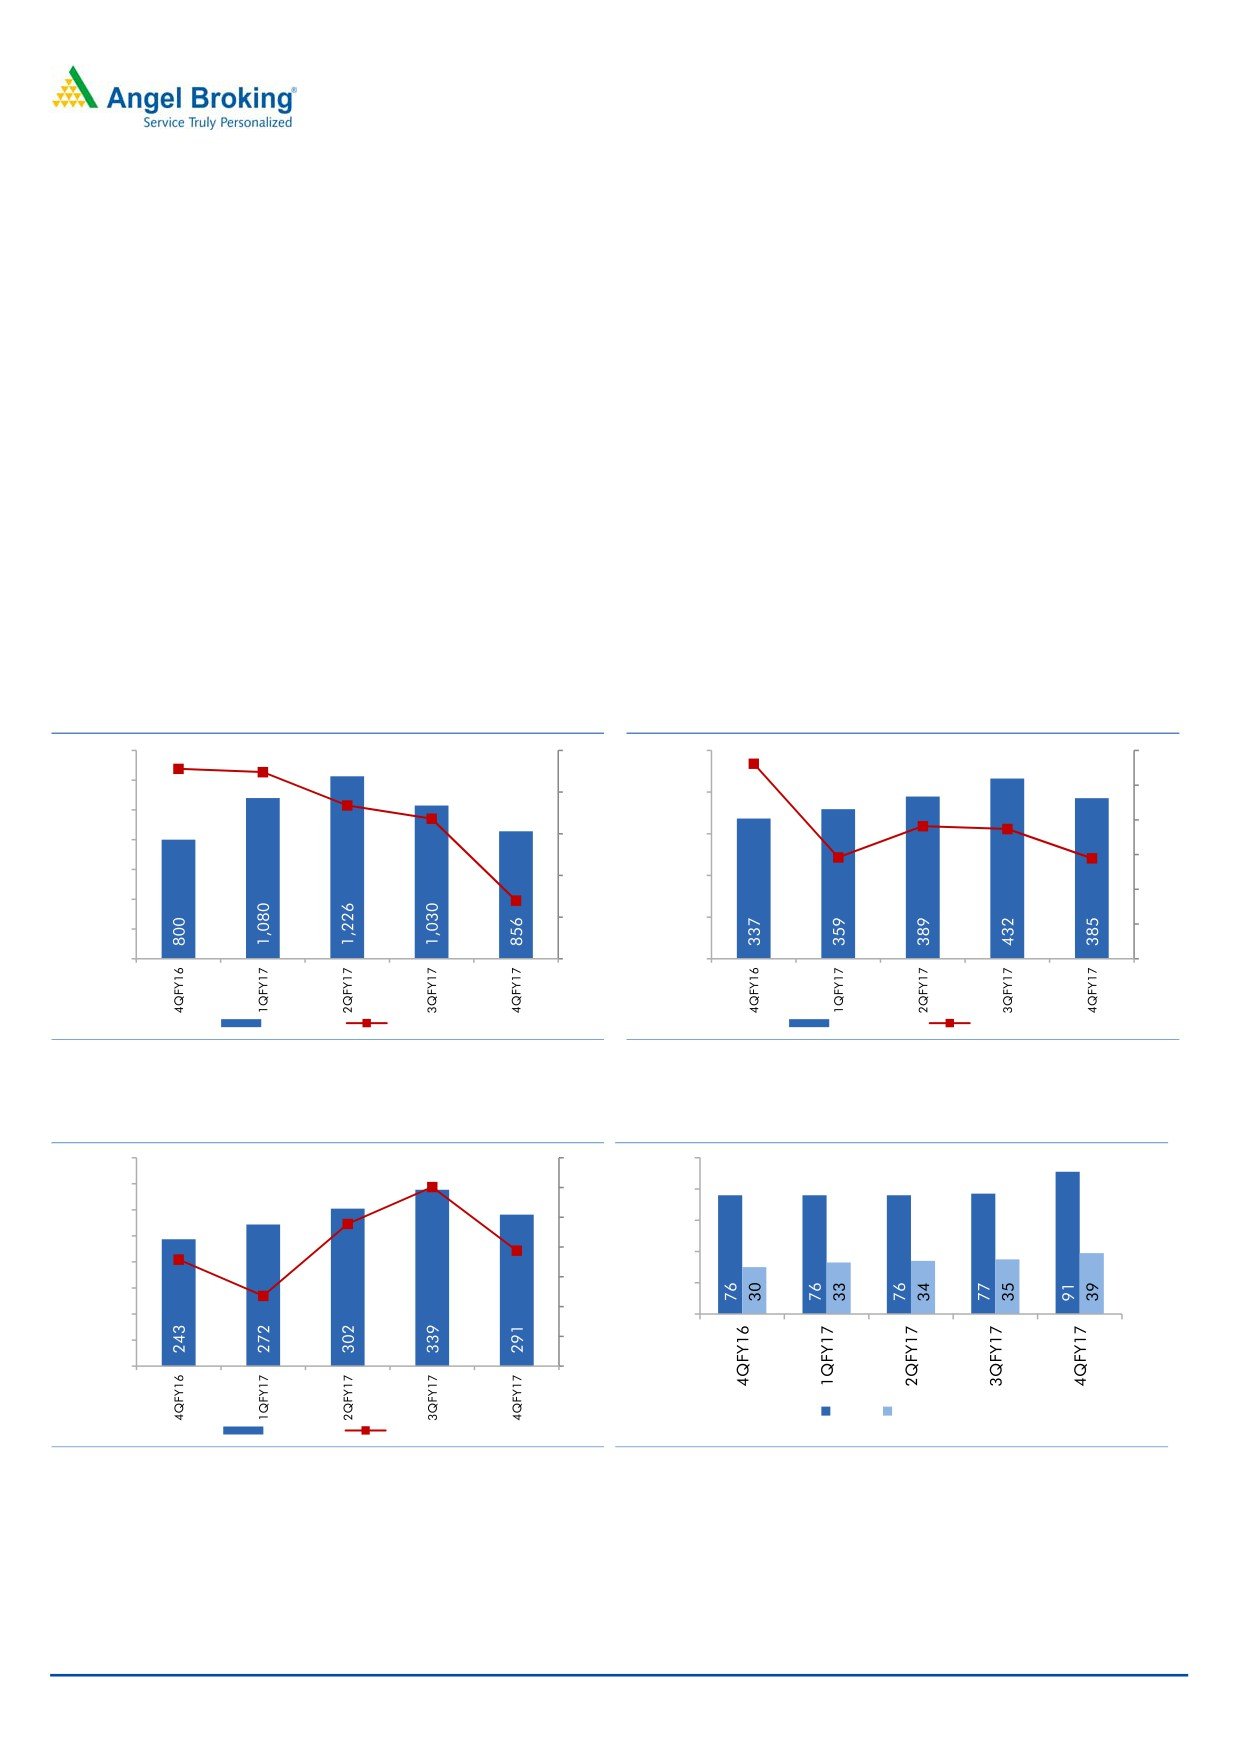
Alkem reported revenue grew of 9% yoy. Domestic revenue grew by 7% yoy to
`856cr while exports grew by 14.5% to `385cr.
In the therapeutic segments, company grew by
4.7% in the quarter
underperforming industry growth of 6.6%. Main reason behind this is negative
growth rate that company clocked in Anti-infective and respiratory segments.
US revenue was at `291cr vs. `243cr in 4QFY16. US revenue growth was at
19.4% yoy, slower than our expectations. Other exports were flat on yoy basis
to `95cr in 4QFY17. Company continues to focus on the US market which is
clearly reflected in the numbers.
The company continues to maintain its market share in the Anti-infective, GI
and pain management segments. In the acute segment, company has mainly
put a subdued performance, however in the chronic segment; company has
gained market share, especially in derma, cardiac and anti-diabetic segments.
Domestic business contributed
69% of the total revenue while exports
contributed the rest.
February 14, 2017
2
Alkem Laboratories |4QFY2017 Result Update
Export mix remains unchanged with US contribution at 23% in 4QFY17 vs.
23.2% in 3QFY17. On yoy basis, this contribution has grown by 200bps.
Gross margins improved by~67bps on yoy basis but declined by 35bps on
qoq basis.
Staff costs was at `229cr, showing a yoy increase of 19.3%. As % of net sales,
staff cost was at 18.3% in the quarter vs. 16.7% in 4QFY16 and 18.3% in
3QFY17.
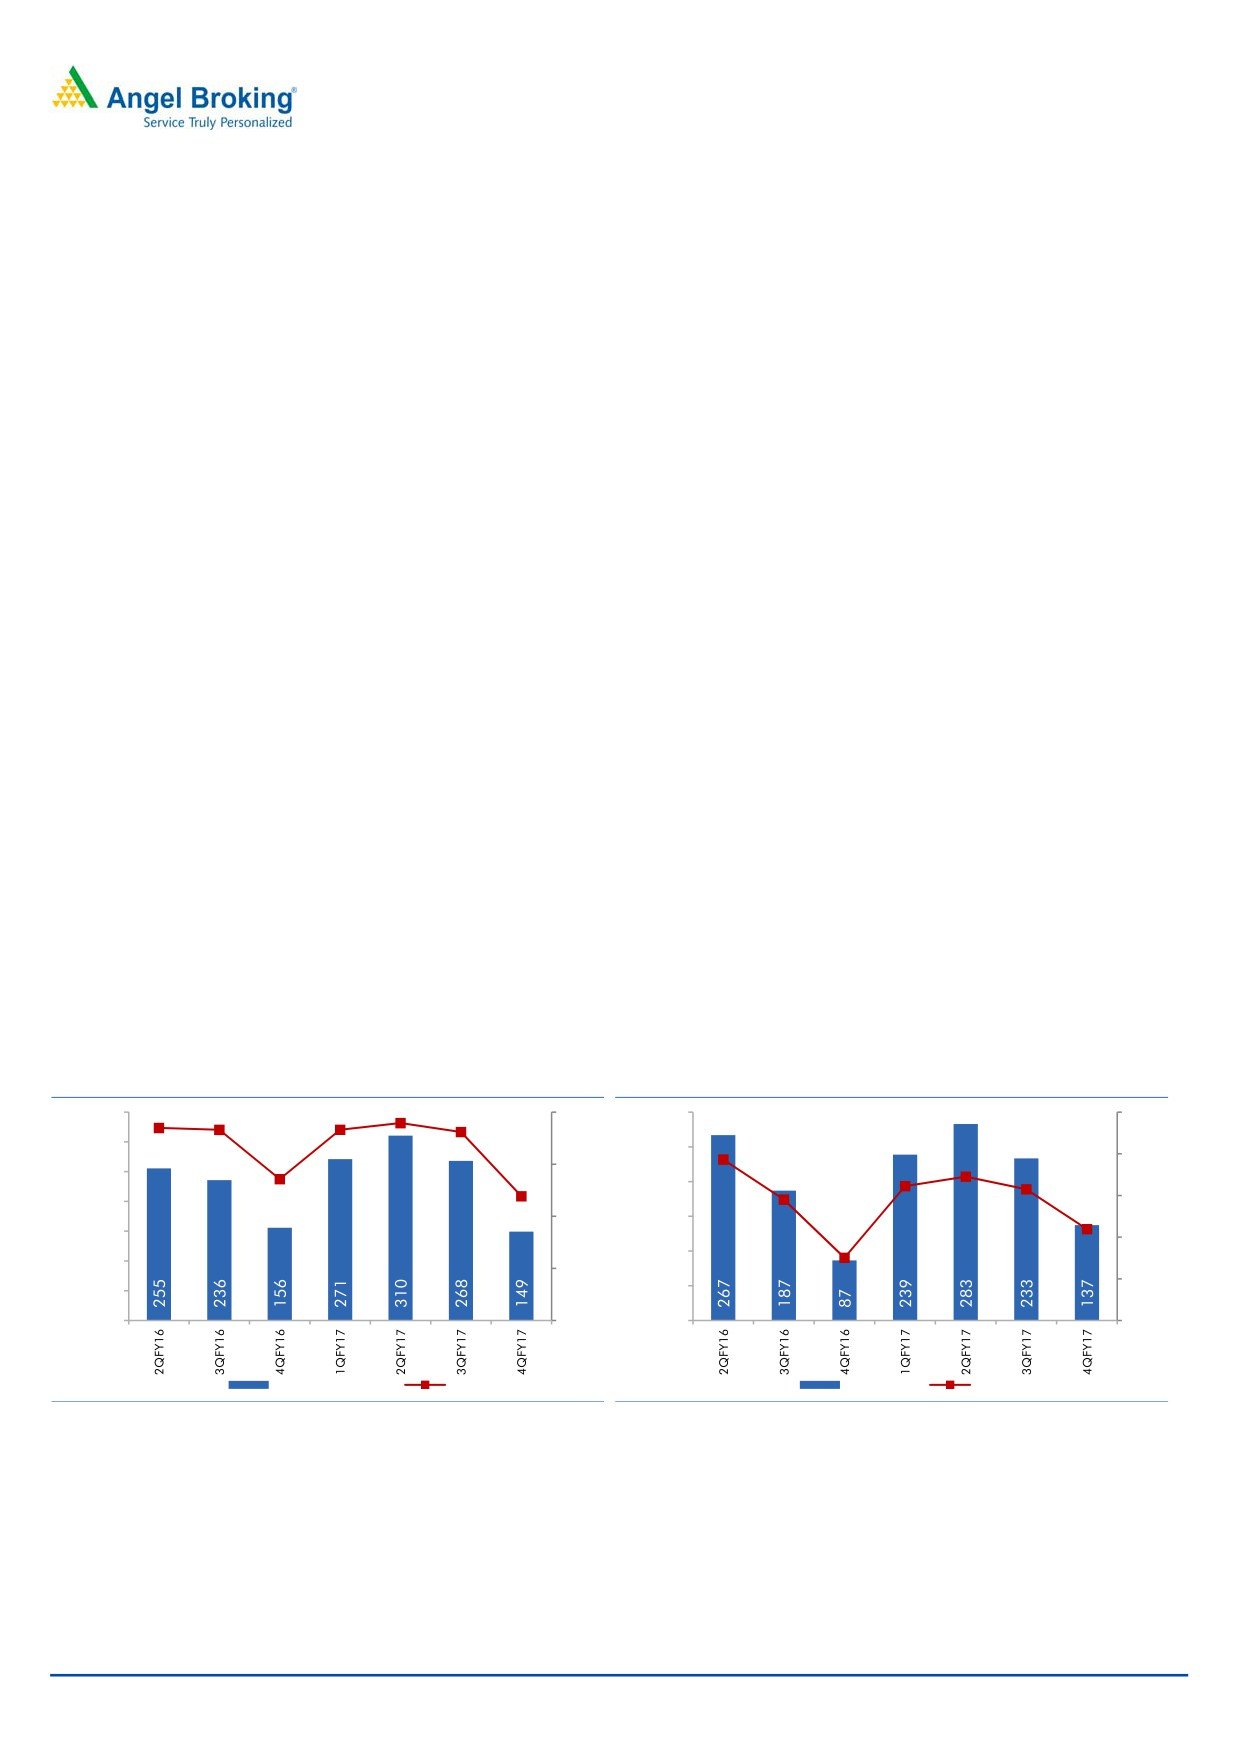
EBITDA came in at `149cr vs. `156cr in 4QFY16 showing a yoy decline of
4.2%.
EBITDA margins at 11.9% in the quarter declined by ~164bps on yoy basis
and by ~616bps on qoq basis, mainly due to higher R&D and staff costs as
mentioned above.
Net profit grew by 58.6% yoy from `87cr in 4QFY16 to `137cr in 4QFY17.
This was due to lower tax rate in the quarter.
Exhibit 2: Domestic business growth at 7%
Exhibit 3: Exports continues to grow, albeit slowly
1,400
22.8
22.4
25
500
28.1
30
18.4
1,200
25
16.8
20
400
1,000
19.1
18.7
20
15
300
14.6
14.5
800
15
600
7.0
10
200
10
400
5
100
5
200
0
0
0
0
Domestic
yoy growth (%)
Total exports
yoy growth (%)
Source: Company, Angel Research
Source: Company, Angel Research
Exhibit 4: US growth at 19% due to seasonality
Exhibit 5: ANDA pipeline, 14 ANDA additions in 4Q
400
35
100
30.1
350
30
80
23.9
300
17.9
25
60
19.4
250
20
40
200
11.8
15
150
20
10
100
0
50
5
0
0
Filed
Approval
US sales
yoy growth (%)
Source: Company, Angel Research
Source: Company, Angel Research
February 14, 2017
3
Alkem Laboratories |4QFY2017 Result Update
Conference call - Key highlights
Company has indicated of pricing pressure in the US. The 4th quarter lower
EBITDA was due to the seasonality.
The slower growth in the domestic revenues is on the account of
demonetisation and DPCO initiated price cuts and negative WPI inflation.
Anti-infective segment contributes ~40% of its top line and de-growth in this
segment has hurt its overall growth in the quarter.
In the chronic segment, company has grown faster than the market and has
also moved higher in ranks of the respective segments.
In the US, company has gained market share in its products, the growth in 4Q
also was due to the new product launches. In the FY17, company has made 7
drug launches in US.
The company has received EIR for all the three facilities on which it had earlier
received minor observations.
The effective GST rate would be 12% vs. current 9.5%. The industry is seeking
government approval for price hike post-GST.
Company expects higher single-digit products launches in the US this year.
R&D expenses guidance of 6% of net sales for FY18E.
FY18E capex likely to be ~`600cr.
Company maintains the guidance to launch high single digit ANDAs per year
going ahead.
Exhibit 6: Margins dip due to high staff and R&D costs
Exhibit 7: PAT grows 58% yoy due to lower tax
350
18.5
18.3
18.3
19.0
18.1
20.0
300
19.3
17.3
25.0
300
16.1
15.7
250
13.6
20.0
15.0
250
11.9
200
14.5
200
15.0
11.0
10.0
150
150
7.5
10.0
100
100
5.0
5.0
50
50
0
0.0
0
0.0
Operating Profit
OPM
Adj PAT
Adj. PATM
Source: Company, Angel Research
Source: Company, Angel Research
February 14, 2017
4
Alkem Laboratories |4QFY2017 Result Update
Investment arguments
Strong domestic business- Alkem is the 5th largest pharma company in India
in terms of domestic revenues. Its acute segment contributes 88% of domestic
revenue while chronic business contributes
12%. In the acute business,
company is ranked #1 in anti-infective segment and #3 each in pain and
Gastro intestinal segments. Alkem is currently a small player in the chronic
segment but it is expanding this business rapidly.
Domestic business to continue its outperformance vs. industry: Alkem is
expected to continue its outperformance vs. industry due to strong growth in its
acute and chronic segments. Both segments are expected to report strong
growth due to increasing market share as well as increasing productivity of its
marketing and sales staff. We expect domestic sales to grow at 13.8% CAGR
to `5,434cr in FY19E, vs. domestic industry growth of ~12% during the same
period.
US revenue to double with increased ANDA monetization: Alkem’s ANDA
pipeline increased 2.9x from 31 ANDAs in FY12 to 91 ANDAs in FY17. ANDA
approvals also grew by 3.5x during the same period, of this 8 approvals came
in FY17 itself. In next three years company expects increased ANDA launches
on the back of approval to 2/3rd of its pipeline. This will see strong increase in
its US revenue from `1,203cr in FY17 to `1,896cr in FY19E.
Improving operating performance: Alkem’s operating performance is expected
to improve with better sales mix (increasing exports) and market share gains in
chronic segment. The company has already seen margin improvement and
with rising profitability of US business, we estimate
70-100bps margin
expansion.
Outlook and valuation
The stock at the CMP of `1,868 is available at P/E of 18.6x of FY19E EPS of `101.
We have cut our EPS estimates by ~5% due to the recent slowdown in domestic
business, likely disruption in the business due to GST and pricing pressure in the
US. We expect company to report CAGR of 15.8% and 15.3% in top line and
bottom line respectively in next two years. The company is expected to witness
improvement in its return ratios owing to the rising profitability of US business.
Moreover Alkem’s all manufacturing facilities are current with USFDA which gives
confidence that company will deliver strong results over next two years.
Considering these factors, we rate Alkem Buy with PT of 2,161 based on 21.5x of
FY19E EPS.
Company background
Alkem Laboratories is a Mumbai based pharma company engaged in
manufacturing and marketing of generic drugs, APIs and neutraceutical products.
Company sells its drugs in India and ~50 countries including the US. It has 16
manufacturing facilities of which 14 are in India and two in the USA.
February 14, 2017
5
Alkem Laboratories |4QFY2017 Result Update
Profit and loss statement
Y/E March (` cr)
FY2015
FY2016
FY2017
FY2018E
FY2019E
Total operating income
3,743
4,992
5,853
6,901
7,850
% chg
19.7
33.3
17.2
17.9
13.8
Total Expenditure
3,322
4,143
4,854
5,631
6,351
Cost of Materials
1,691
1,961
2,222
2,622
2,983
Personnel
646
917
1,004
1,215
1,366
Others Expenses
985
1,265
1,628
1,794
2,002
EBITDA
422
848
999
1,270
1,499
% chg
2.9
101.1
17.8
27.1
18.1
(% of Net Sales)
11.3
17.0
17.1
18.4
19.1
Depr. & Amort.
71
101
101
130
155
EBIT
351
748
898
1,140
1,344
% chg
(1.9)
113.1
20.1
27.0
18.0
(% of Net Sales)
9.4
15.0
15.3
16.5
17.1
Interest & other Charges
81
67
45
47
47
Other Income
181
165
112
117
133
(% of PBT)
40.2
19.5
11.6
9.7
9.3
Recurring PBT
-
-
-
-
-
% chg
451
845
965
1,210
1,431
Prior Period & Extraord. Exp./(Inc.)
4.8
87.5
14.1
25.4
18.3
PBT (reported)
-
-
-
-
-
Tax
451
845
965
1,210
1,431
(% of PBT)
59
161
60
194
229
PAT (reported)
13.1
19.0
6.2
16.0
16.0
Add: Share of earnings of asso.
392
684
905
1,016
1,202
Less: Minority interest (MI)
-
-
-
-
-
PAT after MI (reported)
-
11
12
-
-
ADJ. PAT
392
673
892
1,016
1,202
% chg
392
673
892
1,016
1,202
(% of Net Sales)
(10.0)
71.9
32.6
13.9
18.3
Basic EPS (`)
10.5
13.5
15.2
14.7
15.3
Fully Diluted EPS (`)
32.8
56.3
74.6
85.0
100.5
% chg
32.8
56.3
74.6
85.0
100.5
February 14, 2017
6
Alkem Laboratories |4QFY2017 Result Update
Balance sheet statement
Y/E March (` cr)
FY15
FY16
FY17E
FY18E
FY19E
SOURCES OF FUNDS
Equity Share Capital
24
24
24
24
24
Reserves& Surplus
2,975
3,479
4,204
5,007
5,956
Shareholders’ Funds
2,999
3,503
4,228
5,031
5,980
Minority Interest
86
97
97
97
97
Total Loans
1,381
739
750
750
750
Deferred Tax Liability
126
153
153
153
153
Total Liabilities
4,591
4,490
5,227
6,030
6,979
APPLICATION OF FUNDS
Gross Block
1,745
1,889
2,519
3,169
3,819
Less: Acc. Depreciation
371
447
548
678
833
Net Block
1,374
1,442
1,970
2,490
2,985
Capital Work-in-Progress
111
172
250
300
300
Investments
481
422
422
422
422
Current Assets
3,325
3,394
3,696
4,144
4,794
Inventories
784
909
1,074
1,267
1,441
Sundry Debtors
527
565
641
756
860
Cash
791
796
529
410
545
Loans & Advances
175
240
281
331
377
Other Assets
1,048
884
1,171
1,380
1,570
Current liabilities
733
998
1,169
1,385
1,580
Net Current Assets
2,592
2,396
2,527
2,759
3,214
Deferred Tax Asset
34
58
58
58
58
Mis. Exp. not written off
-
-
-
-
-
Total Assets
4,591
4,490
5,227
6,030
6,979
Note: Cash includes cash with scheduled banks on dividend current accounts
February 14, 2017
7
Alkem Laboratories |4QFY2017 Result Update
Cash flow statement
Y/E March (` cr)
FY15
FY16
FY17E FY18E FY19E
Profit before tax
451
845
965
1,210
1,431
Depreciation
71
101
101
130
155
Change in Working Capital
(12)
14
(398)
(352)
(319)
Interest / Dividend (Net)
(53)
(59)
45
47
47
Direct taxes paid
(106)
(198)
(60)
(194)
(229)
Others
(26)
24
-
-
-
Cash Flow from Operations
325
726
653
842
1,085
(Inc.)/ Dec. in Fixed Assets
(235)
189
(708)
(700)
(650)
(Inc.)/ Dec. in Investments
-
-
-
-
-
Cash Flow from Investing
(235)
189
(708)
(700)
(650)
Issue of Equity
-
-
-
-
-
Inc./(Dec.) in loans
87
(671)
11
-
-
Dividend Paid (Incl. Tax)
(57)
(185)
(179)
(213)
(252)
Interest / Dividend (Net)
569
598
(45)
(47)
(47)
Cash Flow from Financing
599
(258)
(213)
(261)
(300)
Inc./(Dec.) in Cash
690
657
(267)
(119)
135
Opening Cash balances
101
140
796
529
410
Closing Cash balances
791
796
529
410
545
February 14, 2017
8
Alkem Laboratories |4QFY2017 Result Update
Key ratios
Y/E March
FY15
FY16
FY17E
FY18E
FY19E
Valuation Ratio (x)
P/E (on FDEPS)
57.0
33.2
25.0
22.0
18.6
P/CEPS
4.6
48.3
28.4
22.2
19.5
P/BV
7.4
6.4
5.3
4.4
3.7
Dividend yield (%)
1.4
0.3
0.8
0.8
1.0
EV/Sales
6.0
4.4
3.8
3.2
2.8
EV/EBITDA
53.2
25.8
22.2
17.5
14.7
EV / Total Assets
4.2
4.0
3.5
3.0
2.6
Per Share Data (`)
EPS (Basic)
32.8
56.3
74.6
85.0
100.5
EPS (fully diluted)
32.8
56.3
74.6
85.0
100.5
Cash EPS
407.7
38.7
65.7
84.1
95.9
DPS
26.6
4.7
15.4
15.0
17.9
Book Value
250.9
293.0
353.7
420.8
500.2
Dupont Analysis
EBIT margin
9.4
15.0
15.3
16.5
17.1
Tax retention ratio
0.9
0.8
0.9
0.8
0.8
Asset turnover (x)
1.2
1.7
1.5
1.4
1.4
ROIC (Post-tax)
9.8
20.0
20.9
19.3
19.6
Cost of Debt (Post Tax)
0.1
0.1
0.1
0.1
0.1
Leverage (x)
0.0
(0.1)
(0.0)
(0.0)
(0.0)
Operating ROE
10.2
17.3
19.9
19.0
18.9
Returns (%)
ROCE
8.0
17.6
18.0
19.7
20.0
Angel ROIC (Pre-tax)
11.3
24.7
22.3
23.0
23.3
ROE
13.1
19.2
21.1
20.2
20.1
Turnover ratios (x)
Asset Turnover (Gross Block)
2.1
2.6
2.3
2.2
2.1
Inventory / Sales (days)
49
67
67
67
67
Receivables (days)
33
41
40
40
40
Payables (days)
29
42
42
42
42
WC cycle (ex-cash) (days)
53
65
65
65
65
February 14, 2017
9
Alkem Laboratories |4QFY2017 Result Update
Research Team Tel: 022 - 39357800
DISCLAIMER
Angel Broking Private Limited (hereinafter referred to as “Angel”) is a registered Member of National Stock Exchange of India Limited,
Bombay Stock Exchange Limited and Metropolitan Stock Exchange Limited. It is also registered as a Depository Participant with CDSL
and Portfolio Manager with SEBI. It also has registration with AMFI as a Mutual Fund Distributor. Angel Broking Private Limited is a
registered entity with SEBI for Research Analyst in terms of SEBI (Research Analyst) Regulations, 2014 vide registration number
INH000000164. Angel or its associates has not been debarred/ suspended by SEBI or any other regulatory authority for accessing
/dealing in securities Market. Angel or its associates/analyst has not received any compensation / managed or co-managed public
offering of securities of the company covered by Analyst during the past twelve months.
This document is solely for the personal information of the recipient, and must not be singularly used as the basis of any investment
decision. Nothing in this document should be construed as investment or financial advice. Each recipient of this document should
make such investigations as they deem necessary to arrive at an independent evaluation of an investment in the securities of the
companies referred to in this document (including the merits and risks involved), and should consult their own advisors to determine
the merits and risks of such an investment.
Reports based on technical and derivative analysis center on studying charts of a stock's price movement, outstanding positions and
trading volume, as opposed to focusing on a company's fundamentals and, as such, may not match with a report on a company's
fundamentals. Investors are advised to refer the Fundamental and Technical Research Reports available on our website to evaluate the
contrary view, if any.
The information in this document has been printed on the basis of publicly available information, internal data and other reliable
sources believed to be true, but we do not represent that it is accurate or complete and it should not be relied on as such, as this
document is for general guidance only. Angel Broking Pvt. Limited or any of its affiliates/ group companies shall not be in any way
responsible for any loss or damage that may arise to any person from any inadvertent error in the information contained in this report.
Angel Broking Pvt. Limited has not independently verified all the information contained within this document. Accordingly, we cannot
testify, nor make any representation or warranty, express or implied, to the accuracy, contents or data contained within this document.
While Angel Broking Pvt. Limited endeavors to update on a reasonable basis the information discussed in this material, there may be
regulatory, compliance, or other reasons that prevent us from doing so.
This document is being supplied to you solely for your information, and its contents, information or data may not be reproduced,
redistributed or passed on, directly or indirectly.
Neither Angel Broking Pvt. Limited, nor its directors, employees or affiliates shall be liable for any loss or damage that may arise from
or in connection with the use of this information.
Disclosure of Interest Statement
Alkem Laboratories
1. Financial interest of research analyst or Angel or his Associate or his relative
No
2. Ownership of 1% or more of the stock by research analyst or Angel or associates or relatives
No
3. Served as an officer, director or employee of the company covered under Research
No
4. Broking relationship with company covered under Research
No
Ratings (Based on expected returns
Buy (> 15%)
Accumulate (5% to 15%)
Neutral (-5 to 5%)
over 12 months investment period):
Reduce (-5% to -15%)
Sell (< -15)
February 14, 2017
10