1QFY2017 Result Update | Pharmaceutical
August 4, 2016
Alembic Pharmaceuticals
NEUTRAL
CMP
`622
Performance Highlights
Target Price
-
Y/E March (` cr)
1QFY2017 4QFY2016
% chg (qoq) 1QFY2016
% chg (yoy)
Investment Period
-
Net Sales
727
626
16.2
583
24.8
Other Income
1
4
(61.3)
1
46.9
Stock Info
Operating Profit
156
142
9.6
101
54.2
Sector
Pharmaceutical
Interest
1
1
(17.7)
1
11,746
Market Cap (` cr)
Adj. Net Profit
104
91
13.8
72
44.6
Net Debt (` cr)
814
Source: Company, Angel Research
Beta
0.7
For 1QFY2017, Alembic Pharmaceuticals posted sales of `727cr V/s `780cr
52 Week High / Low
755/514
expected and V/s `583cr in 1QFY2016, ie a yoy growth of 24.8%. Formulations
23,306
Avg. Daily Volume
(`607.6cr) grew 29.3% yoy, while API (`128cr) grew 7.0% yoy. On the operating
2
Face Value (`)
profit front, the OPM came in at 21.4% V/s 17.4% in 1QFY2016 and V/s 22.7%
27,982
BSE Sensex
expected. Expansion in the OPM was mainly on back of gross margin expansion
8,623
Nifty
to 73.7% (V/s 63.4% in 1QFY2016). R&D Exp during the quarter was 10.9% of
ALEM.BO
Reuters Code
sales V/s 8.2% in 1QFY2016. This led the company to post an Adj. net profit of
Bloomberg Code
ALPM@IN
`104cr V/s `72cr in 1QFY2016, a yoy growth of 44.6%. We maintain our Neutral
rating.
Shareholding Pattern (%)
Results below expectations: For 1QFY2017, the company posted sales of `727cr
Promoters
74.1
V/s `780cr expected and V/s `583cr in 1QFY2016, a yoy growth of 24.8%.
MF / Banks / Indian Fls
3.5
Formulations (`607.6cr) grew 29.3% yoy, while API (`128cr) grew by 7.0% yoy.
FII / NRIs / OCBs
11.1
The formulations growth was driven by international formulations
(`309cr)
Indian Public / Others
11.3
posting a yoy growth of 72.0%, while Indian formulations (`278cr) grew 6.0%
yoy. On the operating front, the OPM came in at 21.4% V/s 17.4% in 1QFY2016
and V/s 22.7% expected. Expansion in the OPM was mainly on back of gross
Abs. (%)
3m 1yr
3yr
margin expansion to 73.7% (V/s 63.4% in 1QFY2016). This led the company to
Sensex
3.1
(8.7)
28.2
post an Adj. net profit of `104cr V/s `72cr in 1QFY2016, a yoy growth of 44.6%.
Alembic Pharma
4.7
(12.3)
341.3
Outlook and valuation: Over FY2016-18E, we expect the company to post a
CAGR of 13.9% in sales while profitability will be under pressure on back of
higher R&D spend, which is likely to reach 13-14% of sales in FY2017-FY2018E.
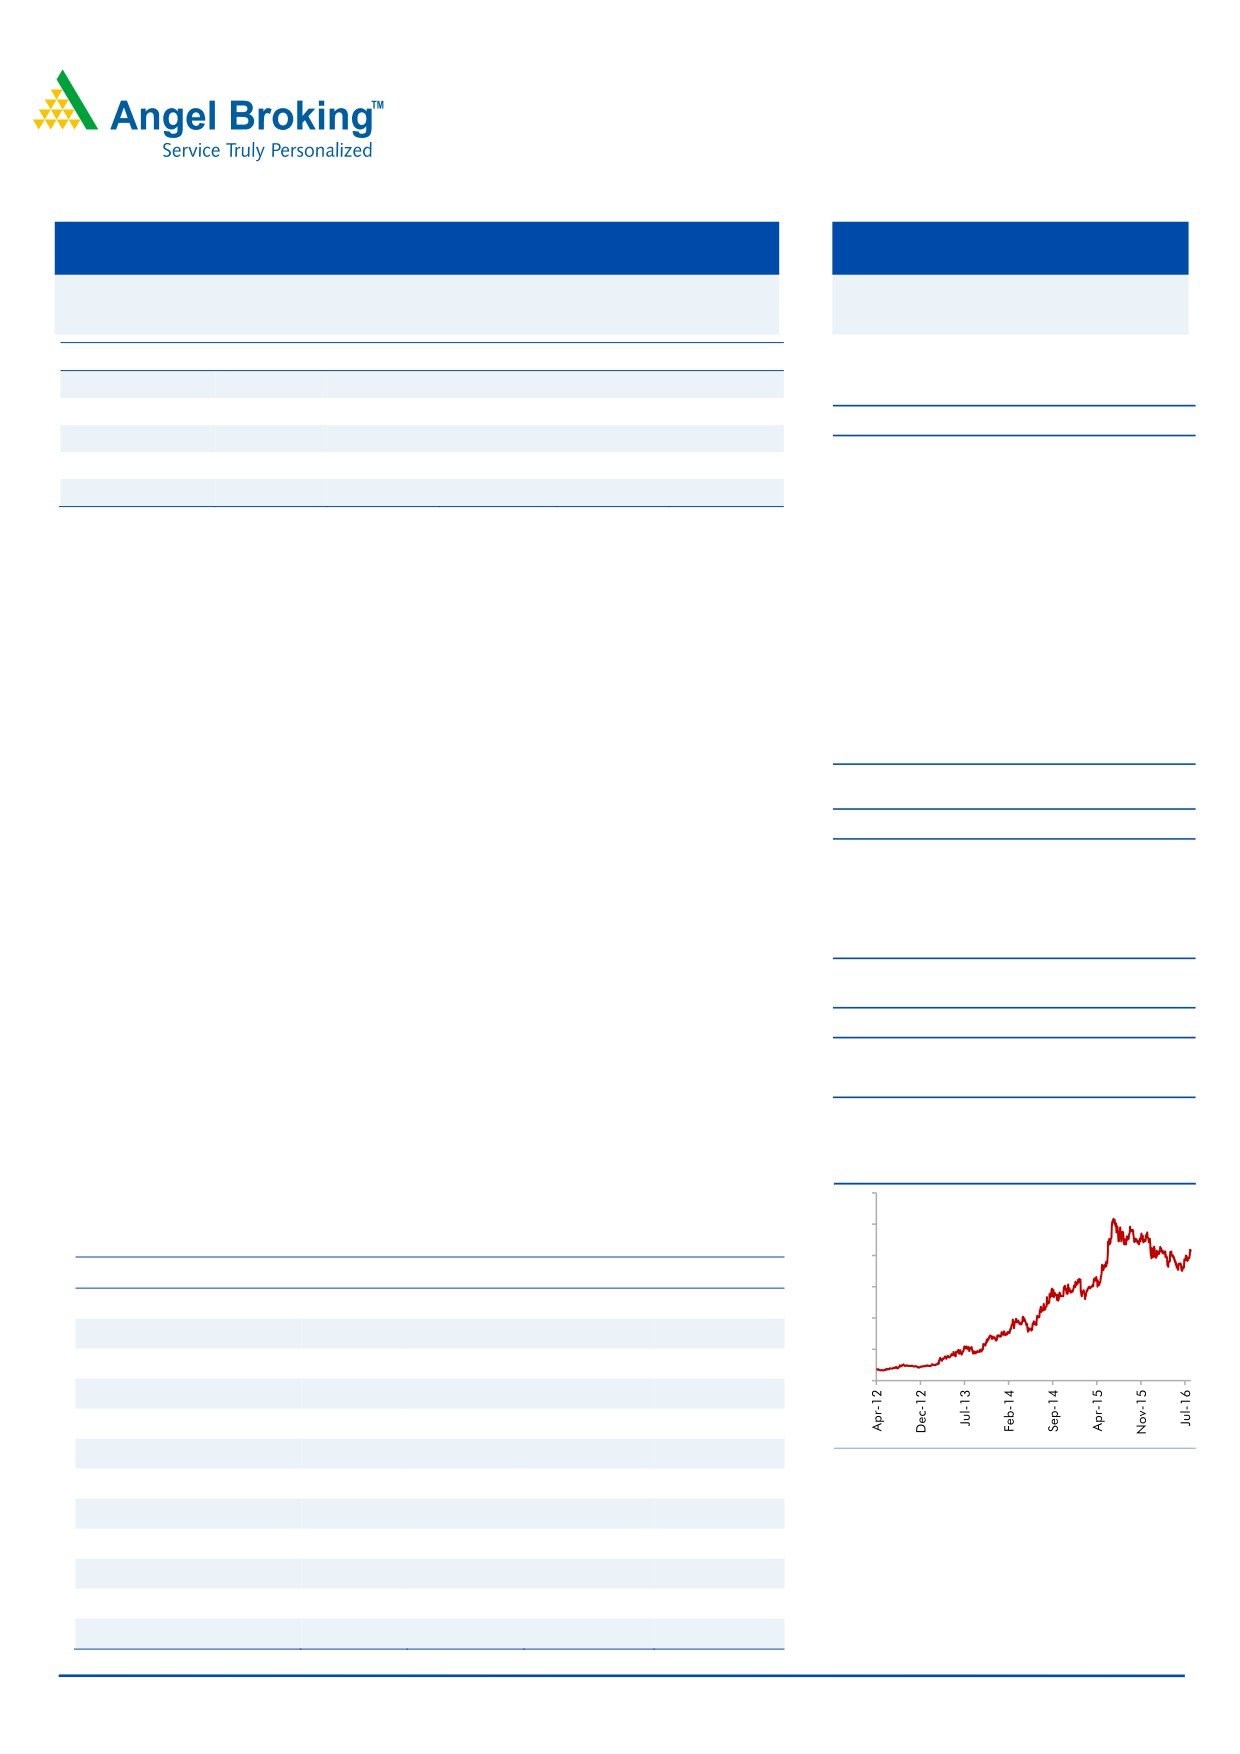
3-year price chart
900
We recommend a Neutral rating on the stock.
750
Key Financials (Consolidated)
600
Y/E March (` cr)
FY2015
FY2016
FY2017E
FY2018E
450
Net Sales
2,053
3,145
3,483
4,083
300
% chg
10.2
53.2
10.8
17.2
150
Net Profit
283
720
459
572
0
% chg
20.0
154.1
(36.2)
24.7
EPS (`)
15.0
38.2
24.3
30.4
EBITDA Margin (%)
19.5
31.9
20.2
21.4
Source: Company, Angel Research
P/E (x)
41.4
16.3
25.5
20.5
RoE (%)
36.3
57.9
25.5
25.3
RoCE (%)
30.2
51.0
27.2
27.5
P/BV (x)
13.2
7.3
5.8
4.6
Sarabjit Kour Nangra
EV/Sales (x)
5.8
3.6
3.3
2.7
+91- 22- 36357600 - 6806
EV/EBITDA (x)
29.6
11.3
16.2
12.7
Source: Company, Angel Research; Note: CMP as of August 3, 2016
Please refer to important disclosures at the end of this report
1
Alembic Pharma | 1QFY2017 Result Update
Exhibit 1: 1QFY2017 performance (Consolidated)
Y/E March (` cr)
1QFY2017
4QFY2016
% chg (qoq) 1QFY2016
% chg (yoy) FY2016 FY2015
% chg (yoy)
Net sales
727
626
16.2
583
24.8
3,145
2,053
53.2
Other income
1
4
(61.3)
1
46.9
9
6
51.7
Total income
728
629
584
24.8
3,154
2,059
Gross profit
536
502
6.9
369
45.1
2376
1338
77.6
Gross margin
73.7
80.2
63.4
75.5
65.2
Operating profit
156
142
9.6
101
54.2
1002
400
150.6
Operating margin (%)
21.4
22.7
17.4
31.9
19.5
Interest
1
1
(17.7)
1
4
2
84.0
Depreciation
19
24
(20.6)
13
50.3
72
44
64.1
PBT
137
120
13.9
89
54.6
936
359
160.6
Provision for taxation
33
29
16.4
19
77.4
216
76
184.2
PAT before Extra-ordinary item
104
91
13.6
72
44.6
720
283
154.3
Extra-Ordinary Expenses
(2)
0
(0)
0
0
PAT after Extra-ord. item & MI
104
91
13.8
72
44.6
720
283
154.3
EPS (`)
5.5
4.8
3.8
38.2
15.0
Source: Company, Angel Research
Exhibit 2: 1QFY2017 - Actual vs Angel estimates
(` cr)
Actual
Estimates
Variation (%)
Net Sales
727
780
(6.8)
Other Income
1
1
41.0
Operating Profit
156
177
(11.9)
Interest
1
1
78.3
Tax
33
28
19.6
Net Profit
102
137
(25.4)
Source: Company, Angel Research
Sales below expectation: For 1QFY2017, the company posted sales of `727cr
V/s `780cr expected and V/s `583cr in 1QFY2016, a yoy growth of 24.8%. The
formulations (`607.6cr) grew 29.3% yoy while API (`128cr) grew 7.0% yoy. The
formulations growth was driven by international formulation (`309cr) which grew
72.0% yoy, while Indian formulations (`278cr) grew 6.0% yoy.
The growth in sales was driven by the international formulations business (`309cr)
which posted a yoy growth of 72.0%, while Indian formulations (`278cr) posted a
6.0% yoy growth. The growth in the Indian formulations segment was driven by the
specialty segment which grew by 16% yoy, while the acute segment de-grew by
10% yoy during the period. During FY2016, the specialty segment had a 60%
share in domestic formulations while the rest was accounted by the acute segment
(40%). The API business (`128cr) posted a growth of 7.0% yoy. Till date, the
company has filed 78 products (2 in 1QFY2017) in USA.
August 4, 2016
2
Alembic Pharma | 1QFY2017 Result Update
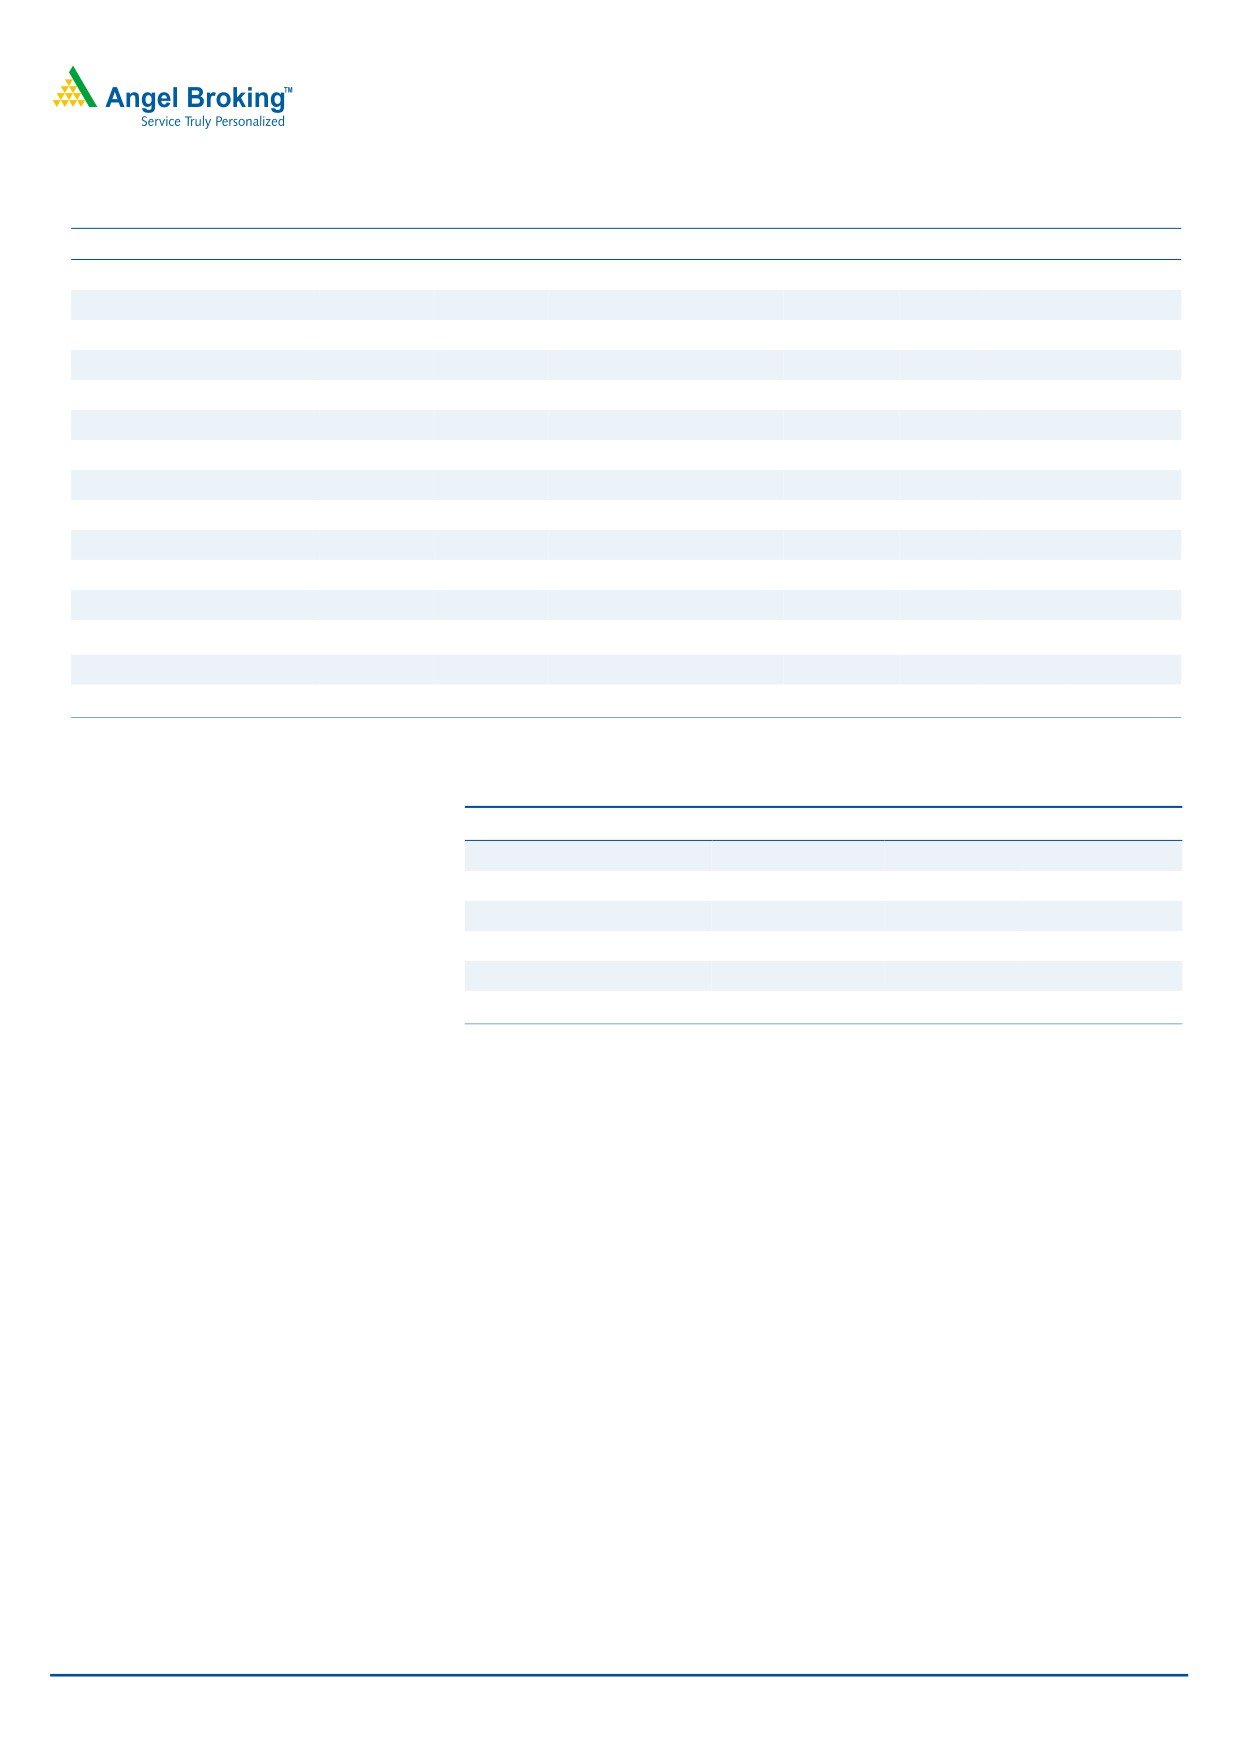
Exhibit 3: Sales trend
1080
1,008
921
880
727
582
626
680
480
280
1QFY2016
2QFY2016
3QFY2016
4QFY2016
1QFY2017
Source: Company, Angel Research
OPM lower than expectation: On the operating profit front, the OPM came in at
21.4% V/s 17.4% in 1QFY2016 and V/s 22.7% expected. Expansion in the OPM
was mainly on back of gross margin expansion to 73.7% V/s 63.4% in 1QFY2016.
R&D expenses during the quarter were 10.9% of sales V/s 8.2% in 1QFY2016.
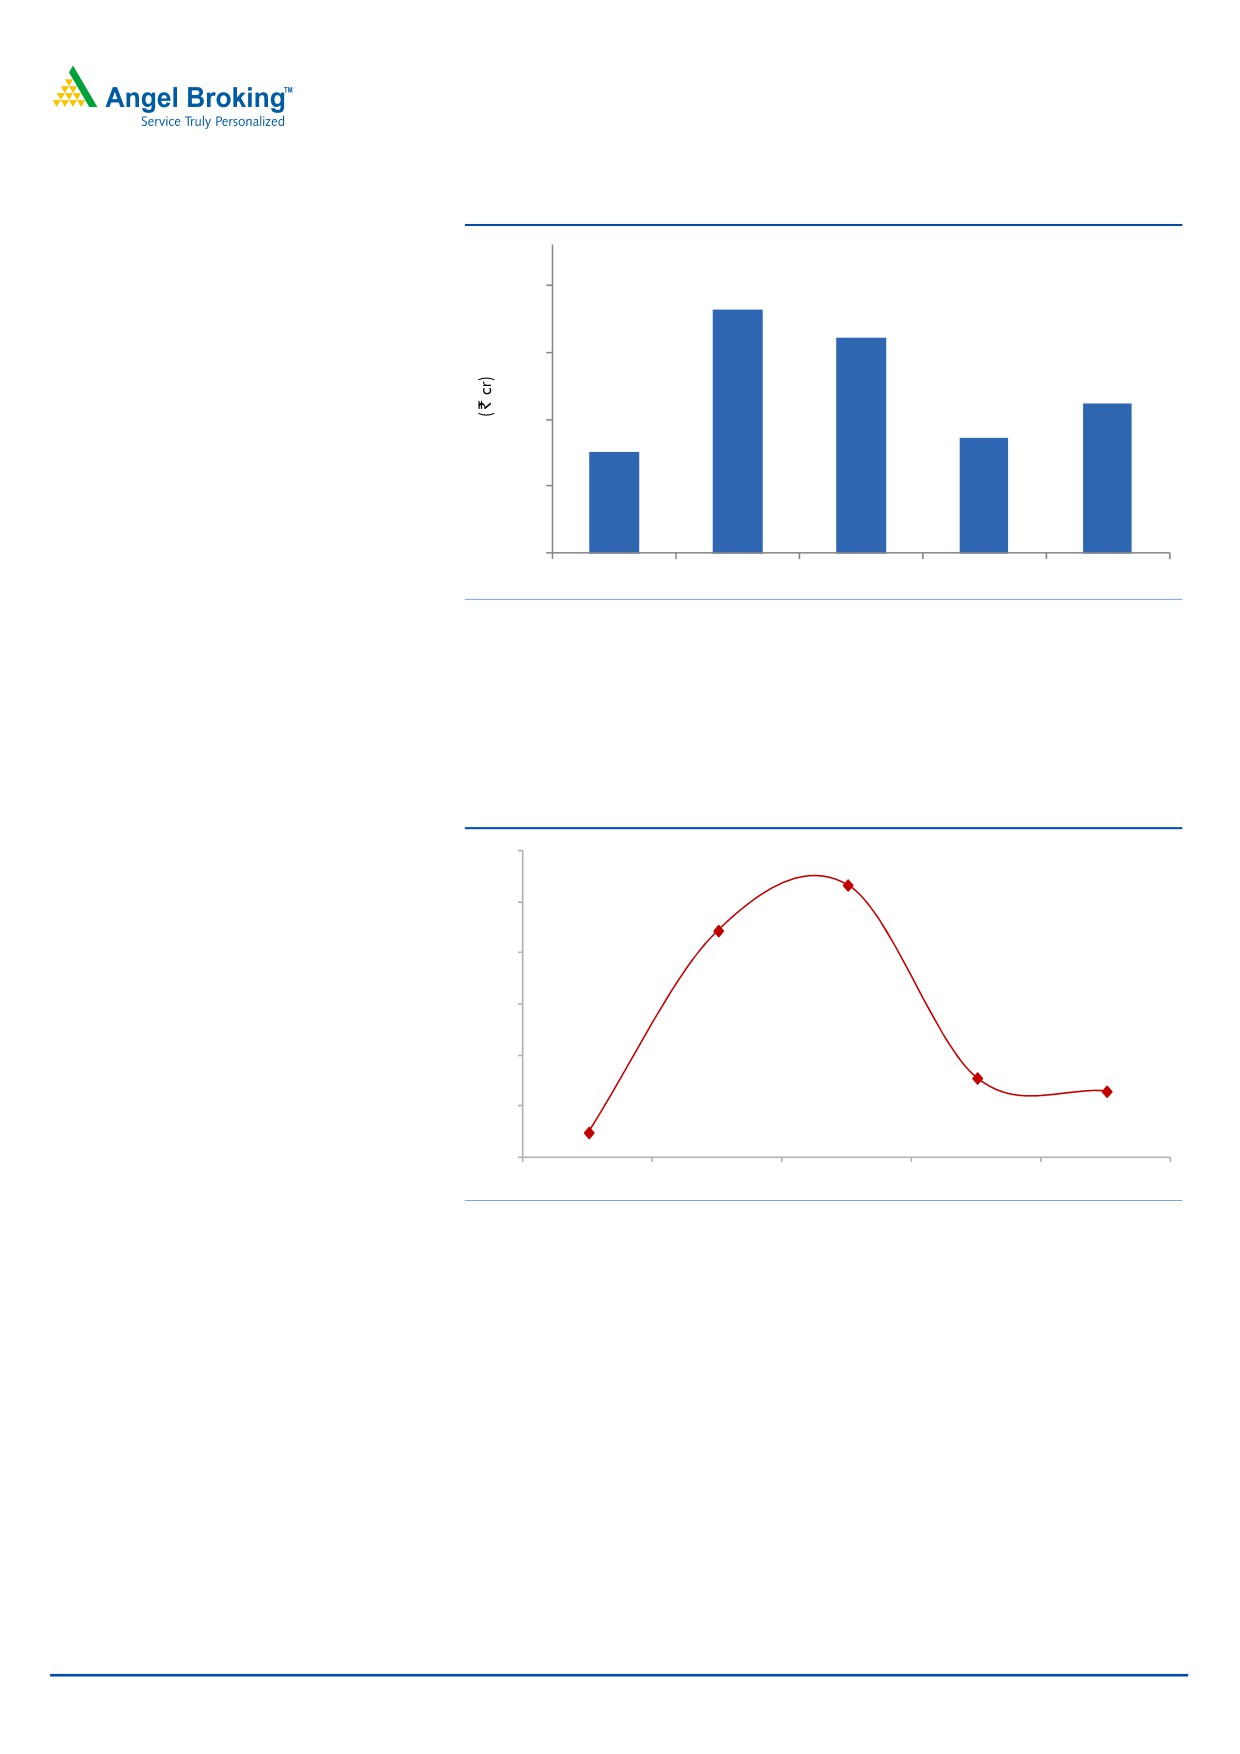
Exhibit 4: OPM Trend (%)
45.0
41.7
40.0
37.2
35.0
30.0
25.0
22.7
21.4
20.0
17.4
15.0
1QFY2016
2QFY2016
3QFY2016
4QFY2016
1QFY2017
Source: Company, Angel Research
Net profit below expectation: The Adj. net profit stood at `104cr V/s `70cr in
1QFY2016, a yoy growth of 46.1%. This was against the expectation of `137cr.
August 4, 2016
3
Alembic Pharma | 1QFY2017 Result Update
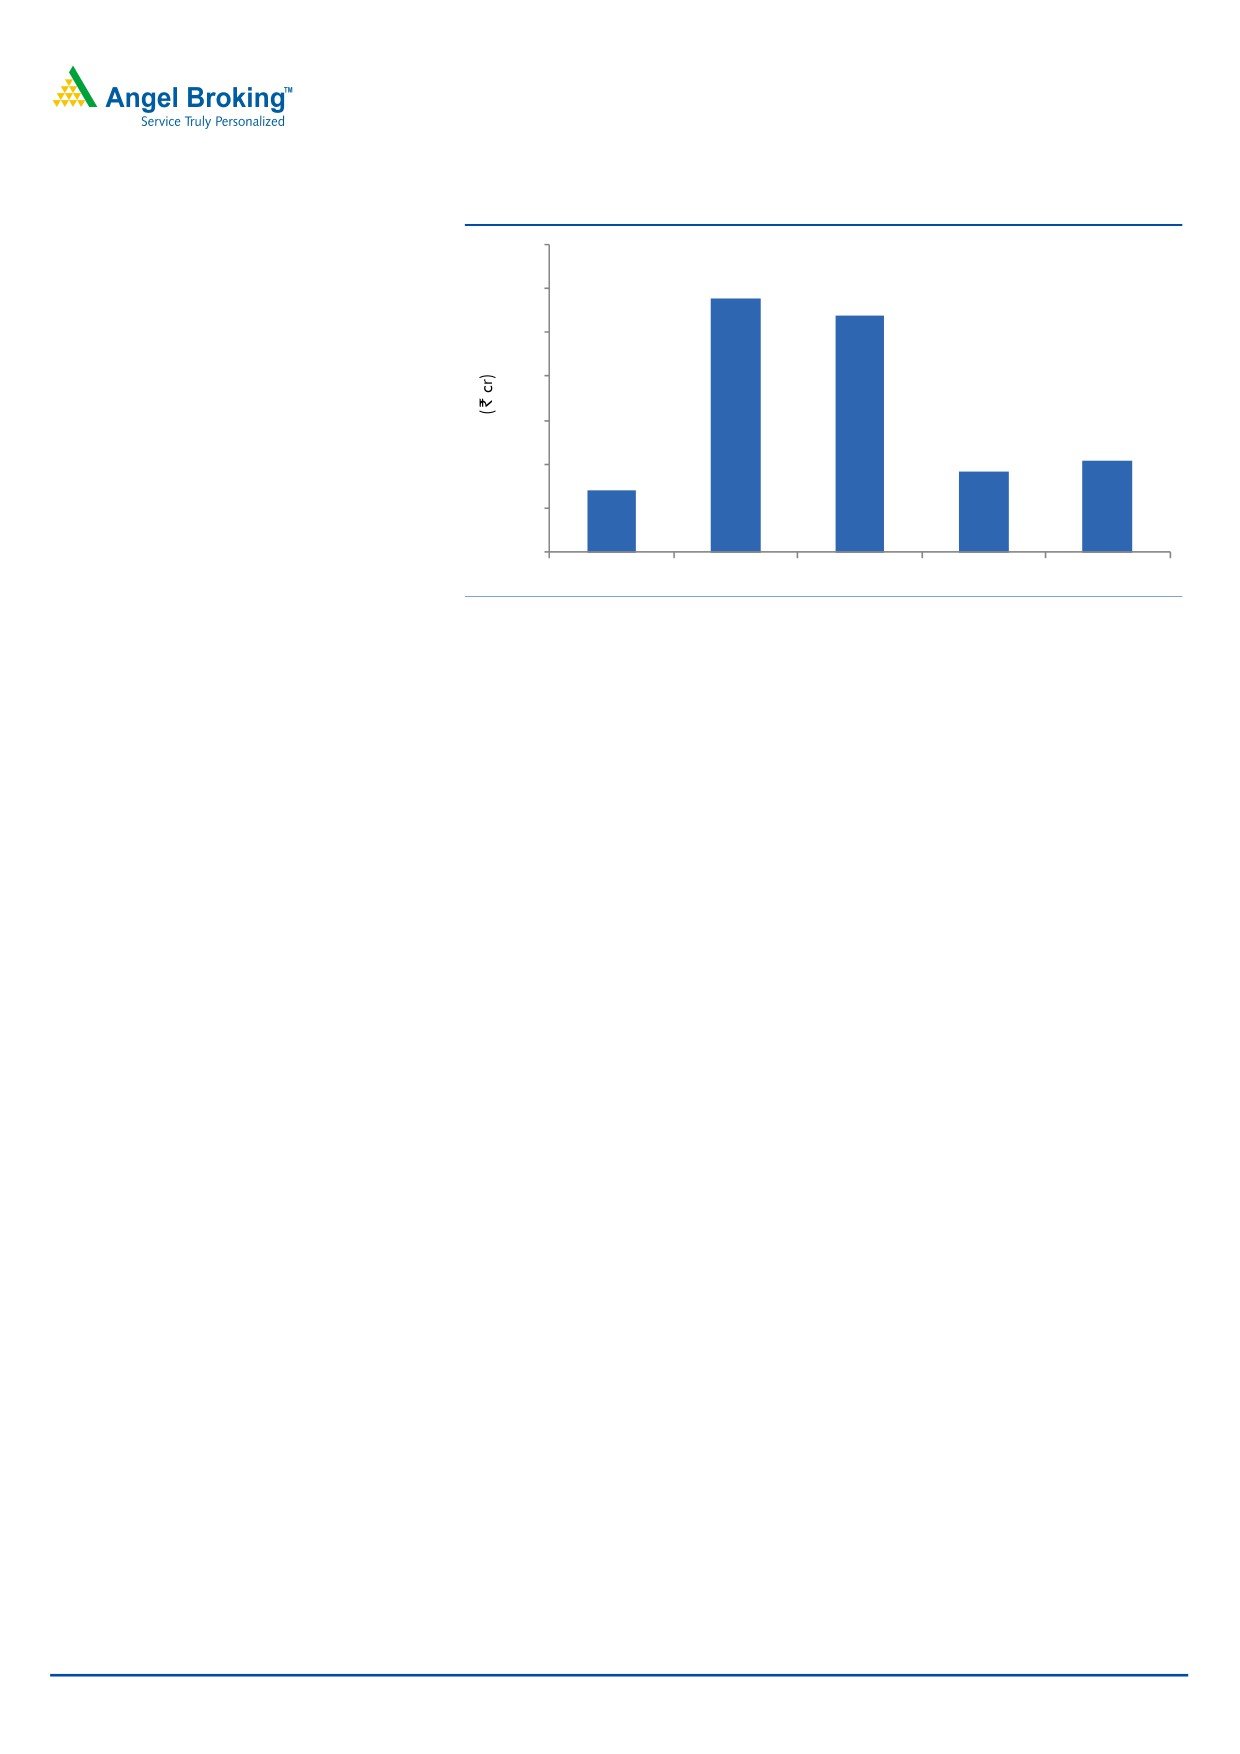
Exhibit 5: Net profit trend
350
300
289
269
250
200
150
104
70
91
100
50
0
1QFY2016
2QFY2016
3QFY2016
4QFY2016
1QFY2017
Source: Company, Angel Research
Concall highlights
The company has given `500cr of capex guidance for FY2017; `1,500cr to
be spent over next 2.5 years. Oncology injectable facility to be operational by
FY2017 end.
6-8 US ANDA approvals expected in FY2017.
API I and II successfully audited by the USFDA without any Form 483.
Investment arguments
Focus on chronic segment to drive domestic formulation growth: Alembic Pharma
has been restructuring its business portfolio, which would aid in improving its
growth and operating performance. The company’s domestic formulation business
contributed 44% to its total sales in FY2016. The company has a strong field force
of ~3,600 medical representatives. Going forward, the company expects its
domestic formulation business to at least grow in line with the industry growth rate,
before it sees an improvement in the share of the high growth chronic segment.
For FY2016-18E, we expect the domestic formulation business to grow at a CAGR
of 15.0%.
Exports- US the key growth driver: On the exports front, the formulation business
contributed by 30% to the total turnover, with majority of the contribution coming
from Europe and the US. In the US, the company has filed for ~76 ANDAs till date
and received 47 approvals. The company, going forward, expects to keep its
momentum high in terms of number of filings, by filing around 10-12 ANDAs per
annum. For FY2016-18E, we expect exports to register a CAGR of 13.6%, mainly
on back of base effect impact of FY2016 (sales grew by 46% due to launch of
Abilify).
Outlook and valuation: Over FY2016-18E, we expect the company to post a
CAGR of 13.9% in sales, while profitability will be under pressure on back of
higher R&D spend, which is likely to reach 13-14% of sales in FY2017-FY2018E.
We recommend a Neutral rating on the stock.
August 4, 2016
4
Alembic Pharma | 1QFY2017 Result Update
Exhibit 6: Key assumptions
FY2017E
FY2018E
Domestic formulation sales growth (%)
16.0
14.0
Exports sales growth (%)
8.0
20.0
R&D as % of sales
14.0
13.0
Operating margins (%)
20.2
21.4
Capex (` cr)
400
200
Net Debt/Equity (x)
(0.1)
(0.2)
Source: Company, Angel Research
Exhibit 7: Recommendation summary
Reco.
CMP Tgt Price Upside
FY2018E
FY16-18E
FY2018E
(`)
(`)
(%) PE (x) EV/Sales (x) EV/EBITDA (x)
CAGR in EPS (%) RoCE (%) RoE (%)
Alembic Pharma
Neutral
622
-
-
20.5
2.7
12.8
(10.8)
27.5
25.3
Aurobindo Pharma Buy
749
877
17.2
15.8
2.6
11.0
18.1
22.5
26.1
Cadila Healthcare
Buy
347
399
15.3
17.4
2.6
11.8
15.8
24.3
26.6
Cipla
Neutral
529
-
-
19.5
2.5
13.4
20.4
13.5
15.2
Dr Reddy's
Neutral
2,942
-
-
18.6
2.7
10.9
6.9
18.1
17.1
Dishman Pharma
Neutral
164
-
-
15.8
1.7
8.0
(1.1)
9.6
10.2
GSK Pharma*
Neutral
3,139
-
-
52.9
6.8
36.2
15.9
35.8
31.8
Indoco Remedies
Sell
313
225
(19.6)
20.1
2.3
12.8
31.5
19.1
19.2
Ipca labs
Buy
508
613
20.6
25.8
1.8
11.7
17.9
11.8
14.9
Lupin
Accumulate
1,680
1,809
7.7
24.2
4.0
14.9
17.2
24.4
20.9
Sanofi India
Neutral
4,545
-
-
26.9
3.4
19.5
21.2
24.9
28.4
Sun Pharma
Buy
838
944
12.6
25.6
5.2
16.7
22.0
33.1
18.9
Source: Company, Angel Research; Note: *December year end
Company Background
Alembic Pharmaceuticals is a leading pharmaceutical company in India. The
company is vertically integrated to develop pharmaceutical substances and
intermediates. The company is a market leader in the Macrolides segment of
anti-infective drugs in India. Its manufacturing facilities are located in Vadodara
and in Baddi (Himachal Pradesh; for the domestic and non-regulated export
market). The Panelav facility houses the API and formulation manufacturing (both
USFDA approved) plants.
August 4, 2016
5
Alembic Pharma | 1QFY2017 Result Update
Profit & Loss Statement (Consolidated)
Y/E March (` cr)
FY2014
FY2015
FY2016
FY2017E
FY2018E
Gross sales
1,871
2,064
3,181
3,522
4,128
Less: Excise duty
8
11
36
39
45
Net sales
1,863
2,053
3,145
3,483
4,083
Other operating income
3.2
5.7
3.6
3.6
3.6
Total operating income
1,866
2,058
3,149
3,487
4,087
% chg
22.8
10.3
53.0
10.7
17.2
Total expenditure
1,506
1,653
2,143
2,779
3,210
Net raw materials
713
715
769
1,045
1,225
Other mfg costs
82
90
138
153
180
Personnel
247
307
421
506
607
Other
463
542
814
1,075
1,198
EBITDA
358
400
1,002
704
873
% chg
43.7
11.7
150.9
(29.7)
24.0
(% of Net Sales)
19.2
19.5
31.9
20.2
21.4
Depreciation& amortisation
40
44
72
99
120
Interest & other charges
10
2
4
10
11
Other income
0
0
6
-
-
(% of PBT)
0
0
-
-
-
Share in profit of Associates
-
-
-
-
-
Recurring PBT
308
360
936
596
743
% chg
49.4
16.8
160.2
(36.3)
24.7
Extraordinary expense/(Inc.)
-
-
-
-
-
PBT (reported)
308
360
936
596
743
Tax
75
76
216
137
171
(% of PBT)
24.4
21.2
23.1
23.0
23.0
PAT (reported)
236
283
720
459
572
Add: Share of earnings of asso.
-
-
(0)
-
-
Less: Minority interest (MI)
-
-
-
-
-
Prior period items
-
-
-
-
-
PAT after MI (reported)
236
283
720
459
572
ADJ. PAT
236
283
720
459
572
% chg
43.0
20.0
154.1
(36.2)
24.7
(% of Net Sales)
12.7
13.8
22.9
13.2
14.0
Basic EPS (`)
12.5
15.0
38.2
24.3
30.4
Fully Diluted EPS (`)
12.5
15.0
38.2
24.3
30.4
% chg
43.0
20.0
154.1
(36.2)
24.7
August 4, 2016
6
Alembic Pharma | 1QFY2017 Result Update
Balance Sheet (Consolidated)
Y/E March (` cr)
FY2014
FY2015
FY2016
FY2017E
FY2018E
SOURCES OF FUNDS
Equity share capital
37.7
37.7
37.7
37.7
37.7
Preference Capital
-
-
-
-
-
Reserves & surplus
638
847
1,563
1,967
2,485
Shareholders funds
676
885
1,601
2,005
2,523
Minority Interest
-
-
-
-
-
Other Long Term Liabilities
12.7
15.8
33.9
14.3
14.3
Long Term Provisions
6.7
6.4
7.4
7.4
7.4
Total loans
78
239
133
150
150
Deferred tax liability
23
31
50
50
50
Total liabilities
795
1,177
1,824
2,227
2,744
APPLICATION OF FUNDS
Gross block
665
907
1,208
1,608
1,808
Less: acc. depreciation
268
313
385
483
603
Net block
397
595
824
1,125
1,206
Capital work-in-progress
21
-
-
-
-
Goodwill
35
44
Long Term Loans and Adv.
42
118
83
83
83
Investments
3.4
2.3
2.1
3.3
3.3
Current assets
755
891
1,507
1,955
2,554
Cash
24
55
451
398
729
Loans & advances
147
120
409
453
531
Other
584
716
647
1,104
1,294
Current liabilities
422
464
635
940
1,102
Net current assets
333
426
872
1,015
1,452
Mis. Exp. not written off
-
-
-
-
-
Total assets
795
1,177
1,824
2,227
2,744
August 4, 2016
7
Alembic Pharma | 1QFY2017 Result Update
Cash Flow Statement (Consolidated)
Y/E March (` cr)
FY2014
FY2015
FY2016 FY2017E FY2018E
Profit before tax
308
360
936
596
743
Depreciation
40
44
72
99
120
(Inc)/Dec in Working Capital
(84)
66
191
(358)
169
Less: Other income
-
-
-
-
-
Direct taxes paid
75
76
216
137
171
Cash Flow from Operations
190
393
982
199
861
(Inc.)/Dec.in Fixed Assets
(81)
(222)
(301)
(400)
(200)
(Inc.)/Dec. in Investments
-
-
-
-
-
Other income
-
-
-
-
-
Cash Flow from Investing
(81)
(222)
(301)
(400)
(200)
Issue of Equity
-
-
-
-
-
Inc./(Dec.) in loans
(109)
164
(87)
(2)
-
Dividend Paid (Incl. Tax)
(55)
(55)
(55)
(55)
(55)
Others
(34)
184
160
51
51
Cash Flow from Financing
(197)
293
19
(6)
(4)
Inc./(Dec.) in Cash
8
31
396
(53)
331
Opening Cash balances
16
24
55
451
398
Closing Cash balances
24
55
451
398
729
August 4, 2016
8
Alembic Pharma | 1QFY2017 Result Update
Key Ratios
Y/E March
FY2014
FY2015
FY2016
FY2017E
FY2018E
Valuation Ratio (x)
P/E (on FDEPS)
49.7
41.4
16.3
25.5
20.5
P/CEPS
42.4
35.8
14.8
21.0
16.9
P/BV
17.3
13.2
7.3
5.8
4.6
Dividend yield (%)
0.4
0.4
0.4
0.4
0.4
EV/Sales
6.3
5.8
3.6
3.3
2.7
EV/EBITDA
32.9
29.6
11.3
16.2
12.7
EV / Total Assets
14.8
10.0
6.2
5.1
4.0
Per Share Data (`)
EPS (Basic)
12.5
15.0
38.2
24.3
30.4
EPS (fully diluted)
12.5
15.0
38.2
24.3
30.4
Cash EPS
14.7
17.4
42.0
29.6
36.7
DPS
2.5
2.5
2.5
2.5
2.5
Book Value
35.8
46.9
84.9
106.4
133.8
DuPont Analysis
EBIT margin
17.0
17.3
29.6
17.4
18.5
Tax retention ratio
75.6
78.8
76.9
77.0
77.0
Asset turnover (x)
2.5
2.2
2.5
2.2
2.1
ROIC (Post-tax)
32.5
29.6
57.4
29.2
30.2
Cost of Debt (Post Tax)
5.6
0.9
1.5
5.4
5.4
Leverage (x)
0.2
0.1
0.0
0.0
0.0
Operating ROE
38.2
33.8
57.6
29.2
30.2
Returns (%)
ROCE (Pre-tax)
39.9
30.2
51.0
27.2
27.5
Angel ROIC (Pre-tax)
44.5
38.7
77.0
38.4
39.2
ROE
40.0
36.3
57.9
25.5
25.3
Turnover ratios (x)
Asset Turnover (Gross Block)
3.0
2.6
3.0
2.5
2.4
Inventory / Sales (days)
56.5
61.5
54.1
70.5
78.4
Receivables (days)
49.5
56.3
43.5
56.3
62.3
Payables (days)
79.8
79.3
37.8
41.7
46.9
WC cycle (ex-cash) (days)
58.6
60.3
45.9
54.3
59.8
Solvency ratios (x)
Net debt to equity
0.1
0.2
(0.2)
(0.1)
(0.2)
Net debt to EBITDA
0.2
0.5
(0.3)
(0.4)
(0.7)
Interest Coverage (EBIT / Int.)
32.3
199.5
252.8
61.3
71.8
August 4, 2016
9
Alembic Pharma | 1QFY2017 Result Update
Research Team Tel: 022 - 39357800
DISCLAIMER
Angel Broking Private Limited (hereinafter referred to as “Angel”) is a registered Member of National Stock Exchange of India Limited,
Bombay Stock Exchange Limited and Metropolitan Stock Exchange Limited. It is also registered as a Depository Participant with CDSL
and Portfolio Manager with SEBI. It also has registration with AMFI as a Mutual Fund Distributor. Angel Broking Private Limited is a
registered entity with SEBI for Research Analyst in terms of SEBI (Research Analyst) Regulations, 2014 vide registration number
INH000000164. Angel or its associates has not been debarred/ suspended by SEBI or any other regulatory authority for accessing
/dealing in securities Market. Angel or its associates/analyst has not received any compensation / managed or co-managed public
offering of securities of the company covered by Analyst during the past twelve months.
This document is solely for the personal information of the recipient, and must not be singularly used as the basis of any investment
decision. Nothing in this document should be construed as investment or financial advice. Each recipient of this document should
make such investigations as they deem necessary to arrive at an independent evaluation of an investment in the securities of the
companies referred to in this document (including the merits and risks involved), and should consult their own advisors to determine
the merits and risks of such an investment.
Reports based on technical and derivative analysis center on studying charts of a stock's price movement, outstanding positions and
trading volume, as opposed to focusing on a company's fundamentals and, as such, may not match with a report on a company's
fundamentals. Investors are advised to refer the Fundamental and Technical Research Reports available on our website to evaluate the
contrary view, if any.
The information in this document has been printed on the basis of publicly available information, internal data and other reliable
sources believed to be true, but we do not represent that it is accurate or complete and it should not be relied on as such, as this
document is for general guidance only. Angel Broking Pvt. Limited or any of its affiliates/ group companies shall not be in any way
responsible for any loss or damage that may arise to any person from any inadvertent error in the information contained in this report.
Angel Broking Pvt. Limited has not independently verified all the information contained within this document. Accordingly, we cannot
testify, nor make any representation or warranty, express or implied, to the accuracy, contents or data contained within this document.
While Angel Broking Pvt. Limited endeavors to update on a reasonable basis the information discussed in this material, there may be
regulatory, compliance, or other reasons that prevent us from doing so.
This document is being supplied to you solely for your information, and its contents, information or data may not be reproduced,
redistributed or passed on, directly or indirectly.
Neither Angel Broking Pvt. Limited, nor its directors, employees or affiliates shall be liable for any loss or damage that may arise from
or in connection with the use of this information.
Disclosure of Interest Statement
Alembic Pharma
1. Financial interest of research analyst or Angel or his Associate or his relative
No
2. Ownership of 1% or more of the stock by research analyst or Angel or associates or relatives
No
3. Served as an officer, director or employee of the company covered under Research
No
4. Broking relationship with company covered under Research
No
Ratings (Based on expected returns
Buy (> 15%)
Accumulate (5% to 15%)
Neutral (-5 to 5%)
over 12 months investment period):
Reduce (-5% to -15%)
Sell (< -15)
August 4, 2016
10