3QCY2015 Result Update | Cement
October 27, 2015
ACC
BUY
CMP
`1,397
Performance Highlights
Target Price
`1,630
Quarterly results (Standalone)
Investment Period
12 Months
Y/E Dec (` cr)
3QCY2015
2QCY2015
% chg qoq 3QCY2014
% chg yoy
Net revenue
2,740
2,961
(7.5)
2,742
(0.1)
Stock Info
Operating profit
314
334
(6.0)
379
(17.2)
Sector
Cement
OPM (%)
11.4%
11.3%
10bp
13.8%
(236bp)
Market Cap (` cr)
26,221
Net profit
117
131
(10.9)
205
(42.9)
Source: Company, Angel Research
Net Debt (` cr)
(2,217)
Beta
0.8
ACC’s net sales during 3QCY2015 remained flat yoy at `2,740cr, but were
52 Week High / Low
1775/1303
above our expectation of `2,686cr. Volumes declined by 0.2% yoy to 5.61mt (vs
Avg. Daily Volume
315,151
our expectation of 5.56mt); and realization/tonne declined by 1.8% yoy to `4,438
Face Value (`)
10
(in line with our estimate of `4,429), mainly due to muted demand for cement.
BSE Sensex
27,362
The EBITDA at `313.6cr has come in above our estimate of `244.8cr on account
of cost efficiency measures followed by the company in terms of incurring lower
Nifty
8,261
power and employee costs. Hence, the EBIDTA margin for the quarter, at 11.4%,
Reuters Code
ACC.BO
is also above our expectation of 9.1%. The net profit saw a decline of 42.9% yoy
Bloomberg Code
ACC IN
to `117cr, weighed down by lower other income.
EBITDA margin dips 236bp yoy to 11.4%: For 3QCY2015, ACC reported an
Shareholding Pattern (%)
EBITDA of `313.6cr, a decrease of 17.2% yoy, but is above our estimate of
Promoters
50.3
`244.8cr. The EBITDA came in higher than our estimate, led by lower power and
MF / Banks / Indian Fls
13.2
employee costs. The total operating cost increased by 1.7% yoy to `2,476.2cr, led
FII / NRIs / OCBs
17.7
by 5.1% and 11.9% yoy increase in net raw material and other expenses,
respectively. The EBITDA margin fell by 236bp yoy to 11.4%; the same is above
Indian Public / Others
18.8
our expectation of 9.1%. Strong RMC sales and a modest increase in operating
costs delivered the better than expected EBIDTA margin during the quarter. The
Abs. (%)
3m 1yr
3yr
EBITDA/tonne declined by 17% yoy to `559 but was ahead of our estimate of
`440.
Sensex
2.7
1.9
46.9
ACC
(0.7)
(5.8)
(0.1)
Outlook and valuation: Going ahead, we expect ACC’s bottom-line to grow at a
CAGR of
22.2% over CY2014-17E, considering capacity addition and
operational efficiency post commissioning of new capacity in the east region. We
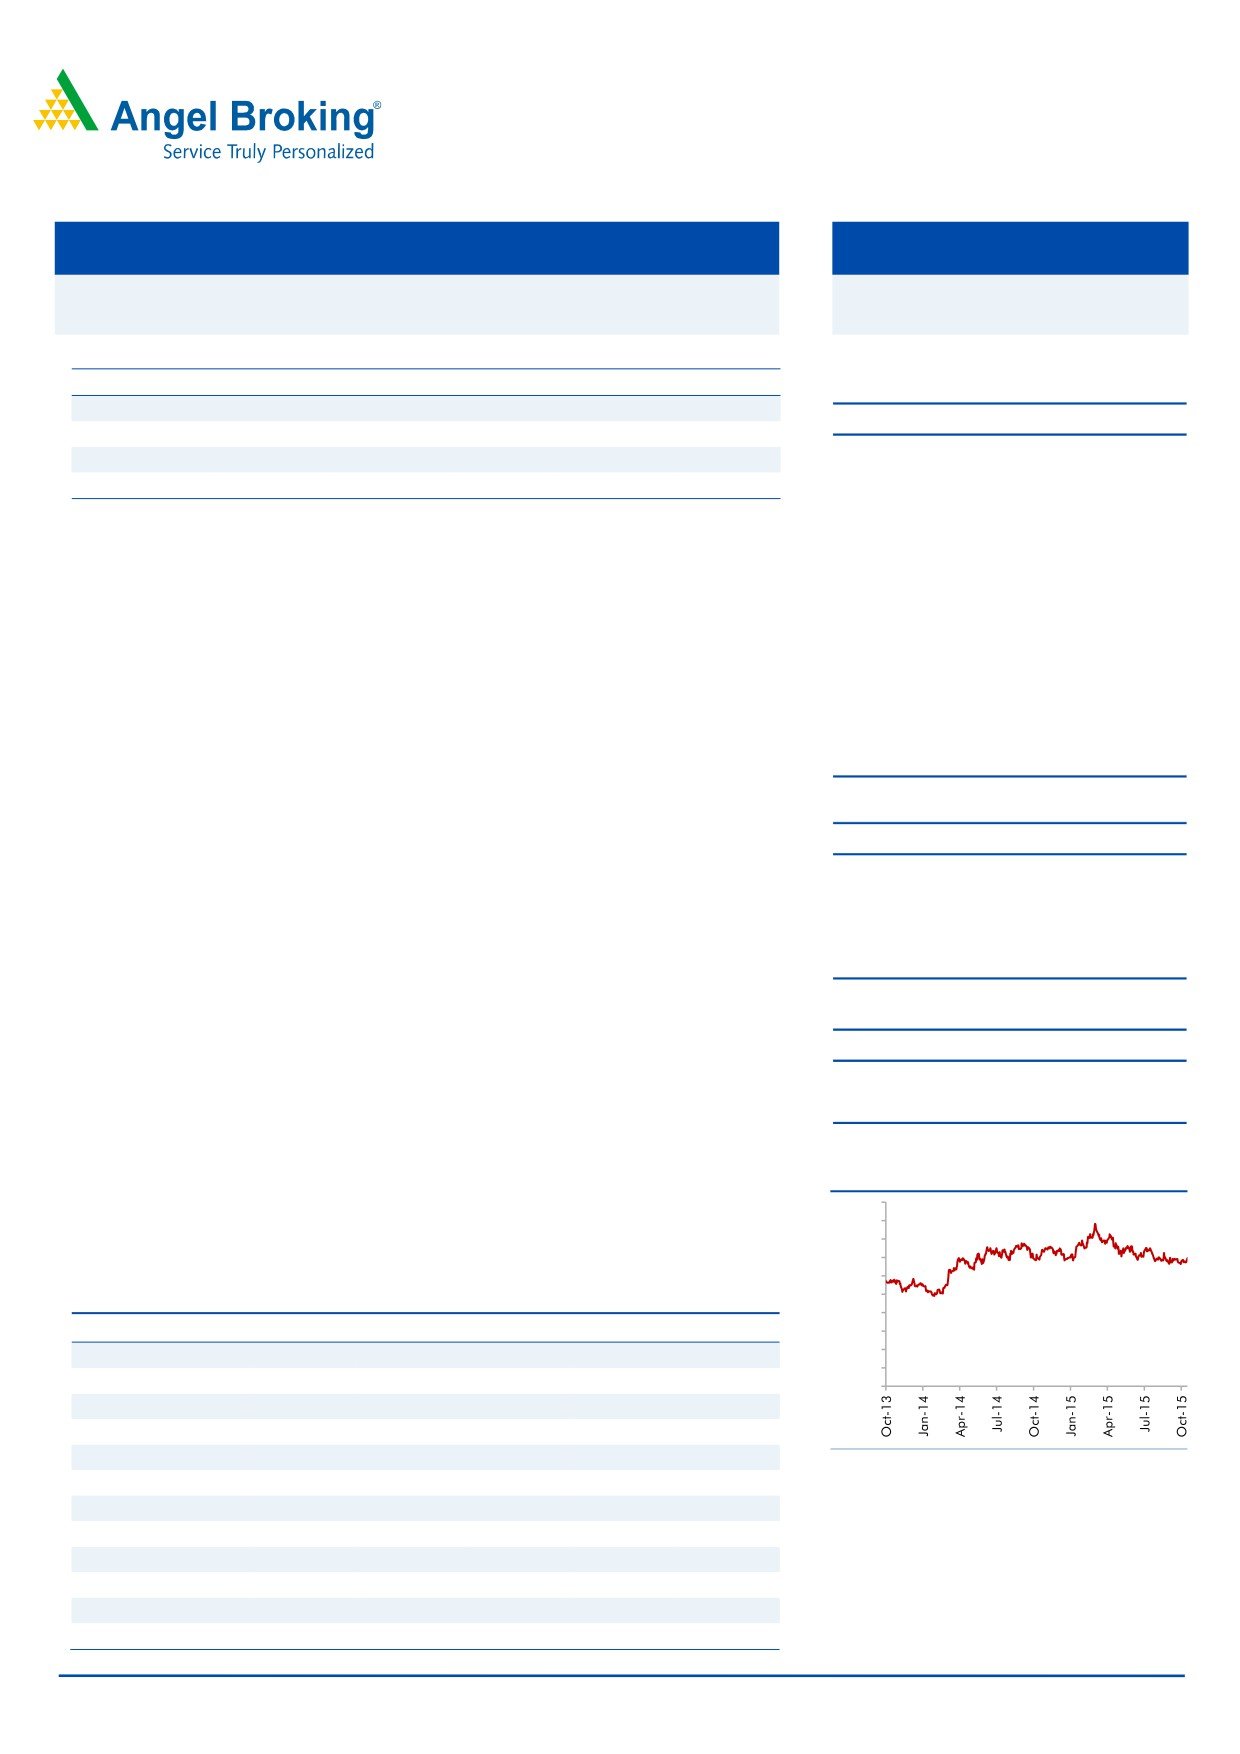
3-year price chart
have introduced estimates for CY2017E and recommend a Buy rating on the
2,000
1,800
stock with a revised target price of `1,630 on 10x EV/EBIDTA and EV/tonne of
1,600
US$120 on CY2017E installed capacity.
1,400
1,200
1,000
Key financials (Standalone)
800
Y/E December ( ` cr)
CY2013
CY2014
CY2015E CY2016E CY2017E
600
400
Net Sales
10,908
11,481
11,738
13,151
14,757
200
% chg
(1.8)
5.2
2.2
12.0
12.2
0
Net Profit
880
934
871
1,201
1,568
% chg
(33.0)
6.1
1.4
37.9
30.6
FDEPS (`)
46.8
49.7
46.4
64.0
83.5
Source: Company, Angel Research
OPM
14.9
13.1
14.1
16.4
18.3
P/E(x)
29.9
30.6
30.2
21.9
16.8
P/BV(x)
3.4
3.2
3.0
2.8
2.6
RoE(%)
14.4
10.7
10.3
13.3
16.1
RoCE(%)
12.3
10.8
11.1
14.6
18.2
Shrenik C. Gujrathi
EV/Sales (x)
2.1
2.0
2.1
1.9
1.6
022-39357800 Extn: 6872
EV/EBITDA
14.3
15.2
14.6
11.3
8.6
Source: Company, Angel Research; Note: CMP as of October 26, 2015.
Please refer to important disclosures at the end of this report
1
ACC | 3QCY2015 Result Update
Exhibit 1: Quarterly Performance (Standalone)
Y/E March (` cr)
3QCY2015
2QCY2015
% Chg 3QFY2014
% Chg
9MCY2015
9MCY2014
% Chg
Net sales
2,740
2,961
(7.5)
2,742
(0.1)
8,587
8,718
(1.5)
Net raw-material costs
373
475
(21.5)
355
5.1
1,238
1,311
(5.6)
(% of sales)
13.6
16.0
12.9
14.4
15.0
Power & fuel
618
610
1.4
625
(1.1)
1,850
1,855
(0.3)
(% of sales)
22.6
20.6
22.8
21.5
21.3
Staff costs
166
200
(17.1)
192
(13.3)
537
554
(3.1)
(% of sales)
6.1
6.8
7.0
6.3
6.4
Freight & forwarding
613
740
(17.1)
596
2.8
2,038
1,939
5.1
(% of sales)
22.4
25.0
21.7
23.7
22.2
Other expenses
684
629
8.7
611
11.9
1,880
1,844
1.9
(% of sales)
25.0
21.2
22.3
21.9
21.2
Total Expenditure
2,476
2,682
(7.7)
2,436
1.65
7,630
7,647
(0.2)
Operating Profit
314
334
(6.0)
379
(17.2)
1,116
1,254
(11.0)
OPM
11.4
11.3
13.8
13.0
14.4
Interest
15
14
5.0
11
30.8
52
33
55.4
Depreciation
161
166
(3.0)
139
15.3
496
414
20.0
Other income
18
23
(23.5)
45
(59.7)
399
372
7.4
PBT
156
177
(12.0)
272
(42.8)
808
996
(18.9)
Provision for taxation
39
46
(14.9)
67
(42.4)
166
151
9.6
(% of PBT)
24.9
25.8
24.8
20.5
15.2
PAT but before exceptional item
117
131
(10.9)
205
(42.9)
642
845
(24.0)
Exceptional item
0
0
0
153
0
PAT after exceptional item
117
131
(10.9)
205
(42.9)
489
845
(42.1)
PATM
4.3
4.4
7.5
5.7
9.7
Reported EPS (`)
6.2
7.0
10.9
26.0
39.0
Source: Company, Angel Research
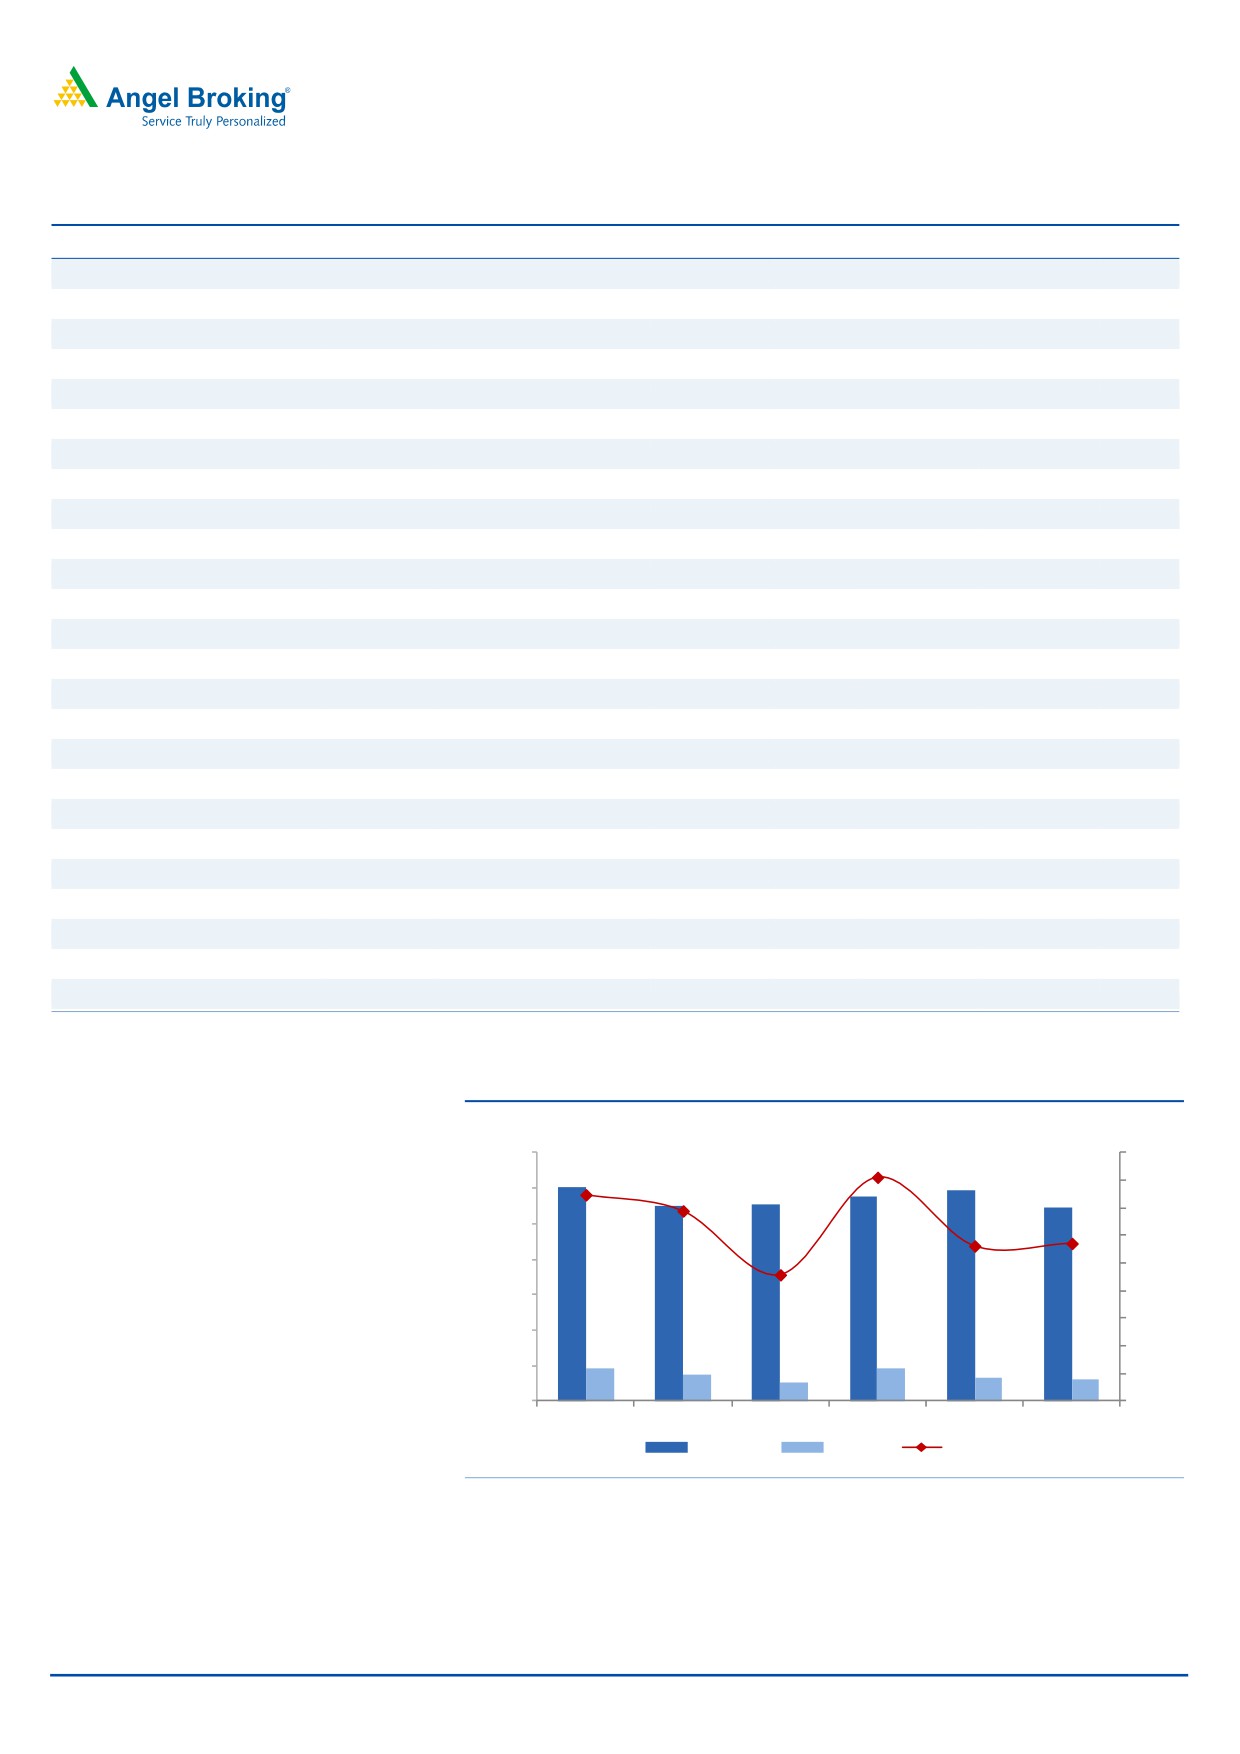
Exhibit 2: Financial performance
(`cr)
(%)
3,500
18.0
3,009
2,742
2,961
16.0
3,000
2,763
2,885
16.2
2,740
15.0
14.0
2,500
13.8
12.0
11.3
11.4
2,000
10.0
1,500
9.2
8.0
6.0
1,000
451
469
4.0
379
334
314
500
253
2.0
0
0.0
2QCY14
3QCY14
4QCY14
1QCY15
2QCY15
3QCY15
Net Sales
EBITDA
EBITDA %
Source: Company, Angel Research
October 27, 2015
2
ACC | 3QCY2015 Result Update
Exhibit 3: 3QCY2015 - Actual vs Angel estimates
(` cr)
Actual
Estimates
Variation (%)
Net sales
2,740
2,686
2.0
Operating profit
314
245
28.1
OPM (%)
11.4
9.1
235bp
Adjusted PAT
117
107
9.9
Source: Company, Angel Research
Performance highlights
Top-line remained flat yoy
For 3QCY2015, ACC’s top-line remained flat yoy at `2,740cr, which is above our
estimate of `2,685.7cr. Cement volumes remained flat yoy to 5.61mt (as against
our estimate of 5.56mt). Realization/tonne declined by 1.8 yoy (but increased 1.2%
qoq) to `4,438 (in line with our estimate of `4,429), due to muted demand for
cement during the period. ACC’s volumes declined by 4% yoy during 9MCY2015;
however, going forward, we expect demand for cement to improve gradually over
the next couple of quarters, with the government increasing focus on infrastructure
development and promising new projects including “Smart Cities” and “Housing
for All”. We expect the company’s top-line to grow at a CAGR of 8.7% during
CY2014-17, with new capacity addition (2.5mtpa grinding unit at Jamul) in the
east region.
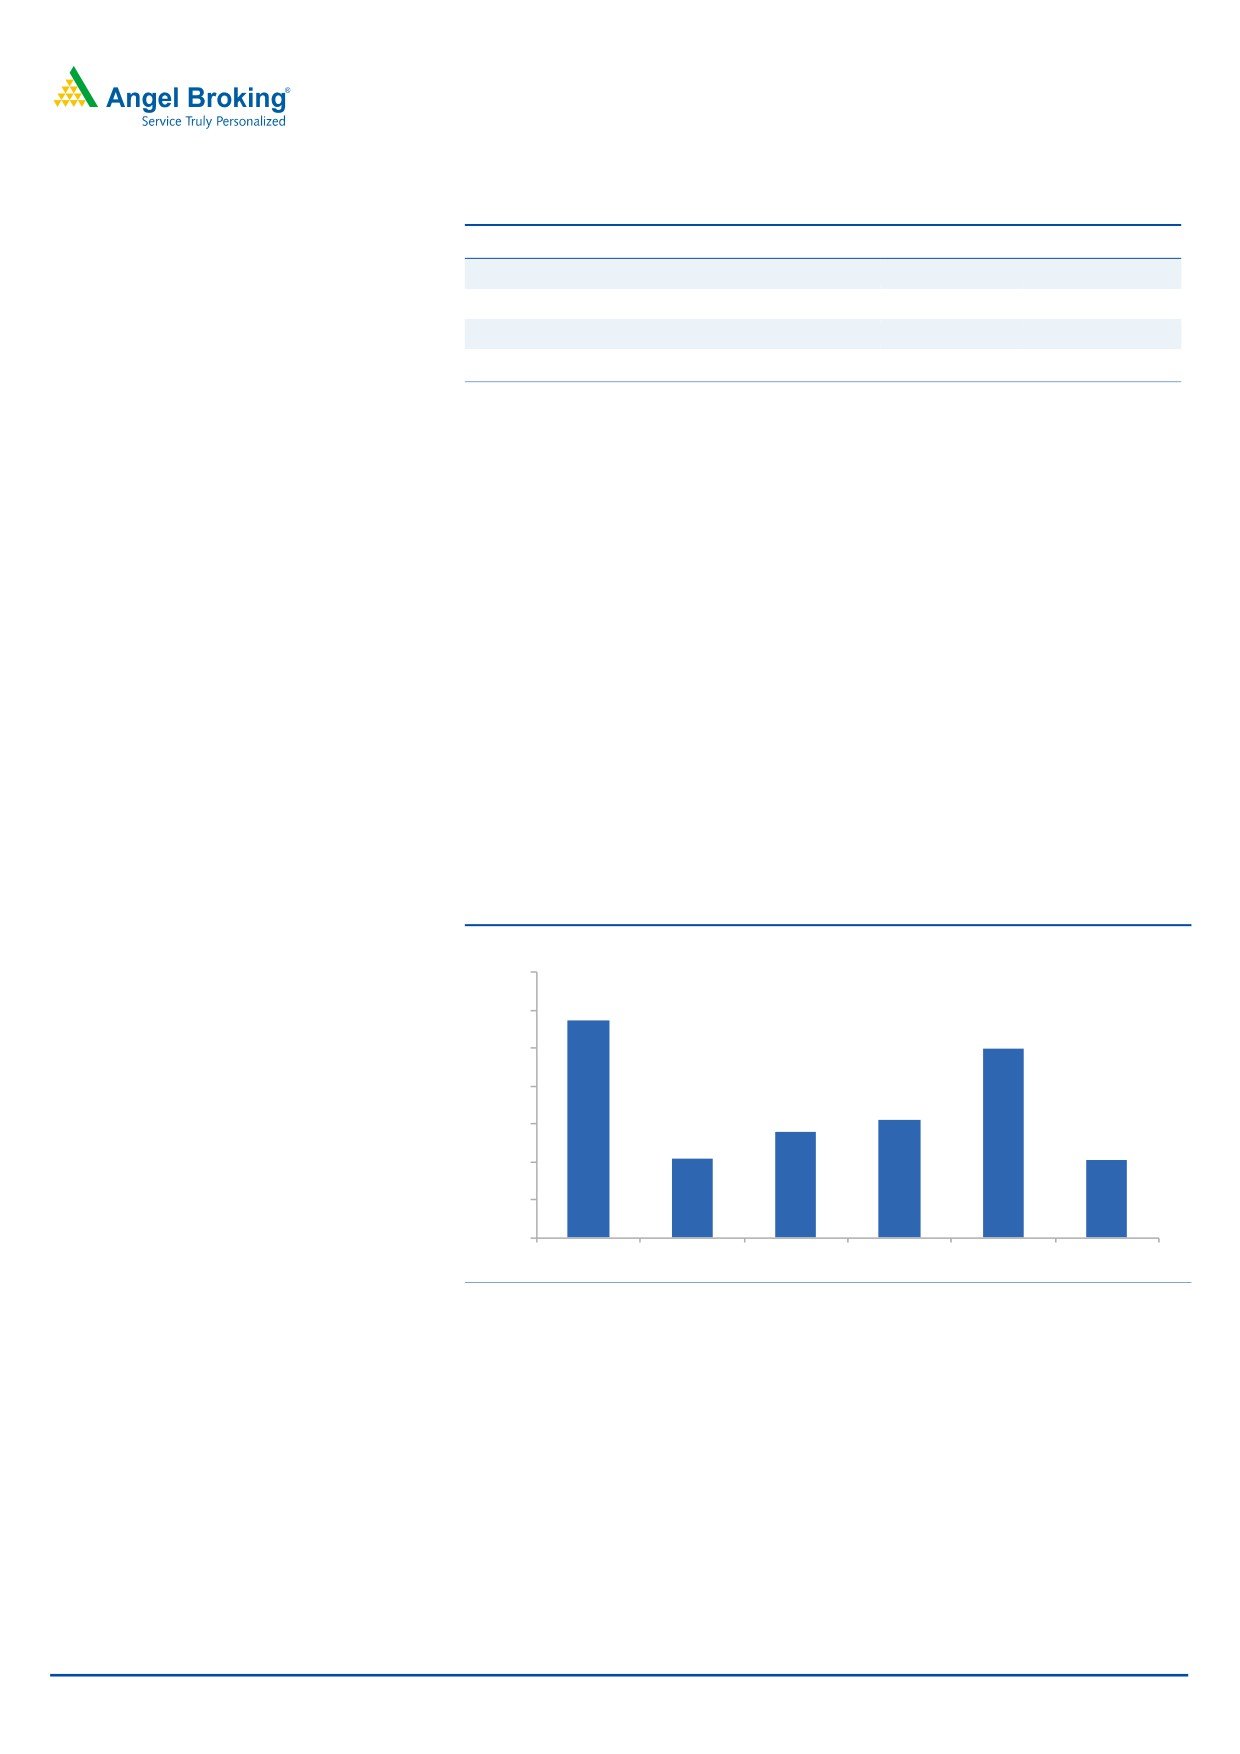
Exhibit 4: Volume performance
(mn tn)
6.6
6.4
6.4
6.2
6.2
6.0
5.8
5.8
5.8
5.6
5.6
5.6
5.4
5.2
2QCY14
3QCY14
4QCY14
1QCY15
2QCY15
3QCY15
Source: Company, Angel Research
EBITDA/tonne declines by 17.0% yoy
The EBIDTA margin for the quarter fell by 236bp yoy to 11.4% but was better than
our estimate of
9.1%, on account of lower employee expenses. The total
cost/tonne increased by 1.8% yoy to `4,414, led by increase in net raw material
and other expenses, which increased by 5.1% and 11.9% yoy respectively. Other
expenses increase on account of DMF provisions as per requirements of the New
MMDR Act. The EBITDA/tonne came in at `559, a decline of 17% yoy, due to
lower realization and higher raw material and other expenses/tonne.
October 27, 2015
3
ACC | 3QCY2015 Result Update
Per-tonne analysis
During 3QCY2015, ACC’s realization/tonne fell by 1.8% yoy. On the costs front,
raw material cost/tonne increased by 5.3% yoy, while power and fuel cost/tonne
declined by 0.9% yoy mainly due to lower diesel prices. Freight cost/tonne rose by
3% yoy but declined 8.4% qoq as no busy season surcharge was imposed by
Indian Railways. The company’s operating profit/tonne fell by 17% yoy to `559
during the quarter.
Exhibit 5: Per tonne analysis
Particulars (`/tonne)
3QCY2015 2QCY2015 3QCY2014 qoq chg (%) yoy chg (%)
Net Realization/tonne
4,438
4,385
4,521
1.2
(1.8)
Raw-Material* Cost/tonne
664
766
631
(13.3)
5.3
Power and Fuel cost/tonne
1,102
984
1,113
12.0
(0.9)
Freight Cost/tonne
1,093
1,193
1,061
(8.4)
3.0
Operating costs/tonne
4,414
4,325
4,334
2.0
1.8
Operating Profit/tonne
559
538
674
3.9
(17.0)
Source: Company, Angel Research
Change in estimates
We have revised our CY2015/16E numbers following disappointing 3QCY2015
results and delay in commissioning of its new plant. We have reduced our cement
volume estimate by
1.4%/6.7% to
23.4/24.7mt for CY2015/16E. Revenue
estimate has also been revised down by 1.0/6.7% for CY2015/16. The EBITDA
estimate has also been downgraded by 16.9/23.2% for CY2015/16, due to
increase in operating cost. Hence, we expect the EBITDA margin to be adversely
impacted by 230/320bp during CY2015/16 as compared to our earlier estimate.
Exhibit 6: Change in estimate
CY2015E
CY2016E
CY2017E
( ` cr )
Revised Earlier
% chg Revised Earlier
% chg
New
Volume (mn tn)
23.43
23.77
(1.4)
24.72
26.49
(6.7)
26.37
Net Sales
11,738
11,856
(1.0)
13,151
14,092
(6.7)
14,757
EBITDA
1,429
1,720
(16.9)
1,921
2,502
(23.2)
2450
EBITDA (%)
12.2
14.5
(230bp)
14.6
17.8
(320bp)
16.6
Net Profit
871
894
(2.6)
1201
1430
(16.0)
1568
Source: Company, Angel Research
October 27, 2015
4
ACC | 3QCY2015 Result Update
Investment rationale
Update on capacity addition plans: ACC, which currently has capacity of 30mtpa,
is expanding its capacity by 3mtpa in the east region of India. The new plant at
Jamul, Chhattisgarh is expected to be delayed by one quarter and now the
production from its 2.8mtpa clinker capacity will start by the end of CY2015 and
grinding production from Jamul and Sindhri unit is expected to commence from
1QCY2016. We do not expect the company to get full benefit from this new
capacity before 2QCY2016.
Outlook and valuation
We expect ACC to register a top-line CAGR of
8.7% over CY2014-17E,
considering capacity addition and improving cement demand, going forward. The
bottom-line is expected to grow at a CAGR of 22.2% over the same period. We
have introduced estimates for CY2017E and provide a Buy rating on the stock with
a target price of `1,630 on 10x EV/EBIDTA and EV/tonne of US$120 on CY2017E
installed capacity.
October 27, 2015
5
ACC | 3QCY2015 Result Update
Company Background
In 2005, ACC was acquired by the world's second largest cement company,
Holcim. Currently, the Holcim Group in India (ACC and Ambuja Cements taken
together) has the largest cement capacity in the country (57mtpa). ACC has a
standalone total capacity of 30mtpa, with 16 cement plants spread across the
country. Similar to UltraTech, the company is also a pan-India player but with a
southern inclination (33% of its total capacity is in south as against 20% in north,
20% in east and northeast, 15% in central and 12% in west).
October 27, 2015
6
ACC | 3QCY2015 Result Update
Profit and loss statement (Standalone)
Y/E December (` cr)
CY2013
CY2014
CY2015E CY2016E CY2017E
Net Sales
10,908
11,481
11,738
13,151
14,757
Other operating income
261
257
231
241
253
Total operating income
11,169
11,738
11,969
13,392
15,010
% chg
(1.5)
5.1
2.0
11.9
12.1
Total Expenditure
9,540
10,231
10,309
11,230
12,308
Net Raw Materials
1,861
1,971
1,919
2,082
2,282
Power and Fuel
2,382
2,442
2,445
2,642
2,875
Personnel
662
747
784
847
897
Freight & Forwarding charges
2,316
2,598
2,669
2,956
3,311
EBITDA
1,629
1,507
1,660
2,162
2,703
% chg
(25.3)
(7.5)
10.1
30.2
25.0
(% of Net Sales)
14.9
13.1
14.1
16.4
18.3
Depreciation& Amortisation
574
558
662
770
832
EBIT
1,055
950
998
1,392
1,871
% chg
(34.9)
(10.0)
5.1
39.5
34.4
(% of Net Sales)
9.7
8.3
8.5
10.6
12.7
Interest & other Charges
52
83
86
49
49
Other Income
224
268
333
373
419
(% of PBT)
18.2
23.6
26.8
21.7
18.7
Recurring PBT
1,227
1,135
1,245
1,716
2,240
% chg
(30.7)
(7.5)
9.6
37.9
30.6
Exceptional item
(216)
(309)
(0)
-
-
Tax
131
(33)
373
515
672
(% of PBT)
10.7
(2.9)
30.0
30.0
30.0
Reported PAT
1,096
1,168
871
1,201
1,568
% chg
(20.6)
6.6
(25.4)
37.9
30.6
(% of Net Sales)
10.0
10.2
7.4
9.1
10.6
Adj. PAT
879.8
859.1
871.1
1,201.1
1,568.1
Basic EPS (`)
46.8
45.7
46.4
63.9
83.4
Fully Diluted EPS (`)
46.8
45.7
46.4
63.9
83.4
% chg
(46.7)
(2.3)
1.4
37.9
30.6
October 27, 2015
7
ACC | 3QCY2015 Result Update
Balance sheet (Standalone)
Y/E December (`cr)
CY2013
CY2014
CY2015E CY2016E CY2017E
SOURCES OF FUNDS
Equity Share Capital
188
188
188
188
188
Reserves& Surplus
7,637
8,048
8,512
9,151
9,986
Shareholders Funds
7,825
8,236
8,700
9,339
10,174
Total Loans
-
-
-
-
-
Deferred Tax Liability
507
536
536
536
536
Total Liabilities
8,739
8,771
9,235
9,875
10,710
APPLICATION OF FUNDS
Gross Block
10,400
10,997
12,497
13,997
14,597
Less: Acc. Depreciation
4,896
5,484
6,147
6,916
7,748
Net Block
5,504
5,513
6,351
7,081
6,849
Capital Work-in-Progress
820
2,000
800
300
200
Investments
2,194
1,573
1,573
1,573
1,573
Current Assets
3,576
3,585
4,116
4,965
6,565
Inventories
1,121
1,256
1,653
1,805
1,990
Sundry Debtors
397
411
420
470
528
Cash
503
304
214
585
1,764
Other
1,554
1,615
1,829
2,104
2,282
Current liabilities
3,355
3,900
3,605
4,044
4,477
Net Current Assets
221
(315)
511
921
2,088
Mis. Exp. not written off
-
-
-
-
Total Assets
8,739
8,771
9,235
9,875
10,710
October 27, 2015
8
ACC | 3QCY2015 Result Update
Cash flow statement (Standalone)
Y/E December (`cr)
CY2013
CY2014
CY2015E CY2016E CY2017E
Profit before tax
1,227
1,135
1,245
1,716
2,240
Depreciation
574
558
662
770
832
Interest Expense
52
83
86
49
49
Change in Working Capital
(681)
337
(917)
(38)
12
Less: Other income
224
268
333
373
419
Direct taxes paid
131
(33)
373
515
672
Others
Cash Flow from Operations
816
1,877
370
1,609
2,043
(Inc)/ Dec in Fixed Assets
(689)
(1,778)
(300)
(1,000)
(500)
(Inc)/ Dec in Investments
360
621
-
-
-
Other income
224
268
333
373
419
Cash Flow from Investing
(106)
(889)
33
(627)
(81)
Issue of Equity
-
-
-
-
-
Inc./(Dec.) in loans
(137)
(407)
-
-
-
Dividend Paid (Incl. Tax)
411
402
407
562
733
Cash Flow from Financing
(549)
(808)
(407)
(562)
(733)
Others
337
379
86
49
49
Inc./(Dec.) in Cash
(175)
(199)
(90)
371
1,179
Opening Cash balances
678
503
304
214
585
Closing Cash balances
503
304
214
585
1,764
October 27, 2015
9
ACC | 3QCY2015 Result Update
Key ratios (Standalone)
Y/E December
CY2013
CY2014
CY2015E
CY2016E
CY2017E
Valuation Ratio (x)
P/E (on FDEPS)
29.9
30.6
30.2
21.9
16.8
P/CEPS
15.8
15.2
17.2
13.4
11.0
P/BV
3.4
3.2
3.0
2.8
2.6
Dividend yield (%)
1.3
1.3
1.3
1.8
2.4
EV/Sales
2.1
2.0
2.1
1.9
1.6
EV/EBITDA
14.3
15.2
14.6
11.3
8.6
EV / Total Assets
2.7
2.6
2.6
2.5
2.2
Per Share Data (`)
EPS (Basic)
46.8
45.7
46.4
63.9
83.4
EPS (fully diluted)
46.8
45.7
46.4
63.9
83.4
Cash EPS
88.8
91.8
81.6
104.9
127.7
DPS
18.9
18.4
18.7
25.8
33.6
Book Value
416.3
438.2
462.9
496.9
541.3
Dupont Analysis
EBIT margin
9.4
8.1
8.3
10.4
12.5
Tax retention ratio
89.3
102.9
70.0
70.0
70.0
Asset turnover (x)
1.9
1.6
1.5
1.6
1.6
ROIC (Post-tax)
16.2
13.3
9.0
11.9
14.4
Returns (%)
ROCE (Pre-tax)
12.3
10.8
11.1
14.6
18.2
Angel ROIC (Pre-tax)
20.8
18.8
17.3
19.8
25.6
ROE
14.4
10.7
10.3
13.3
16.1
Turnover ratios (x)
Asset Turnover (Gross Block)
1.1
1.1
1.0
1.0
1.0
Inventory / Sales (days)
37
37
45
47
46
Receivables (days)
11
13
13
12
12
Payables (days)
131
129
133
124
126
WC cycle (ex-cash) (days)
(20)
(14)
(5)
9
8
Solvency ratios (x)
Net debt to equity
(0.3)
(0.0)
(0.3)
(0.1)
(0.2)
Net debt to EBITDA
(1.5)
(0.2)
(1.3)
(0.3)
(0.7)
Interest Coverage (EBIT / Int.)
20.4
11.5
11.6
28.4
38.2
October 27, 2015
10
ACC | 3QCY2015 Result Update
Research Team Tel: 022 - 39357800
DISCLAIMER
Angel Broking Private Limited (hereinafter referred to as “Angel”) is a registered Member of National Stock Exchange of India Limited,
Bombay Stock Exchange Limited and Metropolitan Stock Exchange of India Limited. It is also registered as a Depository Participant with
CDSL and Portfolio Manager with SEBI. It also has registration with AMFI as a Mutual Fund Distributor. Angel Broking Private Limited is
a registered entity with SEBI for Research Analyst in terms of SEBI (Research Analyst) Regulations, 2014 vide registration number
INH000000164. Angel or its associates has not been debarred/ suspended by SEBI or any other regulatory authority for accessing
/dealing in securities Market. Angel or its associates including its relatives/analyst do not hold any financial interest/beneficial
ownership of more than 1% in the company covered by Analyst. Angel or its associates/analyst has not received any compensation /
managed or co-managed public offering of securities of the company covered by Analyst during the past twelve months. Angel/analyst
has not served as an officer, director or employee of company covered by Analyst and has not been engaged in market making activity
of the company covered by Analyst.
This document is solely for the personal information of the recipient, and must not be singularly used as the basis of any investment
decision. Nothing in this document should be construed as investment or financial advice. Each recipient of this document should
make such investigations as they deem necessary to arrive at an independent evaluation of an investment in the securities of the
companies referred to in this document (including the merits and risks involved), and should consult their own advisors to determine
the merits and risks of such an investment.
Reports based on technical and derivative analysis center on studying charts of a stock's price movement, outstanding positions and
trading volume, as opposed to focusing on a company's fundamentals and, as such, may not match with a report on a company's
fundamentals.
The information in this document has been printed on the basis of publicly available information, internal data and other reliable
sources believed to be true, but we do not represent that it is accurate or complete and it should not be relied on as such, as this
document is for general guidance only. Angel Broking Pvt. Limited or any of its affiliates/ group companies shall not be in any way
responsible for any loss or damage that may arise to any person from any inadvertent error in the information contained in this report.
Angel Broking Pvt. Limited has not independently verified all the information contained within this document. Accordingly, we cannot
testify, nor make any representation or warranty, express or implied, to the accuracy, contents or data contained within this document.
While Angel Broking Pvt. Limited endeavors to update on a reasonable basis the information discussed in this material, there may be
regulatory, compliance, or other reasons that prevent us from doing so.
This document is being supplied to you solely for your information, and its contents, information or data may not be reproduced,
redistributed or passed on, directly or indirectly.
Neither Angel Broking Pvt. Limited, nor its directors, employees or affiliates shall be liable for any loss or damage that may arise from
or in connection with the use of this information.
Note: Please refer to the important ‘Stock Holding Disclosure' report on the Angel website (Research Section). Also, please refer to the
latest update on respective stocks for the disclosure status in respect of those stocks. Angel Broking Pvt. Limited and its affiliates may
have investment positions in the stocks recommended in this report.
Disclosure of Interest Statement
ACC
1. Analyst ownership of the stock
No
2. Angel and its Group companies ownership of the stock
No
3. Angel and its Group companies' Directors ownership of the stock
No
4. Broking relationship with company covered
No
Note: We have not considered any Exposure below ` 1 lakh for Angel, its Group companies and Directors
Ratings (Returns):
Buy (> 15%)
Accumulate (5% to 15%)
Neutral (-5 to 5%)
Reduce (-5% to -15%)
Sell (< -15%)
October 27, 2015
11