4QFY2017 Result Update | Agrichemical
June 15, 2017
United Phosphorus
NEUTRAL
CMP
`849
Performance Highlights
Target Price
-
Y/E March (` cr)
4QFY2017
3QFY2017
% chg (qoq)
4QFY2016
% chg (yoy)
Investment Period
-
Net sales
5,341
3855
38.6
4434
20.5
Other income
147
164
(10.1)
89
65.9
Stock Info
Gross profit
2569
2052
25.2
2145
19.8
Sector
Agrichemical
Operating profit
1037
685
51.4
597
73.9
Market Cap (` cr)
43,142
Adj. net profit
740
457
62.0
208
256.2
Net Debt (` cr)
3,231
Source: Company, Angel Research,
Beta
1.0
United Phosphorus Ltd. (UPL) posted robust numbers for 4QFY2017. In sales, the
52 Week High / Low
822/491
company posted gross revenues of `5,341cr v/s `4,434cr in 4QFY2016, growth of
Avg. Daily Volume
1,14,734
20.5% yoy. The growth was driven by volumes (21% yoy), while dip in pricing was
Face Value (`)
2
around 4%, which coupled with exchange gains added 3% to the top-line rise. On
BSE Sensex
31,103
EBITDA front, the company posted an EBITDA of 19.4% v/s 13.5% in 4QFY2016.
Nifty
8,603
Along with this, dip of 6.1% in the depreciation & 65.9% yoy growth in other
Reuters Code
UNPO.BO
income aided the PBT to grow by 151.6% yoy. Consequently, PAT came in at
Bloomberg Code
UNTP@IN
`740cr v/s `208cr in 4QFY2016, growth of 256.2% yoy. The management has
maintained guidance of 12-15% revenue growth (owing to presence in fast-growing
countries) and 50-70bps improvement in EBITDA margin. We maintain our Neutral
Shareholding Pattern (%)
Promoters
27.7
rating on the stock.
MF / Banks / Indian Fls
14.0
Quarterly highlights: UPL posted robust numbers for 4QFY2017. In sales, the
FII / NRIs / OCBs
51.5
company posted gross revenues of `5,341cr v/s `4,434cr in 4QFY2016, growth of
Indian Public / Others
6.8
20.5% yoy. The growth was driven by volumes (21% yoy), while pricing growth was
around 4%, which coupled with exchange gains added 3% to the top-line rise. On
EBITDA front, the company posted an EBITDA of 19.4% v/s 13.5% in 4QFY2016.
Abs. (%)
3m 1yr
3yr
Along with this, dip of 6.1% in the depreciation & 65.9% yoy growth in other
Sensex
5.8
18.0
23.7
income aided the PBT to grow by 151.6% yoy. Consequently, PAT came in at
UPL
20.5
45.4
180.4
`740cr v/s `208cr in 4QFY2016, growth of 256.2% yoy.
Outlook and Valuation: We expect UPL to post a CAGR of 16.0% and 12.3% in its
sales and PAT respectively over FY2017-19E. At the current market price, we
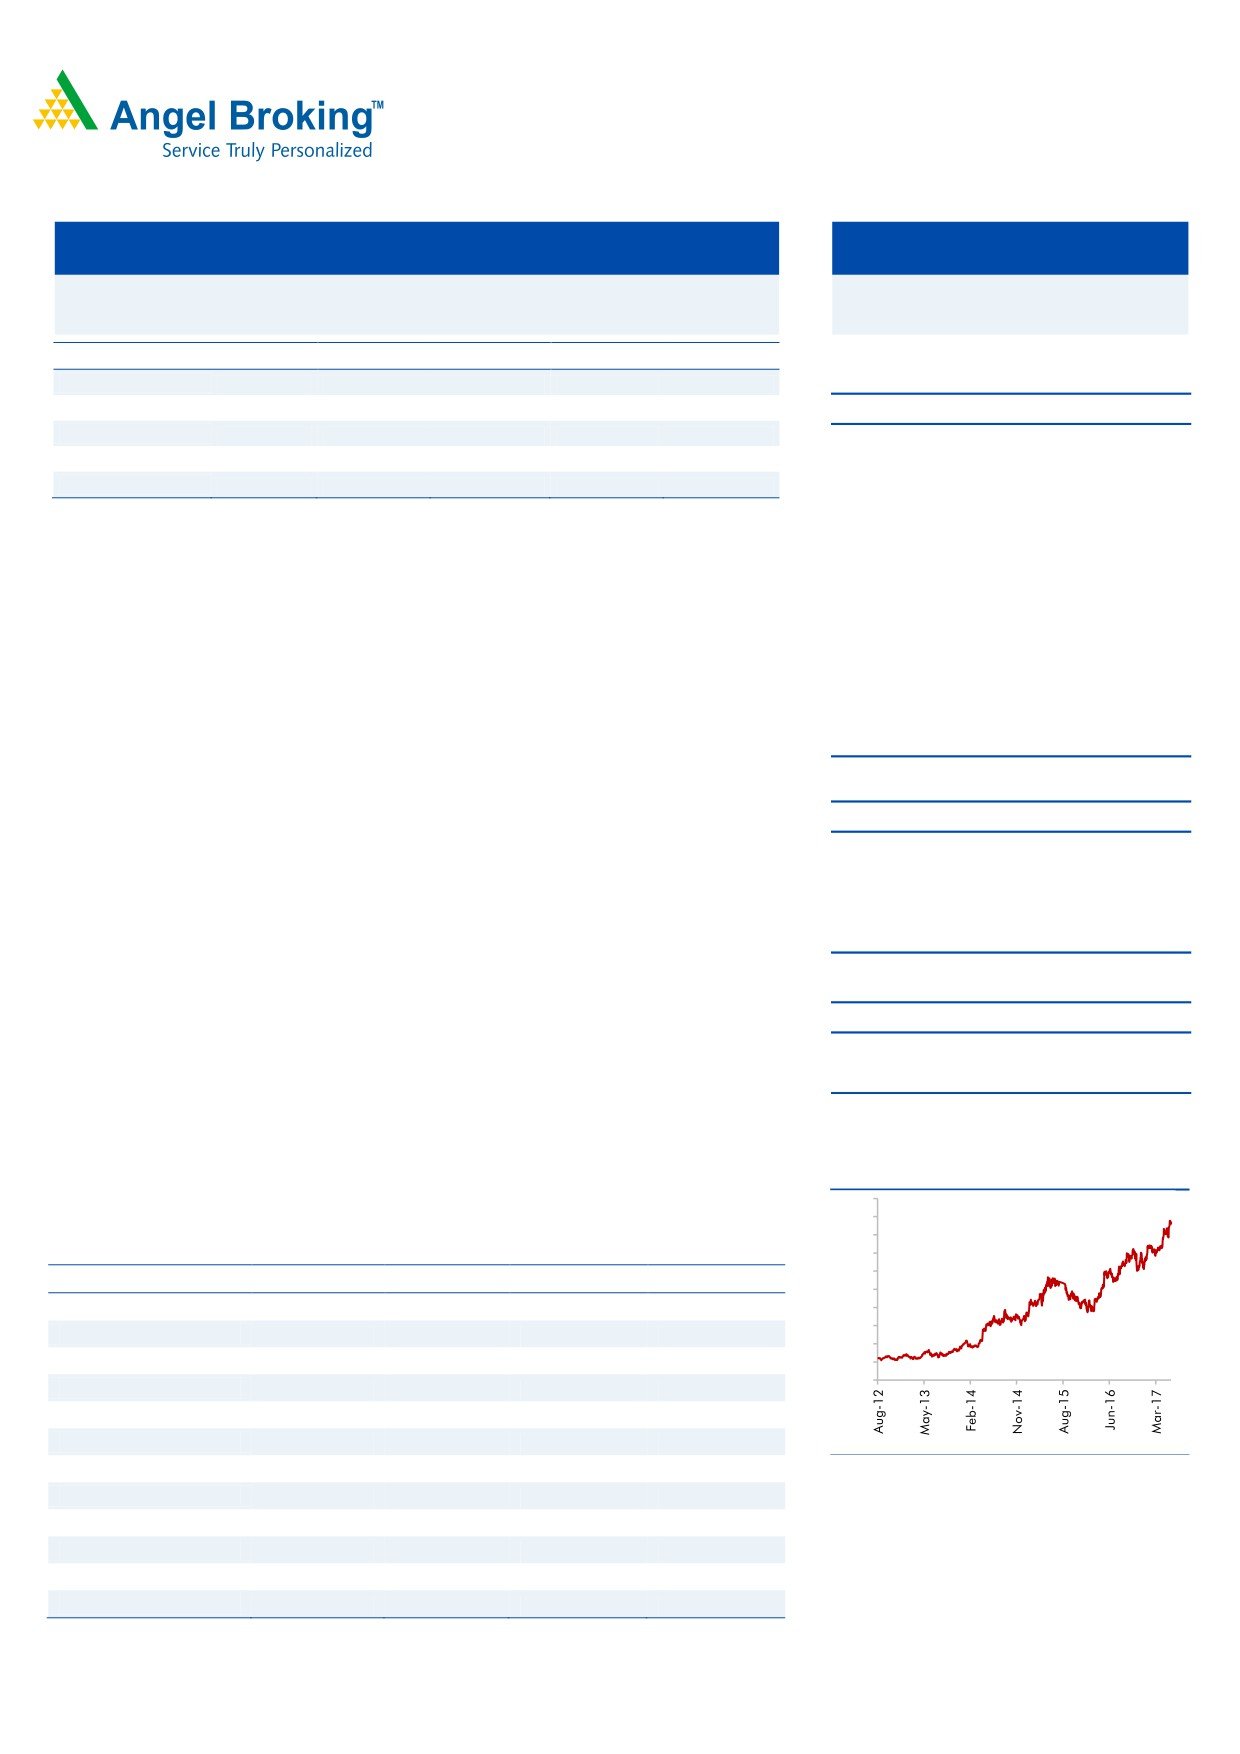
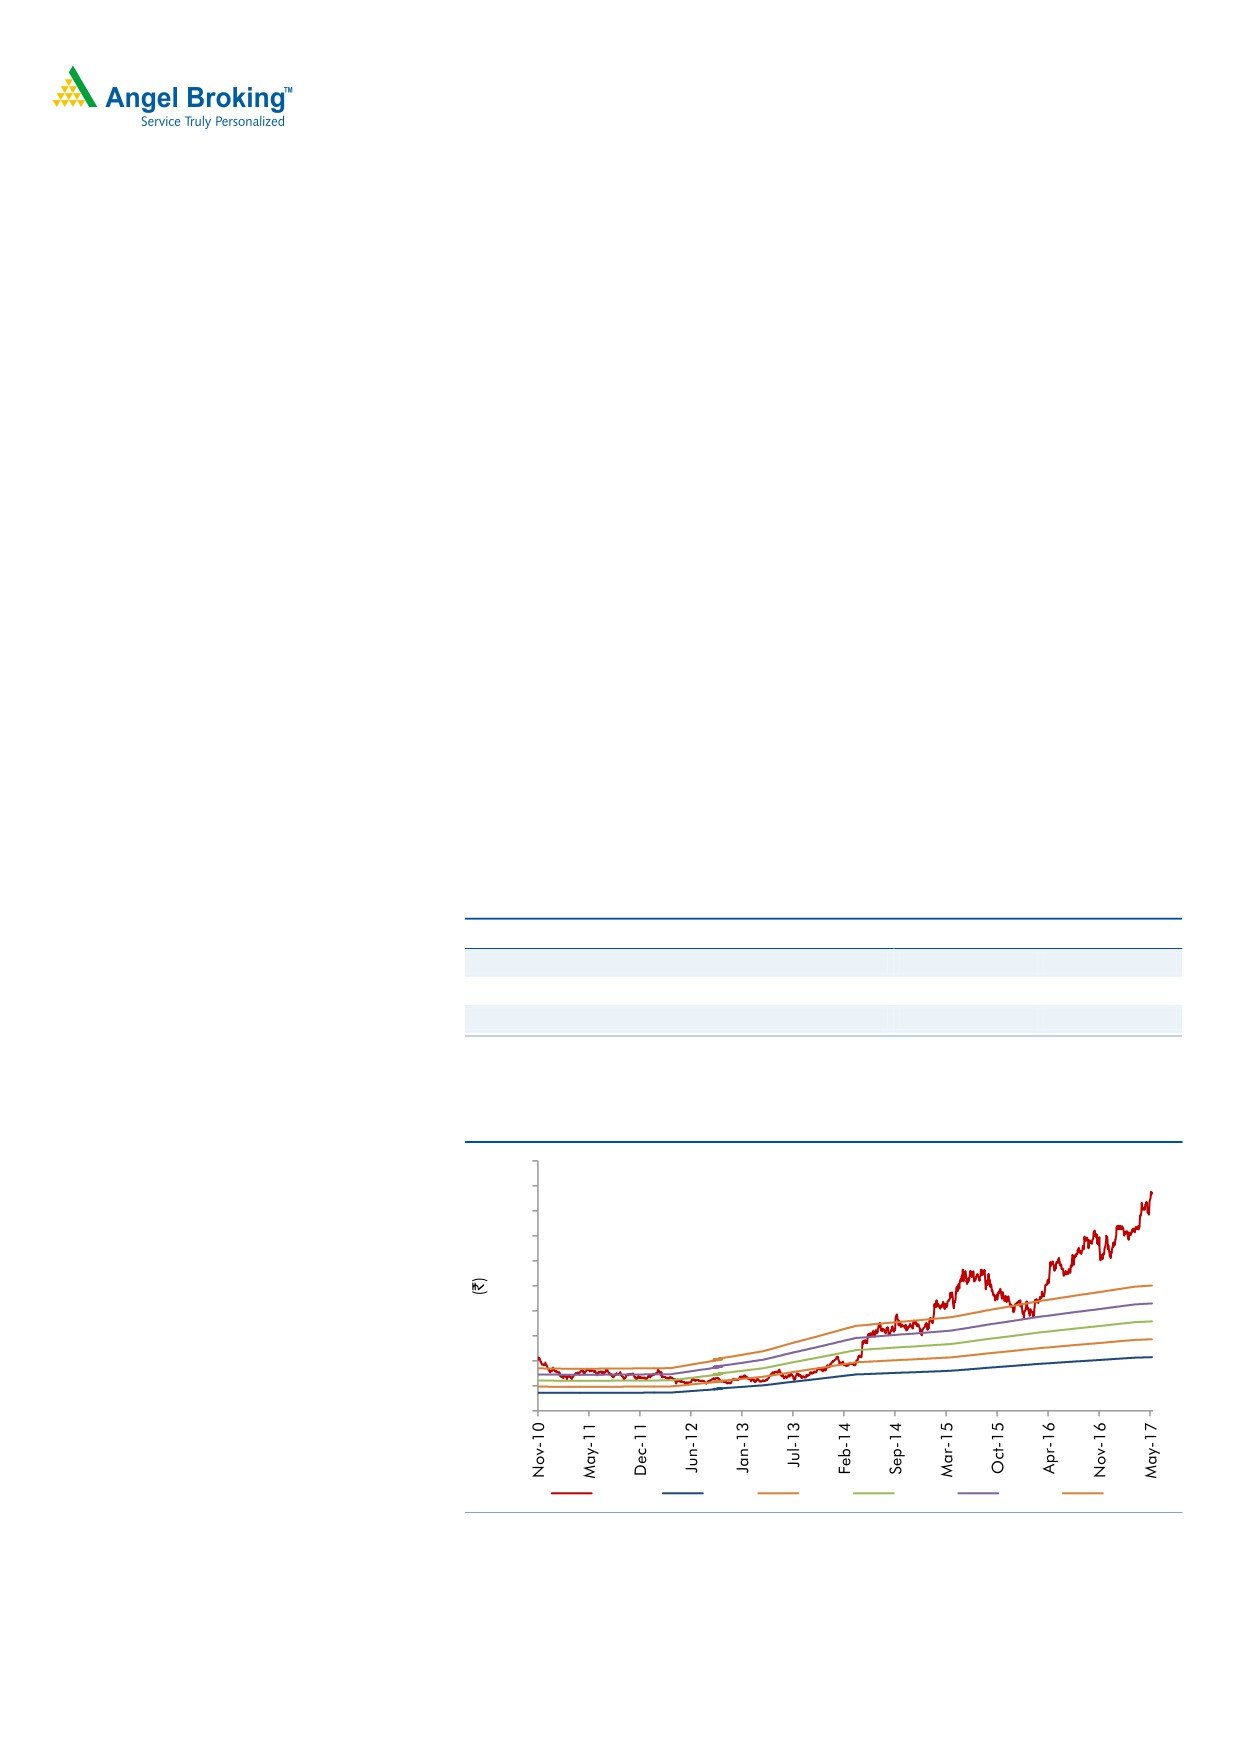
3-year price chart
1000
maintain our Neutral rating on the stock.
900
800
Key financials (Consolidated)
700
600
Y/E March (` cr)
FY2016
FY2017
FY2018E
FY2019E
500
Total revenue
13,083
16,312
18,922
21,949
400
300
% chg
9.8
24.7
16.0
16.0
200
Adj. profit
1,352
1,800
1,889
2,272
100
0
% chg
17.9
33.2
4.9
20.3
EBITDA (%)
18.5
17.8
17.8
17.8
EPS (`)
31.5
35.5
37.3
44.8
Source: Company, Angel Research
P/E (x)
26.9
23.9
22.8
19.0
P/BV (x)
5.4
10.5
8.8
7.3
RoE (%)
21.4
25.4
23.3
23.3
RoCE (%)
20.8
20.8
21.7
22.5
EV/Sales (x)
3.4
2.8
2.4
2.0
Sarabjit Kour Nangra
EV/EBITDA (x)
18.5
15.8
13.5
11.3
+91-22-3935 7800 ext. 6806
Source: Company, Angel Research; Note: CMP as of June 13, 2017
Please refer to important disclosures at the end of this report
1
United Phosphorus | 4QFY2017 Result Update
Exhibit 1: 4QFY2016 Performance (Consolidated)
Y/E March (` cr)
4QFY2017
3QFY2017
% chg (qoq)
4QFY2016
% chg (yoy)
FY2017
FY2016
% chg
Net sales
5,341
3,855
38.6
4,434
20.5
16,312
14,048
16.1
Other income
147
164
(10.1)
89
65.9
444
316
40.5
Total income
5,488
4,018
36.6
4,523
21.3
16,755
14,364
16.6
Gross profit
2569
2052
25.2
2145
19.8
8496
7268
16.9
Gross margin (%)
48.1
53.2
48.4
52.1
51.7
Operating profit
1037
685
51.4
597
73.9
2904
2266
28.2
Operating margin (%)
19.4
17.8
13.5
17.8
16.1
Financial cost
213
176
20.6
174
22.0
735
704
Depreciation
187
162
15.3
199
(6.1)
672
676
-0.6
PBT
785
511
53.7
312
151.6
1941
1202
61.5
Provision for taxation
56
46
79
-
189
165
14.6
PAT Before Exc. And MI
729
464
57.0
234
212.2
1753
1037
69.0
Minority Income/ ( Exp.)
1
3
8
6
12
Income from Associate/ (Exp)
13
(3)
(42)
(19)
(85)
Extra ordinary Income/( Exp.)
1
2
(19)
(73)
(111)
Reported PAT
741
459
61.4
184
302.6
1,727
940
83.8
Adjusted PAT
740
457
62.0
208
256.2
1800
1051
71.3
EPS (`)
14.6
9.0
4.8
35.5
24.5
Source: Company, Angel Research,
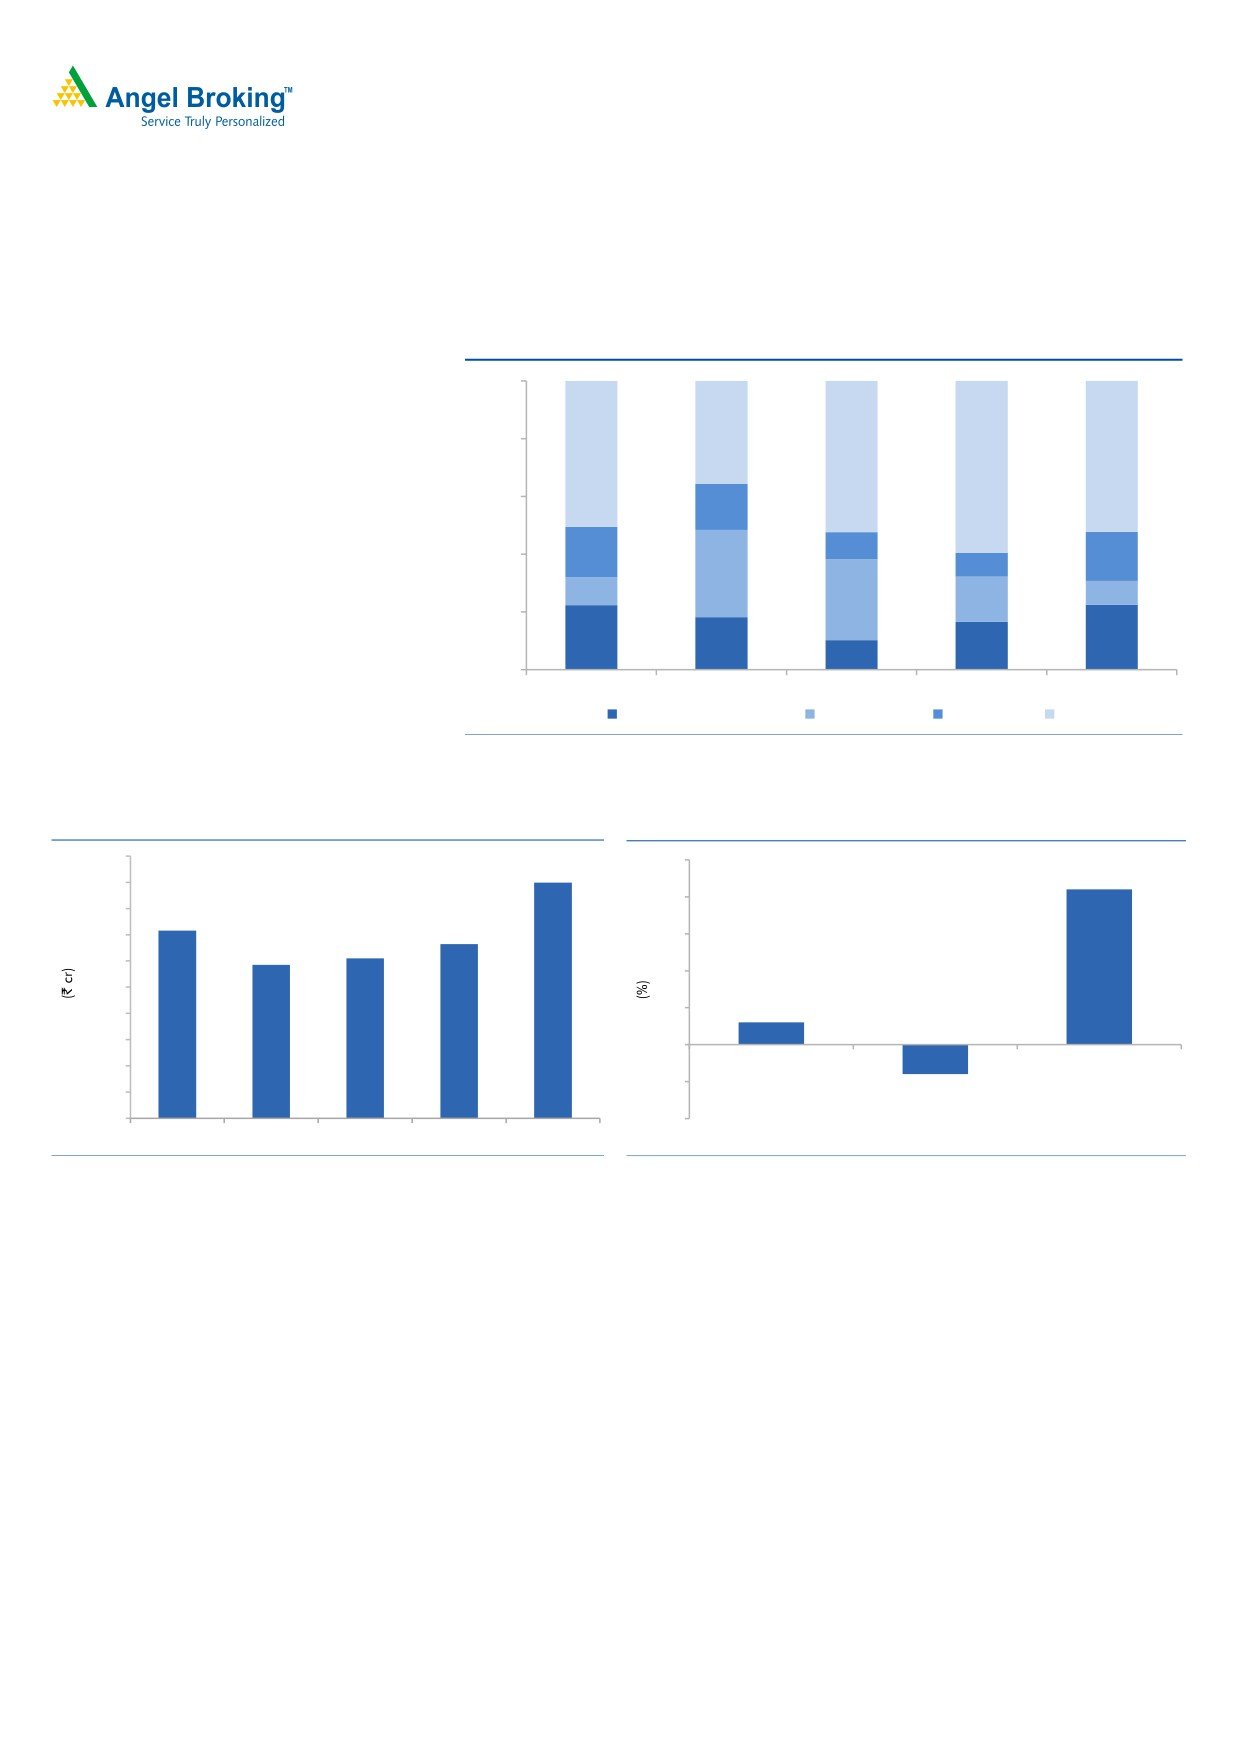
Top-line growth mainly led by ROW & North America
In sales, the company posted gross revenues of
`5,341cr v/s `4,434cr in
4QFY2016, growth of 20.5% yoy. The growth was driven by volume (21% yoy),
while pricing dip was around 4% and exchange gains added 3% to the top-line
rise. In terms of geography - Latin America (`1,646cr, up 17.0% yoy), India
(`442cr, rose by 6%), ROW (`1127cr, yoy rise of 28.0%), Europe (`916cr, yoy
growth of 21%). USA (`1,215cr), the key market, posted a yoy growth of 25.0%.
USA sales grew by 25% yoy, whereas the market grew by 1.1%. The company
launched three new products - two herbicides and one fungicide. Farm grower
income continues to be low, affecting consumption of inputs.
The ROW sales grew by 28% yoy, led by a better monsoon in Asia, especially
Australia after several years of drought. Company expanded its non-selective
herbicide to key markets, including China, and also established a distribution
partnership in Nigeria, resulting in significant growth.
Latin America sales grew by 17.0% despite the market declining by 6.6%. Low
disease pressure on soybean in Brazil led to reduced consumption of fungicides.
Company successfully launched eight new products in the LatAm market, which
comprised six herbicides, one fungicide and one insecticide. The company saw
higher penetration for resistant weeds in soybean.
Indian sales grew due to a better monsoon (except in Karnataka, Tamil Nadu,
parts of Andhra Pradesh and Maharashtra). The planted area increased
significantly for pulses and oilseeds, whereas cotton acreages reduced, especially
in the North. Brands like Ullala, Saaf and Phoskill have joined the `1,000cr club.
Company introduced biological and nutritional products and has achieved
substantial growth in vegetable and fruit crops over the previous year.
January 15, 2017
2
United Phosphorus | 4QFY2017 Result Update
European sales grew 21%, despite the market declining by 1.9%. The sugar beet
area in Europe increased by 15% yoy, which helped company’s portfolio grow.
Wet weather in North Europe resulted in high disease pressure on potatoes.
Exhibit 2: Sales break-up (Marketwise)
100%
1,250
80%
2,195
1,916
2,818
2,372
60%
562
341
40%
757
916
329
1,060
417
442
1,026
626
20%
971
1,215
638
660
375
0%
4QFY2016
1QFY2017
2QFY2017
3QFY2017
4QFY2017
North America
India
EU
Others
Source: Company
Exhibit 3: Sales performance (including export incentives)
Exhibit 4: Growth break-up
6000
25
5,391
21
5400
20
4800
4,292
3,987
4200
15
3,658
3,510
3600
10
3000
5
3
2400
1800
0
1200
(5)
600
(4)
0
(10)
4QFY2016 1QFY2017 2QFY2017 3QFY2017 4QFY2017
Exchange impact
Realisation
Volume
Source: Company, Angel Research
Source: Company, Angel Research
January 15, 2017
3
United Phosphorus | 4QFY2017 Result Update
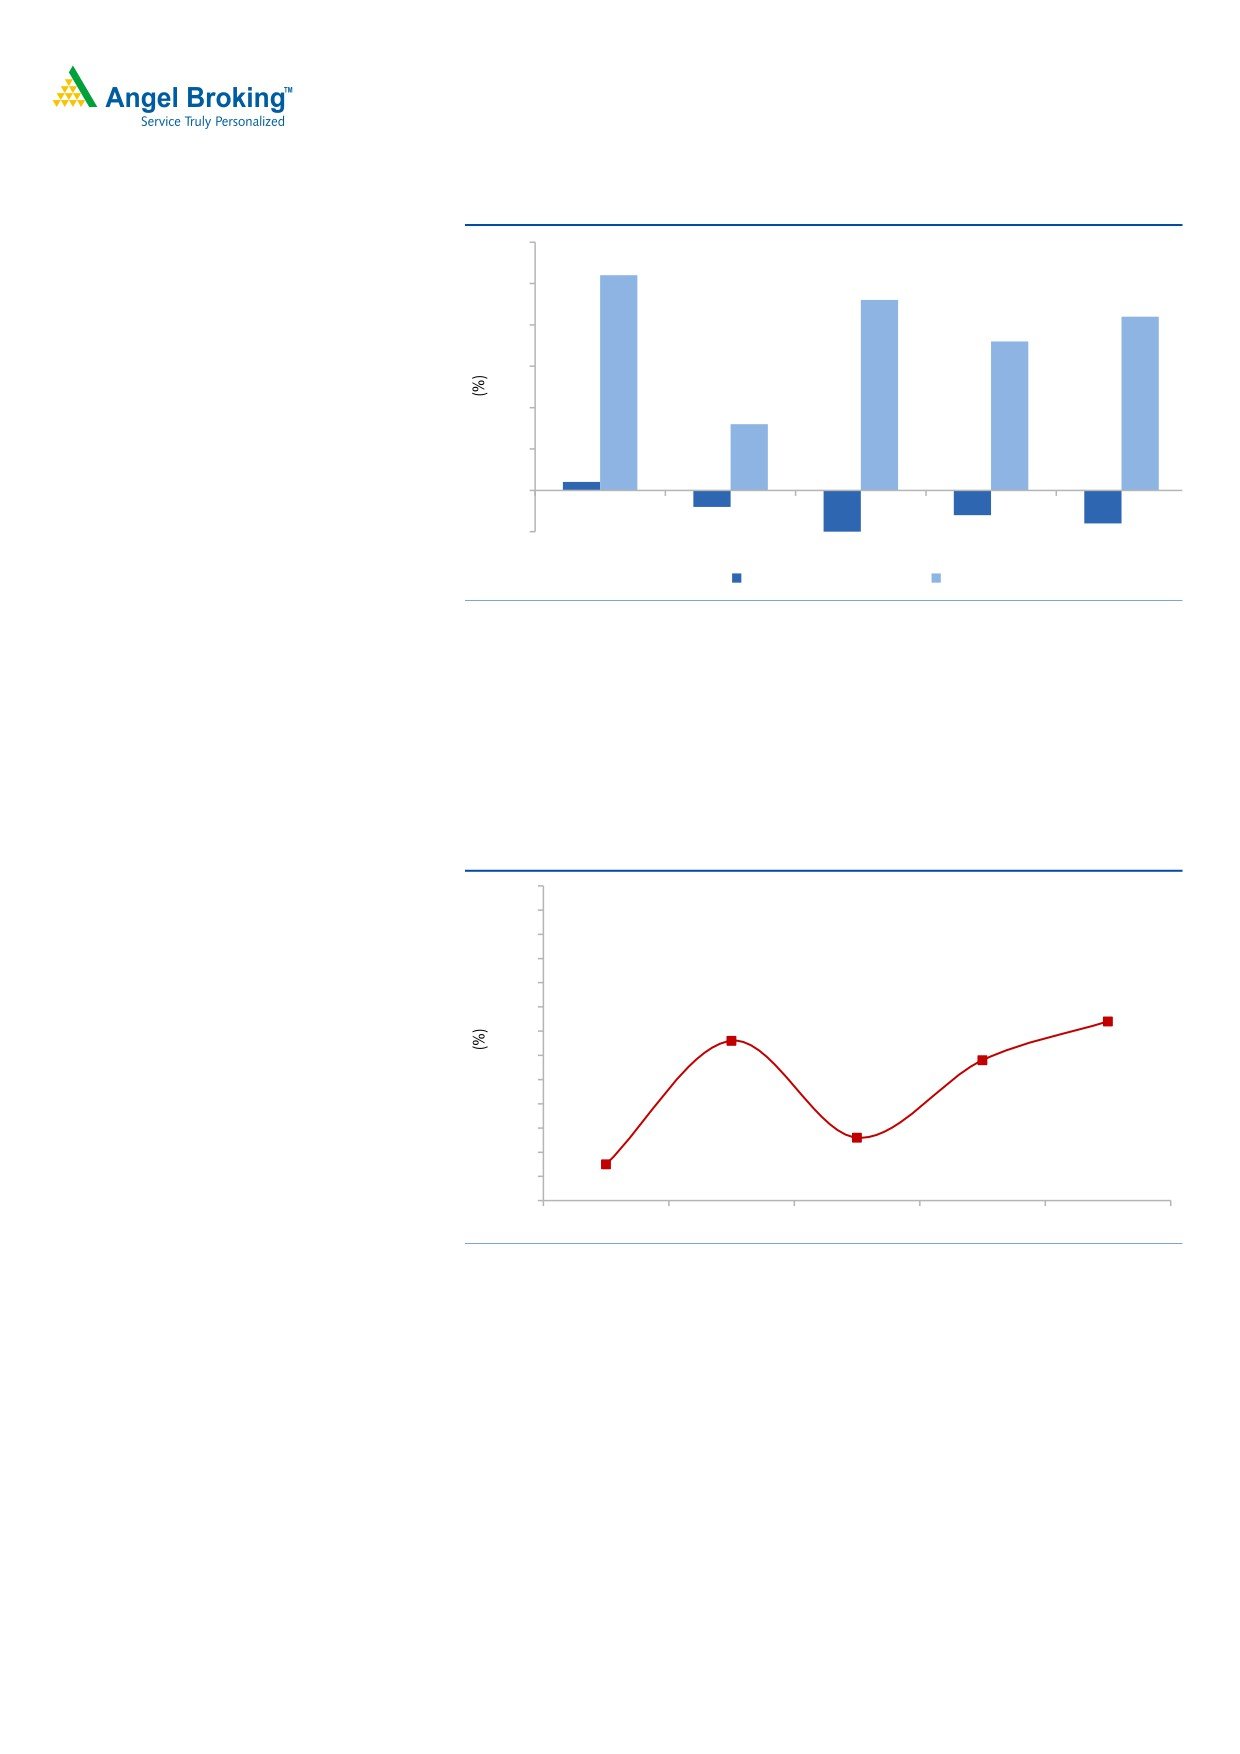
Exhibit 5: Volume and realization break-up (yoy)
30
26
25
23
21
20
18
15
10
8
5
1
(5)
(3)
(4)
0
(2)
(5)
4QFY2016
1QFY2017
2QFY2017
3QFY2017
4QFY2017
Realisation
Volume
Source: Company, Angel Research
EBITDA margin expands
On EBITDA front, the company posted an EBITDA of 19.4% v/s 13.5% in
4QFY2016. The expansion in OPM was more than the gross margin expansion,
on the back of employee expenses, which rose only by 7.4% yoy.
Exhibit 6: EBITDA margin trend
25.0
24.0
23.0
22.0
21.0
20.0
19.0
19.4
18.0
18.6
17.0
17.8
16.0
15.0
14.0
14.6
13.0
13.5
12.0
4QFY2016
1QFY2017
2QFY2017
3QFY2017
4QFY2017
Source: Company, Angel Research
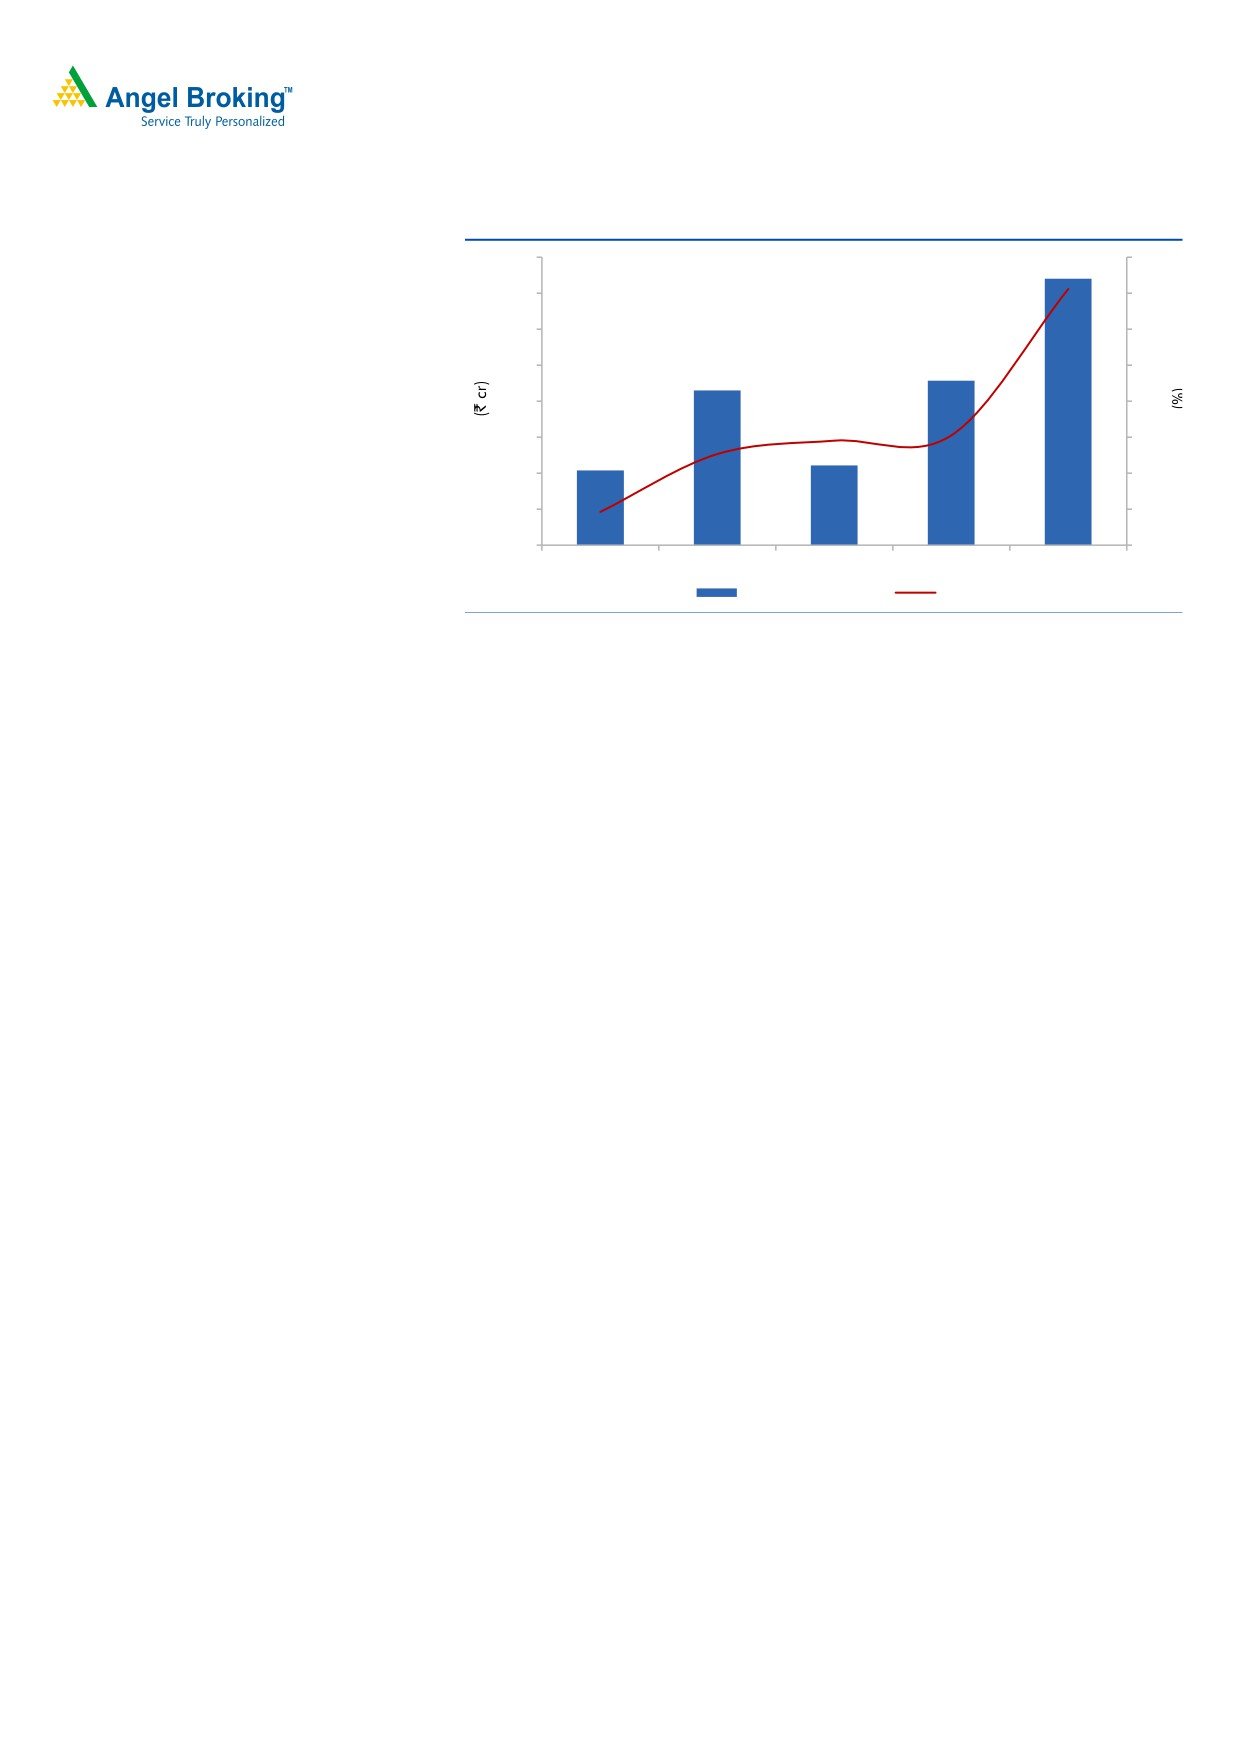
Adjusted Net Profit grew 256.4% yoy
Along with this, dip of 6.1% in the deprecation & 65.9% yoy growth in other
income aided the PBT to grow by 151.6% yoy. Consequently, PAT came in at
`740cr v/s `208cr in 4QFY2016, growth of 256.2% yoy.
January 15, 2017
4
United Phosphorus | 4QFY2017 Result Update
Exhibit 7: Adjusted PAT trend
800
300
700
250
600
200
500
150
400
100
300
50
200
0
100
-50
208
430
222
457.1
740
0
-100
4QFY2016 1QFY2017 2QFY2017 3QFY2017 4QFY2017
Adj PAT
% YoY
Source: Company, Angel Research
January 15, 2017
5
United Phosphorus | 4QFY2017 Result Update
Invvestment arguments
Innovators dominant in the off-patent space; Generic firms in
a sweet spot
The global agrichemical industry, valued at US$56bn (CY2015), is dominated by
the top six innovators, viz. Bayer, Syngenta, Monsanto, BASF, DuPont and Dow,
which enjoy a large market share of the patented (23%) and off-patent (54%)
market. The top six innovators enjoy a large share of the off-patent market due to
high entry barriers for pure generic players. Thus, of the total pie worth US$30bn,
which is controlled by the top six innovators through proprietary
off-patent products, provides a high-growth opportunity for larger integrated
generic players like UPL.
Generic segment’s market share to increase
The industry registered a CAGR of 3% over 1998-2015, while generic players
outpaced the industry with a CAGR of 6%. Going ahead, given the opportunities
and a drop in the rate of new molecule introduction by innovators, we expect
generic players to continue to outpace the industry’s growth rate and augment
their market share in the overall pie. Historically, global agrichem players have
been logging in-line growth with global GDP. Going ahead, over CY2017-18, the
global economy is expected to grow by 3-4%. Assuming this trend plays out in
terms of growth for the agrichemical industry and the same rate of genericization
occurs, the agrichemical generic industry could log in 6-8% yoy growth during the
period and garner a higher market share.
A global generic play
UPL is the second largest global generic agrichemical player with presence across
major markets including the US, EU, Latin America, and India. Given the high
entry barriers by way of high investments, entry of new players is restricted. Thus,
amidst this scenario and on account of having a low-cost base,
we believe UPL enjoys an edge over competition and is placed in a sweet spot to
leverage the upcoming opportunities in the global generic space.
Advanta - An Entry into seeds business
During FY2016, UPL announced a merger of Advanta with itself. With this, the
company has made its foray into the seed business, thus, widening its business
offerings in the Agri-business. The company had sales of around US$204mn in
2015, with OPM of around 15-16%. It is the 11th largest seeds company globally,
with world leadership in Sorghum. Along with this, it also completes the company’s
business portfolio, in-line with the other major Agri-businesses, who have around
5-20% (Monsanto and DuPont have around 65% of their sales mix through seeds)
of their sales mix through seeds business. While the acquisition improves the
presence of the company in the low capital intensive industry coupled with the
propriety products, which will yield long term profitability; the near term challenges
include high R&D cost coupled with long legislation period for the product
commercialization.
According to the industry numbers, the international seeds sector is growing at 6%
per annum. In value terms, the Indian hybrid seed sector, estimated to be worth
January 15, 2017
6
United Phosphorus | 4QFY2017 Result Update
`12,000cr comprises some 14 states seeds corporations and two national-level
corporations, 20 large players including multinationals and around 500 small
regional players. About 10 domestic and multinational companies control over
80% of the market. The market has been growing at 15-20% annually over the
past several years, and is projected to reach around `18,000cr by 2018. Though,
we have included the Advanta numbers in our projections, we have been
conservative on the same.
Outlook and valuation
Over the last few years, the global agriculture sector has been reviving on the back
of rising food prices. Food security is also a top priority for most governments, and
reducing food loss is one of the easiest ways to boost food inventory. Hence, we
believe agrichemical companies would continue to do well in the wake of
heightened food security risks, and strong demand is likely to be witnessed across
the world. Overall, we expect the global agrichemical industry to perform well
from here on. Generics are expected to register a healthy growth due to - (a)
increasing penetration and wresting market share from innovators, and (b) patent
expiries worth US$3bn-4bn during the next five years.
We estimate UPL to post a 16.0% and 12.3% CAGR in sales and PAT respectively
over FY2017-19E. The stock is trading at 19.0x FY2019E EPS, which we believe
provides very little room for appreciation. Hence, we maintain our Neutral rating
on the stock.
Exhibit 8: Key assumption
FY2018E
FY2019E
Sales growth
16.0
16.0
EBITDA margin
17.8
17.8
Tax rate
20.0
20.0
Source: Company, Angel Research
Exhibit 9: P/E band
1000
900
800
700
600
500
400
300
200
100
0
Price
6x
8x
10x
12x
14x
Source: Company, Angel Research
January 15, 2017
7
United Phosphorus | 4QFY2017 Result Update
Exhibit 10: Peer valuation
Company
Reco
Mcap
CMP
TP
Upside
P/E (x)
EV/Sales (x)
EV/EBITDA (x)
RoE (%)
CAGR (%)
(` cr)
(`)
(`)
(%)
FY18 FY19 FY18 FY19 FY18 FY19 FY18 FY19 Sales PAT
Rallis
Neutral
4,808
247
-
-
26.1
23.4
2.1
1.9
13.7
12.4
15.8
16.0
11.5
21.6
UPL
Neutral
43,142
847
-
-
22.8
19.0
2.4
2.0
13.5
11.3
23.3
23.3
16.0
12.3
Source: Company, Angel Research, Bloomberg, All numbers in FY18 and FY19 are expected numbers
Company background
United Phosphorus (UPL) is a global generic crop protection, chemicals and seeds
company. The company is fully backward and forward integrated by taking
advantage of the consolidation opportunities within the agrochemical industry. UPL
is the largest Indian agrochemical company and had revenue of about `16,312cr
for the year ended March 2017. During FY2016, UPL announced its merger with
Advanta. With this, the company has made its foray into the seed business, thus,
widening its business offerings in the Agri-business.
January 15, 2017
8
United Phosphorus | 4QFY2017 Result Update
Profit & Loss Statement (Consolidated)
Y/E March (` cr)
FY2014
FY2015
FY2016
FY2017
FY2018E
FY2019E
Net Sales
10,580
11,911
13,083
16,312
18,922
21,949
Other operating income
191
45
219
332
332
332
Total operating income
10,771
11,956
13,302
16,644
19,254
22,281
% chg
17.1
11.0
11.3
25.1
15.7
15.7
Total Expenditure
8,751
9,736
10,663
13,407
15,552
18,041
Net Raw Materials
5,441
6,016
6,411
7,816
9,067
10,517
Other Mfg costs
942
842
1,164
1,452
1,684
1,953
Personnel
946
1,043
1,224
1,627
1,887
2,189
Other
1,422
1,835
1,864
2,512
2,914
3,381
EBITDA
1,829
2,175
2,419
2,904
3,369
3,908
% chg
26.8
19.0
11.2
20.1
16.0
16.0
(% of Net Sales)
17.3
18.3
18.5
17.8
17.8
17.8
Dep. & Amortisation
407
425
502
672
629
685
EBIT
1,613
1,796
2,137
2,565
3,072
3,555
% chg
26.7
11.4
19.0
20.0
19.8
15.7
(% of Net Sales)
15.0
15.0
16.1
15.4
16.0
16.0
Interest & other Charges
487
517
622
735
788
788
Other Income
131
131
112
112
112
112
(% of PBT)
10
9
7
6
5
4
Recurring PBT
1,257
1,410
1,626
1,941
2,396
2,879
% chg
37.1
12.2
15.3
19.4
23.4
20.2
Extraordinary Exp./(Inc.)
85
(2)
(53)
(73)
-
-
PBT (reported)
1,172
1,413
1,679
1,941
2,396
2,879
Tax
222
244
283
189
479
576
(% of PBT)
18.9
17.3
16.9
9.7
20.0
20.0
PAT (reported)
950
1,169
1,396
1,753
1,917
2,303
Add: Share of earnings of
30
21
(31)
(19)
(21)
(24)
asso.
Less: Minority interest (MI)
7
43
13
6
6
6
Prior period items
24
-
-
-
-
1
PAT after MI (reported)
950
1,144
1,299
1,727
1,889
2,272
ADJ. PAT
1,040
1,147
1,352
1,800
1,889
2,272
% chg
38.0
10.2
17.9
33.2
4.9
20.3
(% of Net Sales)
9.8
9.6
10.3
11.0
10.0
10.4
Basic EPS (`)
24.3
26.7
31.5
35.5
37.3
44.8
Fully Diluted EPS (`)
24.3
26.7
31.5
35.5
37.3
44.8
% chg
42.5
10.2
17.9
12.6
4.9
20.3
January 15, 2017
9
United Phosphorus | 4QFY2017 Result Update
Balance Sheet (Consolidated)
Y/E March (` cr)
FY2014
FY2015
FY2016
FY2017
FY2018E
FY2019E
SOURCES OF FUNDS
Equity Share Capital
86
86
86
183
183
183
Preference Capital
-
-
-
-
-
-
Reserves& Surplus
5,162
5,775
6,705
7,214
8,645
10,459
Shareholders’ Funds
5,247
5,860
6,791
7,398
8,828
10,642
Minority Interest
172
44
42
33
39
45
Total Loans
2,873
2,781
3,860
6,058
6,058
6,058
Other Long term liab.
311
594
464
446
446
446
Long Term Provisions
53
53
53
-
-
-
Deferred Tax Liability
57
45
(5)
(501)
(501)
(501)
Total Liabilities
8,713
9,378
11,205
13,434
14,870
16,690
APPLICATION OF FUNDS
Gross Block
6,039
6,792
7,791
8,591
9,391
10,191
Less: Acc. Depreciation
3,580
4,005
4,507
5,178
5,807
6,493
Net Block
2,459
2,787
3,285
2,738
3,584
3,699
Capital Work-in-Progress
378
378
378
378
378
378
Goodwill / Intangilbles
1,212
1,449
1,463
1,747
1,747
1,747
Investments
737
764
1,066
379
379
379
Long Term Loan & Adv.
389
418
537
811
664
770
Current Assets
7,572
8,372
10,069
13,657
15,727
18,544
Cash
1,023
1,010
1,068
2,894
3,382
4,475
Loans & Advances
771
586
840
1,380
1,581
1,582
Other
5,779
6,776
8,162
9,383
10,764
12,487
Current liabilities
4,033
4,789
5,593
6,277
7,608
8,825
Net Current Assets
3,539
3,582
4,476
7,380
8,119
9,718
Others
-
-
-
-
-
-
Total Assets
8,714
9,378
11,205
13,434
14,870
16,690
January 15, 2017
10
United Phosphorus | 4QFY2017 Result Update
Cash Flow Statement (Consolidated)
Y/E March (` cr)
FY2014
FY2015
FY2016
FY2017
FY2018E
FY2019E
Profit before tax
1,172
1,413
1,679
1,941
2,396
2,879
Depreciation
407
425
502
672
629
685
Change in Working Capital
171
(86)
(955)
(1,352)
(103)
(612)
Less: Other income
-
-
-
-
-
1
Direct taxes paid
(222)
(244)
(283)
(189)
(479)
(576)
Cash Flow from Operations
1,528
1,508
942
1,072
2,443
2,377
(Inc.)/ Dec. in Fixed Assets
(653)
(753)
(1,000)
(800)
(800)
(800)
(Inc.)/ Dec. in Investments
-
-
-
-
-
-
Inc./ (Dec.) in loans and adv.
-
-
-
-
-
-
Other income
-
-
-
-
-
-
Cash Flow from Investing
(653)
(753)
(1,000)
(800)
(800)
(800)
Issue of Equity
(3)
-
-
98
-
-
Inc./(Dec.) in loans
1,413
(192)
(949)
(2,127)
(0)
(0)
Dividend Paid (Incl. Tax)
(201)
(214)
(214)
(642)
(458)
(458)
Others
(2,612)
(362)
1,278
4,323
(696)
(26)
Cash Flow from Financing
(1,403)
(768)
115
1,652
(1,155)
(484)
Inc./(Dec.) in Cash
(525)
(13)
58
1,826
488
1,093
Opening Cash balances
1,548
1,023
1,010
1,068
2,894
3,382
Closing Cash balances
1,023
1,010
1,068
2,894
3,382
4,475
January 15, 2017
11
United Phosphorus | 4QFY2017 Result Update
Key Ratios
Y/E March
FY2014
FY2015
FY2016
FY2017
FY2018E
FY2019E
Valuation Ratio (x)
P/E (on FDEPS)
35.0
31.7
26.9
23.9
22.8
19.0
P/CEPS
25.2
23.2
19.6
19.8
19.2
16.2
P/BV
6.9
6.2
5.4
10.5
8.8
7.3
Dividend yield (%)
0.4
0.4
0.4
0.4
0.4
0.4
EV/Sales
4.2
3.7
3.4
2.8
2.4
2.0
EV/EBITDA
24.2
20.3
18.5
15.8
13.5
11.3
EV / Total Assets
5.1
4.7
4.0
3.4
3.1
2.7
Per Share Data (`)
EPS (Basic)
24.3
26.7
31.5
35.5
37.3
44.8
EPS (fully diluted)
24.3
26.7
31.5
35.5
37.3
44.8
Cash EPS
33.8
36.7
43.2
42.8
44.1
52.3
DPS
2.5
2.5
2.5
2.5
2.5
2.5
Book Value
122.4
136.7
158.4
80.7
96.3
116.1
DuPont Analysis
EBIT margin
15.0
15.0
16.1
15.4
16.0
16.0
Tax retention ratio
81.1
82.7
83.1
90.3
80.0
80.0
Asset turnover (x)
1.5
1.6
1.6
1.7
1.8
1.9
ROIC (Post-tax)
18.5
20.3
21.0
23.6
22.7
24.4
Cost of Debt (Post Tax)
11.2
15.1
15.6
13.4
10.4
10.4
Leverage (x)
0.5
0.3
0.4
0.4
0.4
0.2
Operating ROE
21.9
22.0
22.9
27.9
27.2
27.6
Returns (%)
ROCE (Pre-tax)
17.7
19.9
20.8
20.8
21.7
22.5
Angel ROIC (Pre-tax)
23.2
24.7
25.6
26.7
28.9
31.0
ROE
21.0
20.6
21.4
25.4
23.3
23.3
Turnover ratios (x)
Asset Turnover (Gross Block)
1.9
1.9
1.8
2.0
2.1
2.3
Inventory / Sales (days)
83
86
86
81
83
84
Receivables (days)
83
86
86
81
83
84
Payables (days)
69
72
73
68
70
70
WCcycle (ex-cash) (days)
92
78
83
88
89
83
Solvency ratios (x)
Net debt to equity
0.6
0.4
0.3
0.4
0.4
0.3
Net debt to EBITDA
1.8
1.0
0.8
1.2
1.1
0.8
Interest Coverage (EBIT / Int.)
3.3
3.5
3.4
3.5
3.9
4.5
January 15, 2017
12
United Phosphorus | 4QFY2017 Result Update
Research Team Tel: 022 - 39357800
DISCLAIMER
Angel Broking Private Limited (hereinafter referred to as “Angel”) is a registered Member of National Stock Exchange of India Limited,
Bombay Stock Exchange Limited and Metropolitan Stock Exchange Limited. It is also registered as a Depository Participant with CDSL
and Portfolio Manager with SEBI. It also has registration with AMFI as a Mutual Fund Distributor. Angel Broking Private Limited is a
registered entity with SEBI for Research Analyst in terms of SEBI (Research Analyst) Regulations, 2014 vide registration number
INH000000164. Angel or its associates has not been debarred/ suspended by SEBI or any other regulatory authority for accessing
/dealing in securities Market. Angel or its associates/analyst has not received any compensation / managed or co-managed public
offering of securities of the company covered by Analyst during the past twelve months.
This document is solely for the personal information of the recipient, and must not be singularly used as the basis of any investment
decision. Nothing in this document should be construed as investment or financial advice. Each recipient of this document should
make such investigations as they deem necessary to arrive at an independent evaluation of an investment in the securities of the
companies referred to in this document (including the merits and risks involved), and should consult their own advisors to determine
the merits and risks of such an investment.
Reports based on technical and derivative analysis center on studying charts of a stock's price movement, outstanding positions and
trading volume, as opposed to focusing on a company's fundamentals and, as such, may not match with a report on a company's
fundamentals. Investors are advised to refer the Fundamental and Technical Research Reports available on our website to evaluate the
contrary view, if any.
The information in this document has been printed on the basis of publicly available information, internal data and other reliable
sources believed to be true, but we do not represent that it is accurate or complete and it should not be relied on as such, as this
document is for general guidance only. Angel Broking Pvt. Limited or any of its affiliates/ group companies shall not be in any way
responsible for any loss or damage that may arise to any person from any inadvertent error in the information contained in this report.
Angel Broking Pvt. Limited has not independently verified all the information contained within this document. Accordingly, we cannot
testify, nor make any representation or warranty, express or implied, to the accuracy, contents or data contained within this document.
While Angel Broking Pvt. Limited endeavors to update on a reasonable basis the information discussed in this material, there may be
regulatory, compliance, or other reasons that prevent us from doing so.
This document is being supplied to you solely for your information, and its contents, information or data may not be reproduced,
redistributed or passed on, directly or indirectly.
Neither Angel Broking Pvt. Limited, nor its directors, employees or affiliates shall be liable for any loss or damage that may arise from
or in connection with the use of this information.
Disclosure of Interest Statement
UPL
1. Financial interest of research analyst or Angel or his Associate or his relative
No
2. Ownership of 1% or more of the stock by research analyst or Angel or associates or relatives
No
3. Served as an officer, director or employee of the company covered under Research
No
4. Broking relationship with company covered under Research
No
Ratings (Based on expected returns
Buy (> 15%)
Accumulate (5% to 15%)
Neutral (-5 to 5%)
over 12 months investment period):
Reduce (-5% to -15%)
Sell (< -15)
January 15, 2017
13