2QFY2018 Result Update | Agrichemical
November 22, 2017
United Phosphorus
ACCUMULATE
CMP
`754
Performance Highlights
Target Price
`805
Y/E March (` cr)
2QFY2018 1QFY2018
% chg (qoq) 2QFY2017
% chg (yoy)
Investment Period
12 months
Net sales
3,770
3723
1.3
3541
6.5
Other income
76
101
(24.8)
82
(7.3)
Gross profit
2114
2204
(4.1)
1892
11.7
Operating profit
677
691
(2.0)
548
23.5
Adj. net profit
263
492
(46.6)
214
23.0
Source: Company, Angel Research,
Stock Info
Sector
Agrichem ical
UPL posted robust numbers for 2QFY2018. In sales, the company posted gross
Market Cap (` cr)
38,340
revenues of `3,770cr v/s `3,541cr in 2QFY2017, growth of 6.5% yoy. The sales growth
Net Debt (` cr)
1,113
Beta
1.0
was driven by volume (11% yoy), while price dip was 2% and exchange losses
52 Week High / Low
902/584
deducted 3% from the top-line rise. On EBITDA front, the company posted an
Avg. Daily Volum e
100,243
EBITDA of 18.0% v/s 15.5% in 2QFY2017. Consequently, Adj. PAT came in at `263cr
Face Value (`)
2
BSE Sensex
33,478
v/s `214cr in 2QFY2017, growth of 23.0% yoy. The management has maintained
Nifty
10,327
guidance of 12-15% revenue growth and 50-75bps improvement in EBITDA margin.
Reuters Code
UNPO.BO
We recommend our Accumulate rating on the stock.
Bloom berg Code
UNTP@IN
Quarterly highlights: In sales, the company posted gross revenues of `3,770cr v/s
Shareholding Pattern (%)
`3,541cr in 2QFY2017, growth of 6.5% yoy. The growth was driven by volume (11%
Prom oters
27.9
yoy), while price dip was 2% and exchange losses deducted 3% from the top-line
MF / Banks / Indian Fls
13.8
rise. In terms of geography, revenues were higher overall - India (`997cr, up 10%
FII / NRIs / OCBs
50.4
Indian Public / Others
8.0
yoy), Latin America (`1,385cr, up 5% yoy), ROW (`632cr, yoy rise of 5%), Europe
(`363cr, posted a yoy growth of 7%). US (`393cr) sales posted a yoy growth of 5%.
Abs . (%)
3m
1yr
3yr
On EBITDA front, the company posted an EBITDA of 18.0% v/s 15.5% in 2QFY2017.
Sensex
7.0
29.9
18.2
Consequently, Adj. PAT came in at `263cr v/s `214cr in 2QFY2017, growth of 23.0%
UPL
(5.5)
24.0
115.5
yoy.
Outlook and Valuation: We expect UPL to post a CAGR of 15.0% and 11.3% in its
sales and PAT respectively over FY2017-19E. The management has maintained
guidance of 12-15% revenue growth and 50-75bps improvement in EBITDA margin.
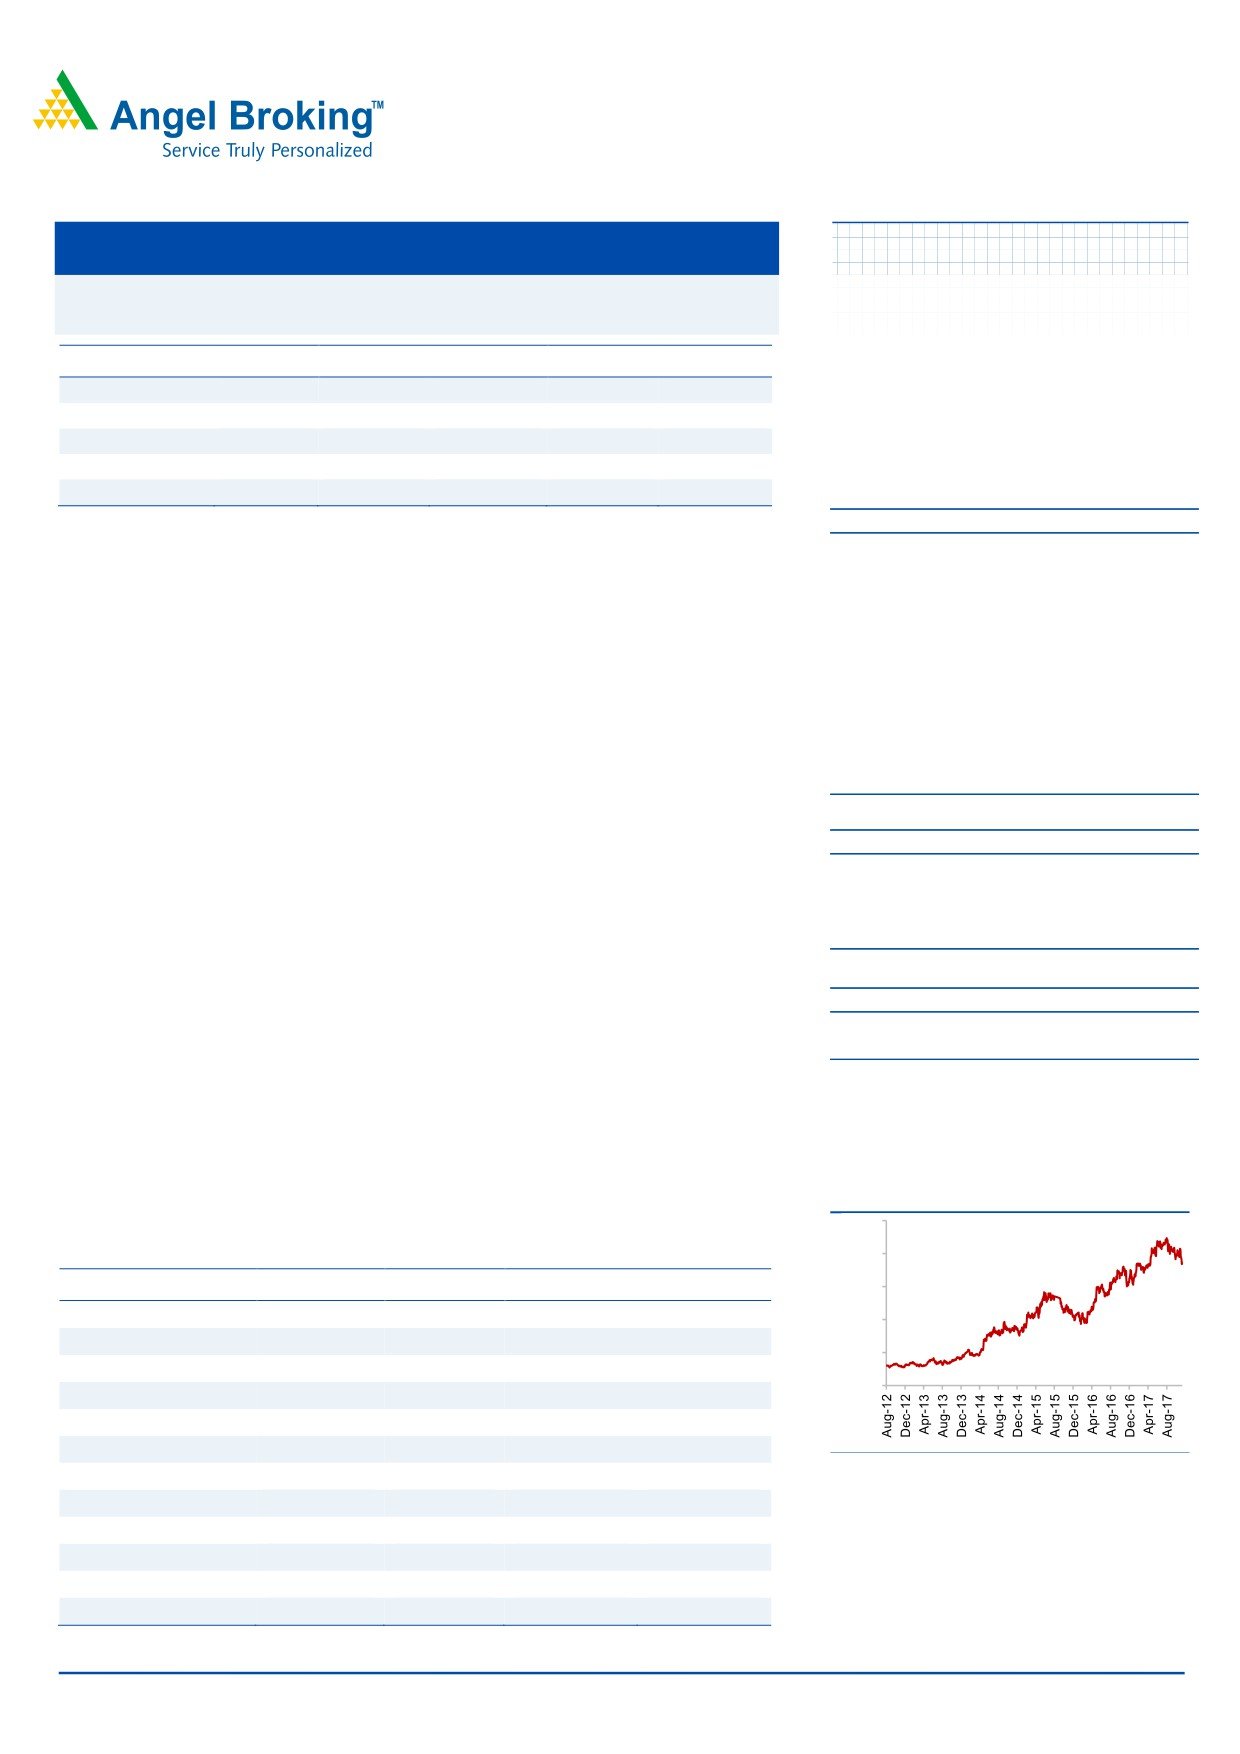
3-year price chart
We recommend an Accumulate.
1000
800
Key financials (Consolidated)
Y/E March (` cr)
FY2016
FY2017
FY2018E
FY2019E
600
Total revenue
14,048
16,312
18,759
21,572
400
% chg
17.9
16.1
15.0
15.0
200
Adj. profit
1,051
1,800
1,848
2,267
0
% chg
(8.3)
71.3
2.7
22.7
EBITDA (%)
16.1
17.8
18.4
18.7
EPS (`)
24.5
35.5
36.5
44.7
Source: Company, Angel Research
P/E (x)
30.8
21.2
20.7
16.9
P/BV (x)
5.5
5.2
4.4
3.6
RoE (%)
17.9
27.1
22.8
23.4
Sarabjit Kour Nangra
RoCE (%)
15.4
19.1
19.9
21.2
+91-22-3935 7800 ext. 6806
EV/Sales (x)
3.4
2.9
2.5
2.1
EV/EBITDA (x)
21.4
16.3
13.7
11.4
Source: Company, Angel Research; Note: CMP as of November 21, 2017,
Please refer to important disclosures at the end of this report
1
United Phosphorus | 2QFY2018 Result Update
Exhibit 1: 2QFY2018 Performance (Consolidated)
Y/E March (` cr)
2QFY2018 1QFY2018
% chg (qoq) 2QFY2017
% chg (yoy) 1HFY2018 1HFY2017
% chg
Net sales
3,770
3,723
1.3
3,541
6.5
7,493
7,051
6.3
Other income
76
101
(24.8)
82
(7.3)
177
169
4.7
Total income
3,846
3,824
0.6
3,623
6.2
7,670
7,220
6.2
Gross profit
2114
2204
(4.1)
1892
11.7
4318
3802
13.6
Gross margin (%)
56.1
59.2
53.4
57.6
53.9
Operating profit
677
691
(2.0)
548
23.5
1368
1187
15.3
Operating margin (%)
18.0
18.6
15.5
18.3
16.8
Financial cost
182
80
127.5
180
1.1
262
339
Depreciation
165
158
4.4
154
7.1
323
323
0.0
PBT
406
554
(26.7)
296
37.2
960
694
38.4
Provision for taxation
75
48
43
74.4
123
86
43.0
PAT Before Exc. And MI
331
506
(34.6)
253
30.8
837
608
37.8
Minority Income/ ( Exp.)
0
0
1
0
0
Income from Associate/ (Exp)
(62)
(12)
(31)
(74)
(29)
Extra ordinary Income/( Exp.)
(31)
(19)
(56)
(50)
(49)
Reported PAT
238
475
(49.9)
166
43.4
714
530
34.7
Adjusted PAT
263
492
(46.6)
214
23.0
758
572
32.3
5.2
9.7
4.4
14.9
11.3
EPS (`)
Source: Company, Angel Research
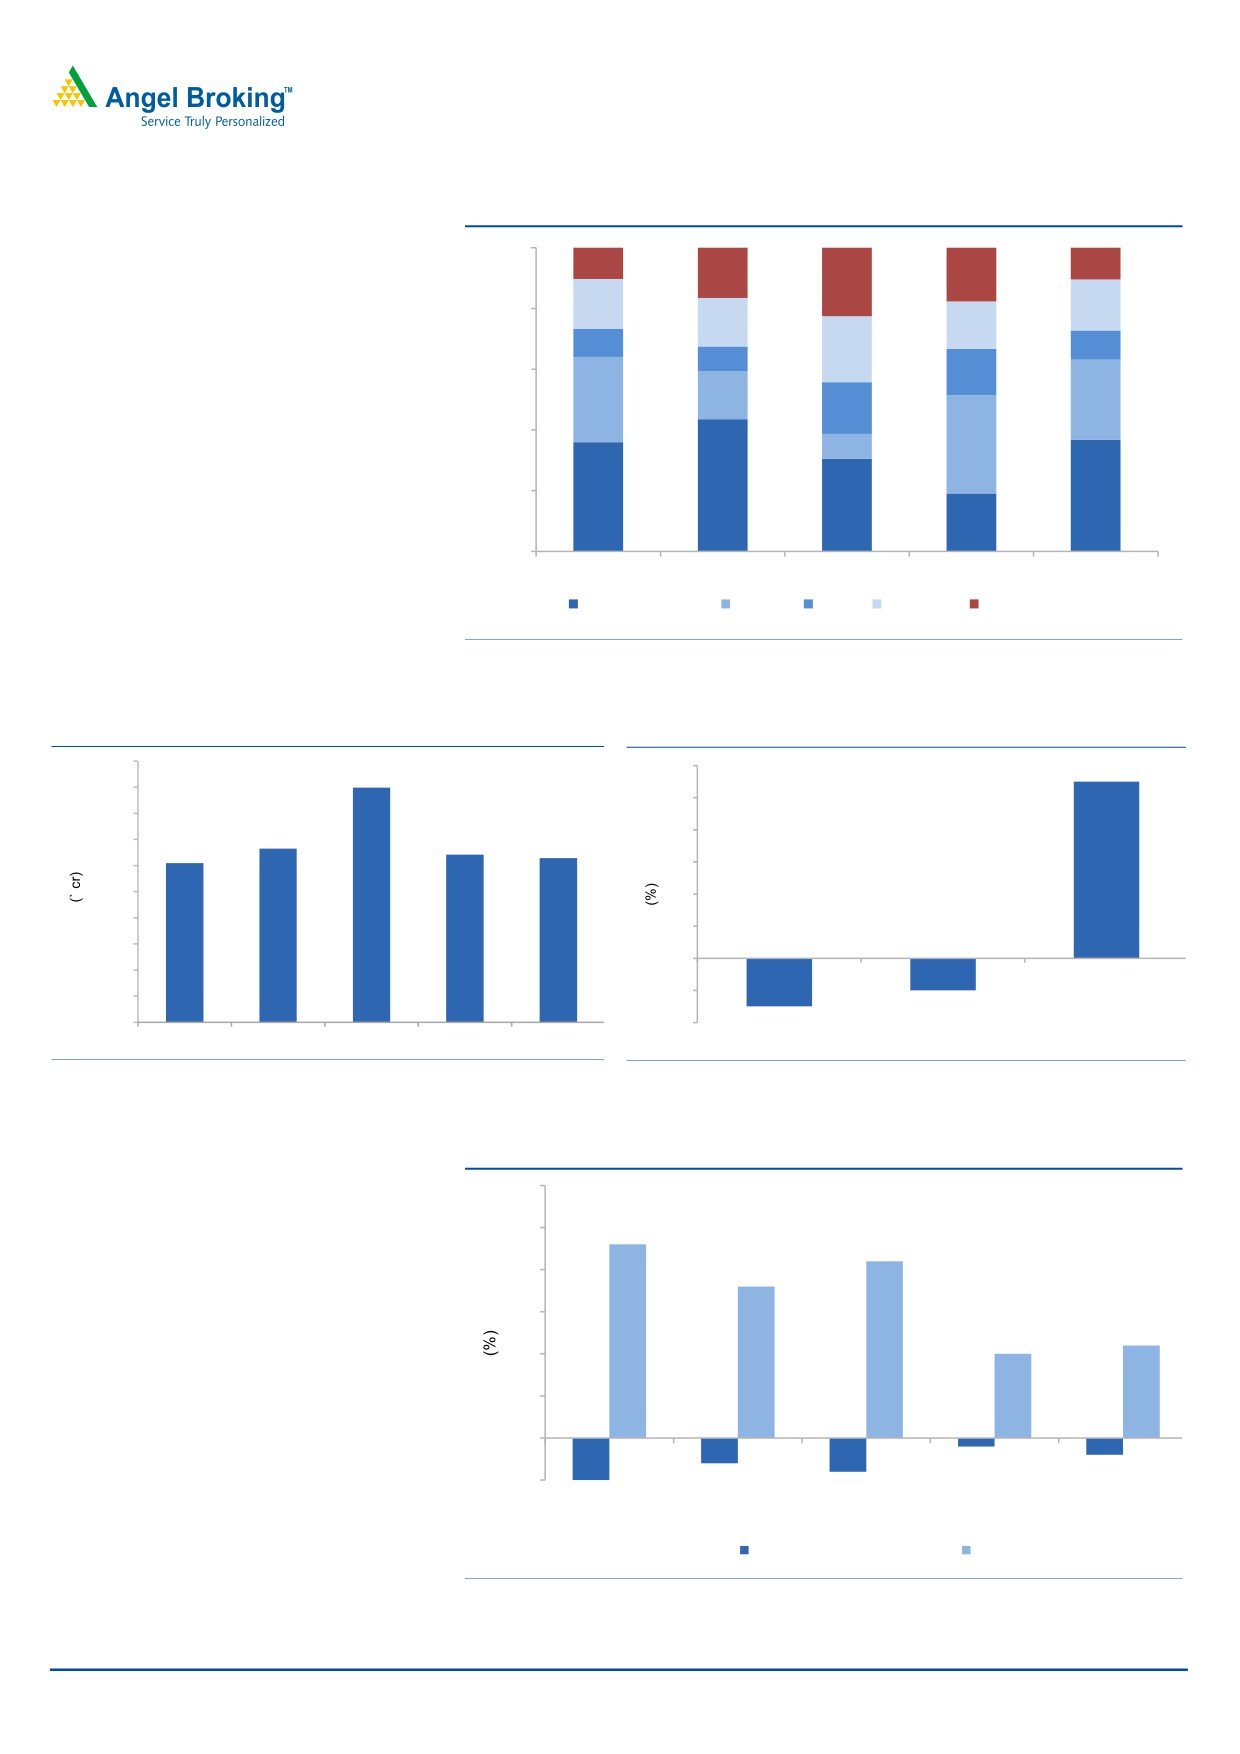
Top-line growth mainly led by India and Europe
In sales, the company posted gross revenues of `3,770cr v/s `3,541cr in 2QFY2017,
growth of 6.5% yoy. The growth was driven by volume (11% yoy), while price dip
was around 2% and exchange losses deducted 3% from the top-line rise. In terms
of geography, revenues were higher overall - India (`997cr, up 10% yoy), Latin
America (`1,385cr, up 5% yoy), ROW (`632cr, yoy rise of 5%), Europe (`363cr, posted
a yoy growth of 7%). US (`393cr) sales posted a yoy growth of 5%.
In India, the growth of the company is driven by the power brands. Poor rainfall
affected Southern States. However, Rabi prospects should improve after late rains.
Potential 3 million hectares of rice expected to be planted in Rabi in South.
In Europe, business grew in Potato, Oil Seed Rape and Cereals (herbicides). Sugar
Beet herbicide pipeline dry, increased acreage and product shortage provides good
opportunities for UPL.
For Latin America, there was revival in Mexico with good rains, though late.
Management is expecting better 3QFY2018 as distributors/farmers were playing
wait and watch before ordering. Also, collaboration with Bayer on joint promotion
of fungicides on Asian Rust in Brazil should be beneficial.
November 21, 2017
2
United Phosphorus | 2QFY2018 Result Update
Exhibit 2: Sales Break-up (Marketwise)
100%
375
393
660
681
1,215
80%
599
632
636
602
341
363
1,172
329
60%
585
1,026
626
997
916
40%
442
1,246
20%
1,736
1,317
1,385
1,646
737
0%
2QFY2017
3QFY2017
4QFY2017
1QFY2018
2QFY2018
Latin America
India
EU
Others
North America
Source: Company
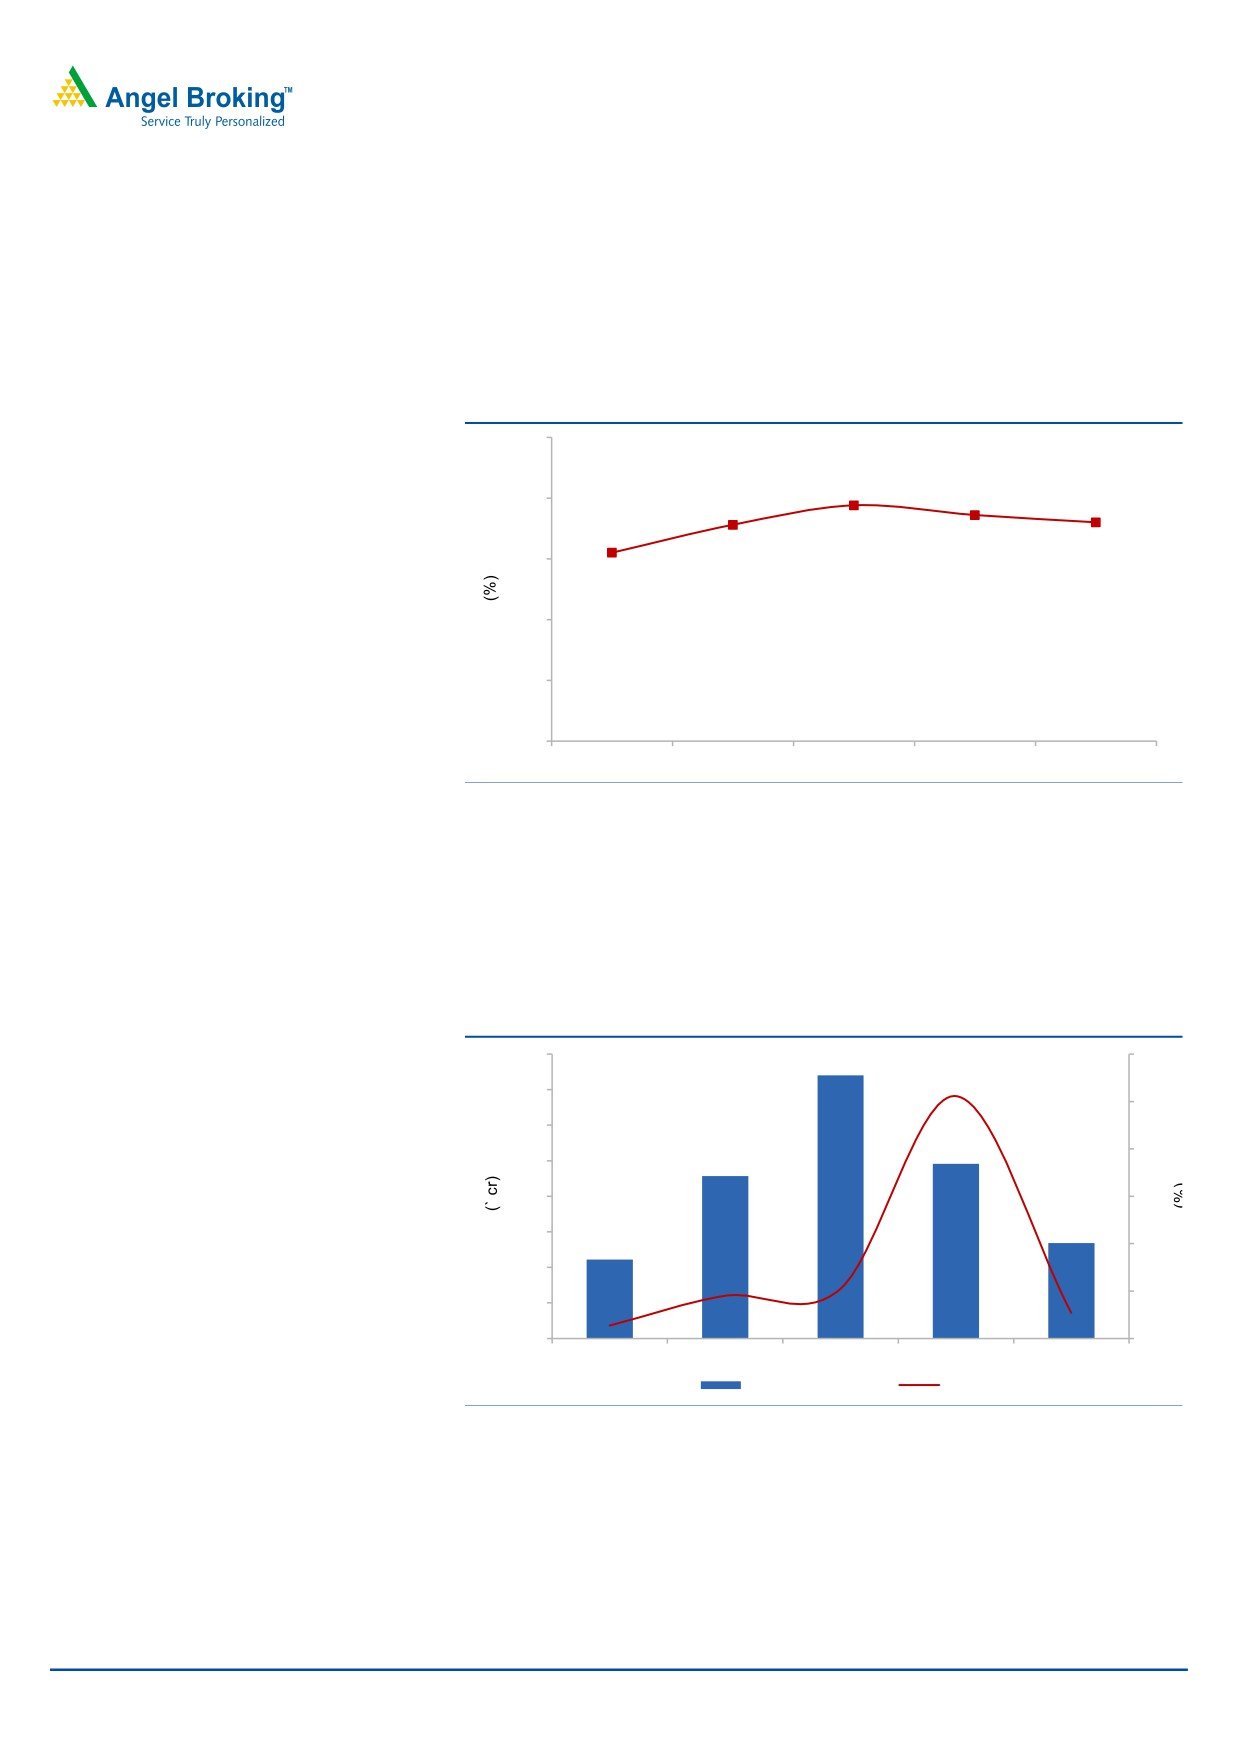
Exhibit 3: Sales performance (including export incentives)
Exhibit 4: Growth break-up
6000
12
11
5,391
5400
10
4800
3,987
8
4200
3,851
3,770
3,658
3600
6
3000
4
2400
2
1800
0
1200
(2)
600
(2)
0
(4)
(3)
2QFY2017
3QFY2017
4QFY2017
1QFY2018
2QFY2018
Exchange impact
Realisation
Volume
Source: Company, Angel Research
Source: Company, Angel Research
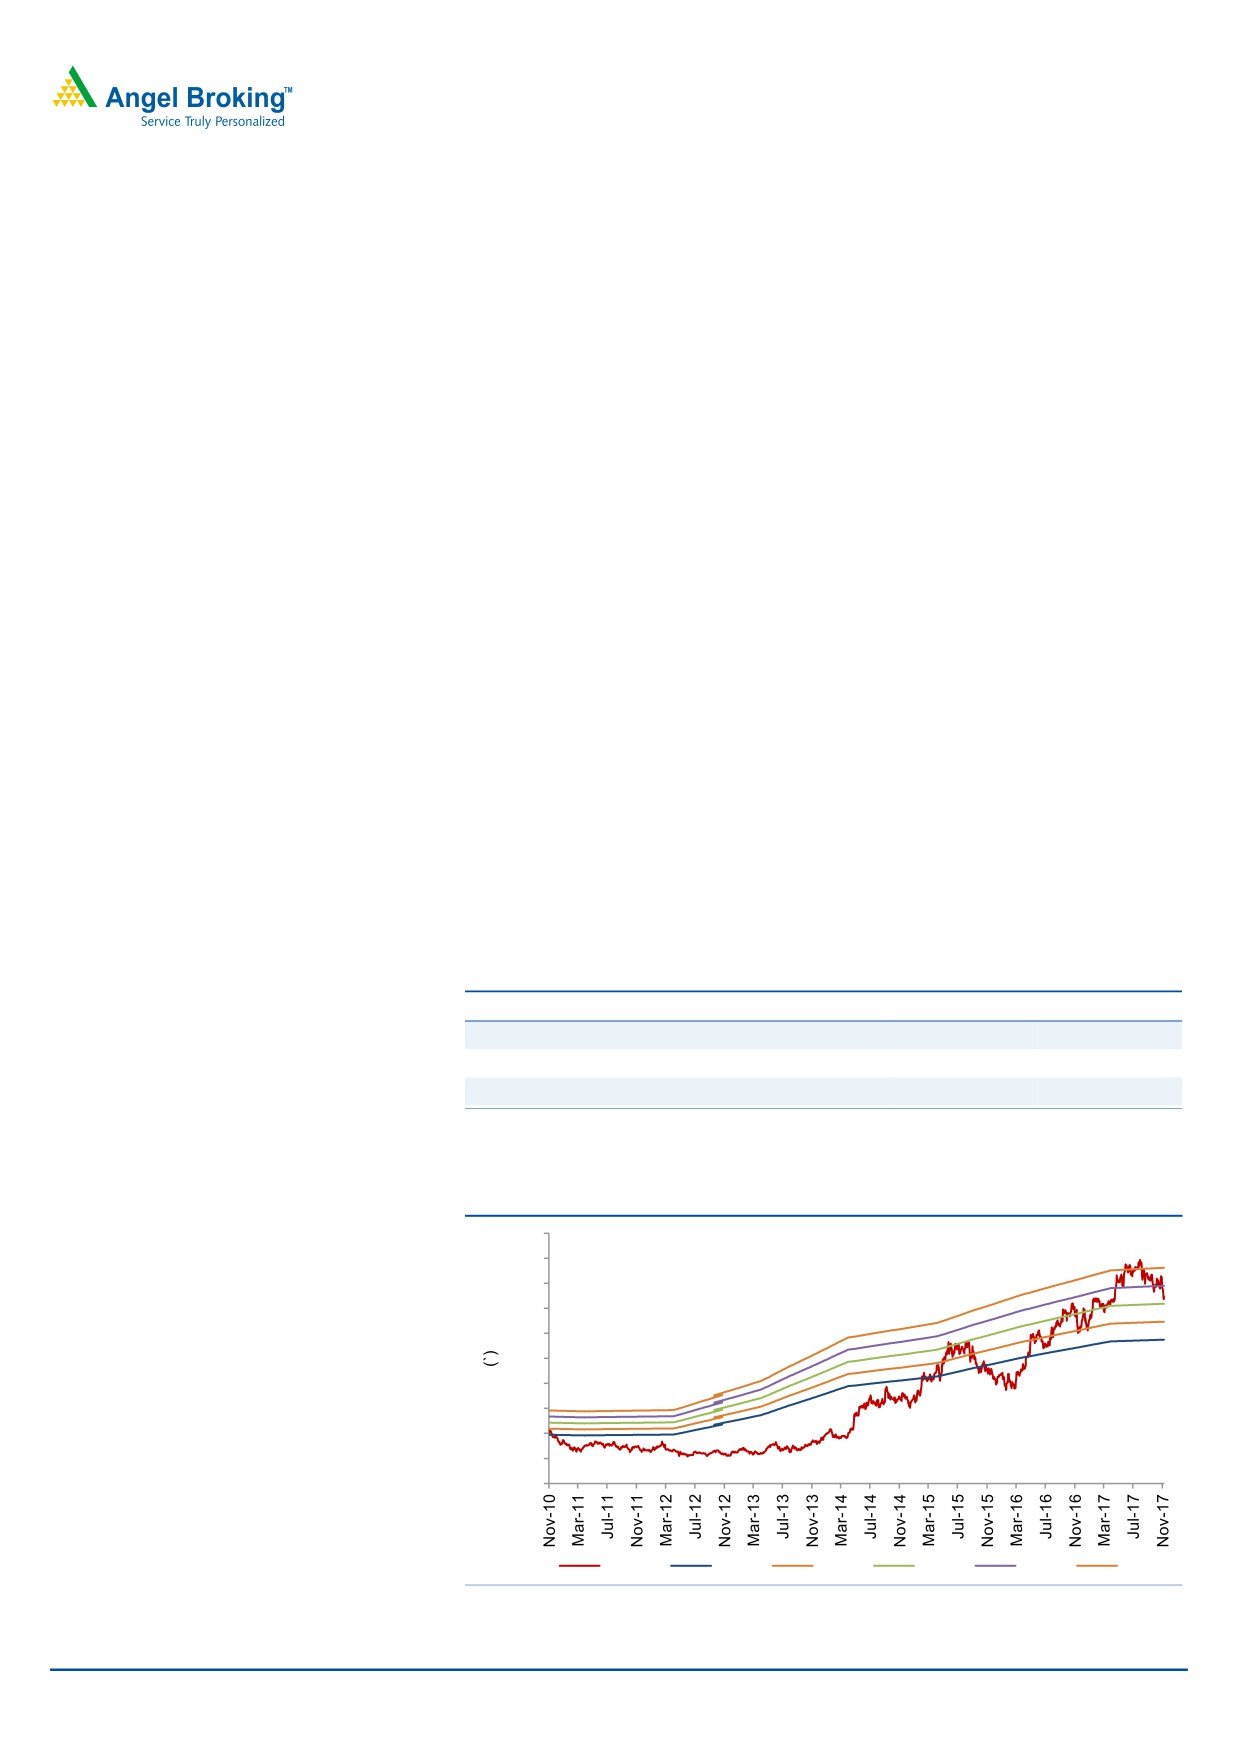
Exhibit 5: Volume and realization break-up (yoy)
30
23
25
21
20
18
15
11
10
10
5
0
(1)
(3)
(2)
(5)
(4)
2QFY2017
3QFY2017
4QFY2017
1QFY2018
2QFY2018
Realisation
Volume
Source: Company, Angel Research
November 21, 2017
3
United Phosphorus | 2QFY2018 Result Update
EBITDA margin expands
On the operating front, the gross margin came in at 56.1% (v/s 53.4% in 2QFY2017),
which aided the OPM for the quarter to come in at 18.0% (v/s 15.5% in 2QFY2017).
The expansion in OPM was slightly less than the gross margin expansion, on the
back of staff expenses, which rose by 11.8% yoy.
Exhibit 6: EBITDA margin trend
25.0
20.0
19.4
18.6
17.8
18.0
15.0
15.5
10.0
5.0
0.0
2QFY2017
3QFY2017
4QFY2017
1QFY2018
2QFY2018
Source: Company, Angel Research
Adjusted Net Profit grew 23.0% yoy
The company posted a 23.0% yoy growth in its Adjusted PAT, excluding the extra
ordinaries and profits from associates and subsidiaries. The Reported PAT was
`238cr V/s `166cr in 2QFY2017; a yoy rise of 43.4%.
Exhibit 7: Adjusted PAT trend
800
300
700
250
600
200
500
400
150
300
100
200
50
100
222
457.1
740
491
268
0
0
2QFY2017
3QFY2017
4QFY2017
1QFY2018
2QFY2018
Adj PAT
% YoY
Source: Company, Angel Research
November 21, 2017
4
United Phosphorus | 2QFY2018 Result Update
Investment arguments
Innovators dominant in the off-patent space; Generic firms in
a sweet spot
The global agrichemical industry, valued at US$56bn (CY2015), is dominated by the
top six innovators, viz. Bayer, Syngenta, Monsanto, BASF, DuPont and Dow, which
enjoy a large market share of the patented (23%) and off-patent (54%) market. The
top six innovators enjoy a large share of the off-patent market due to high entry
barriers for pure generic players. Thus, of the total pie worth US$30bn, which is
controlled
by
the
top
six
innovators
through
proprietary
off-patent products, provides a high-growth opportunity for larger integrated
generic players like UPL.
Generic segment’s market share to increase
The industry registered a CAGR of 3% over 1998-2006, while generic players
outpaced the industry with a CAGR of 6%. Going ahead, given the opportunities
and a drop in the rate of new molecule introduction by innovators, we expect
generic players to continue to outpace the industry’s growth rate and augment
their market share in the overall pie. Historically, global agrichem players have been
logging in-line growth with global GDP. Going ahead, over CY2017-18, the global
economy is expected to grow by 3-4%. Assuming this trend plays out in terms of
growth for the agrichemical industry and the same rate of genericization occurs,
then the agrichemical generic industry could log in 6-8% yoy growth during the
period and garner a higher market share.
A global generic play
UPL is the third largest global generic agrichemical player with presence across
major markets including the US, EU, Latin America, and India. Given the high entry
barriers by way of high investments, entry of new players is restricted. Thus, amidst
this
scenario and on account of having a low-cost base,
we believe UPL enjoys an edge over competition and is placed in a sweet spot to
leverage the upcoming opportunities in the global generic space.
Advanta - An Entry into seeds business
During FY2016, UPL announced a merger of Advanta with itself. With this, the
company has made its foray into the seed business, thus, widening its business
offerings in the Agri-business. The company had sales of around US$204mn in
2015, with OPM of around 15-16%. It is the 11th largest seed company globally,
with world leadership in Sorghum. Along with this, it also completes the company’s
business portfolio, in-line with the other major Agri-businesses, who have around
5-20% (Monsanto and DuPont have around 65% of their sales mix through seeds)
of their sales mix through seeds business. While the acquisition improves the
presence of the company in the low capital intensive industry coupled with the
propriety products, which will yield long term profitability the near term challenges
include high R&D cost coupled with long legislation period for the product
commercialization.
November 21, 2017
5
United Phosphorus | 2QFY2018 Result Update
According to the industry numbers, the international seed sector is growing at 6%
per annum. In value terms, the Indian hybrid seed sector, estimated to be worth
`12,000cr comprises some 14 states seed corporations and two national-level
corporations, 20 large players including multinationals and around 500 small
regional players. About 10 domestic and multinational companies control over 80%
of the market. The market has been growing at 15-20% annually over the past
several years, and is projected to reach around `18,000cr by 2018. Though, we have
included the Advanta numbers in our projections, we have been conservative on
the same.
Outlook and valuation
Over the last few years, the global agriculture sector has been reviving on the back
of rising food prices. Food security is also a top priority for most governments, and
reducing food loss is one of the easiest ways to boost food inventory. Hence, we
believe agrichemical companies would continue to do well in the wake of
heightened food security risks, and strong demand is likely to be witnessed across
the world. Overall, we expect the global agrichemical industry to perform well from
here on. Generics are expected to register a healthy growth due to - (a) increasing
penetration and wresting market share from innovators, and b) patent expiries
worth US$3bn-4bn during the next five years.
We estimate UPL to post a 15.0% and 11.3% CAGR in sales and PAT
respectively over FY2017-19E. The stock is trading at 16.9x FY2019E EPS,
which we believe provides little room for appreciation. Hence, we recommend
an Accumulate rating on the stock.
Exhibit 8: Key assumption
FY2018E
FY2019E
Sales growth
15.0
15.0
EBITDA margin
18.4
18.7
Tax rate
20.0
20.0
Source: Company, Angel Research
Exhibit 9: P/E band
1000
900
800
700
600
500
400
300
200
100
0
Price
16x
18x
20x
22x
24x
Source: Company, Angel Research
November 21, 2017
6
United Phosphorus | 2QFY2018 Result Update
Exhibit 10: Peer valuation
Company Reco
Mcap
CMP TP Upside
P/E (x)
EV/Sales (x) EV/EBITDA (x)
RoE (%)
CAGR (%)
(` cr)
(`)
(`)
(%) FY17 FY18 FY17 FY18 FY17 FY18 FY17 FY18 Sales PAT
Rallis
Sell
4,501
230
189
(18.3)
25.0
20.8
2.3
2.0
15.1
12.7
15.5
16.9
10.5
24.9
Accumulate
44,006
754 805
7.0
20.7
16.9
2.5
2.1
13.7
11.4
22.8
23.4
15.0
12.2
UPL
Source: Company, Angel Research, Bloomberg, All numbers in FY17 and FY18 are expected numbers
Company background
United Phosphorus (UPL) is a global generic crop protection, chemicals and seeds
company. The company is fully backward and forward integrated by taking
advantage of the consolidation opportunities within the agrochemical industry. UPL
is the largest Indian agrochemical company and had revenue of about `11,911cr for
the year ended March 2015. During FY2016, UPL announced its merger with
Advanta. With this, the company has made its foray into the seed business, thus,
widening its business offerings in the Agri-business.
November 21, 2017
7
United Phosphorus | 2QFY2018 Result Update
Profit & Loss Statement (Consolidated)
Y/E March (` cr)
FY2014 FY2015 FY2016 FY2017 FY2018E FY2019E
Net Sales
10,580
11,911
14,048
16,312
18,759
21,572
Other operating income
191
45
-
128
100
100
Total operating income
10,771
11,956
14,048
16,440
18,859
21,672
% chg
17.1
11.0
17.5
17.0
14.7
14.9
Total Expenditure
8,751
9,736
11,782
13,407
15,306
17,537
Net Raw Materials
5,441
6,016
6,780
7,816
8,989
10,337
Other Mfg costs
942
842
1,250
1,452
1,557
1,726
Personnel
946
1,043
1,434
1,627
1,871
2,152
Other
1,422
1,835
2,318
2,512
2,889
3,323
EBITDA
1,829
2,175
2,266
2,904
3,453
4,035
% chg
26.8
19.0
4.2
28.2
18.9
16.9
(% of Net Sales)
17.3
18.3
16.1
17.8
18.4
18.7
Dep. & Amortisation
407
425
676
672
736
792
EBIT
1,613
1,796
1,590
2,361
2,817
3,343
% chg
26.7
11.4
(11.5)
48.5
19.3
18.7
(% of Net Sales)
15.0
15.0
11.3
14.4
14.9
15.4
Interest & other Charges
487
517
704
735
788
788
Other Income
131
131
316
316
316
316
(% of PBT)
10
9
26
16
13
11
Recurring PBT
1,257
1,410
1,202
1,941
2,345
2,871
% chg
37.1
12.2
(14.8)
61.6
20.8
22.5
Extraordinary Exp./(Inc.)
85
(2)
(111)
(73)
-
-
PBT (reported)
1,172
1,413
1,313
1,941
2,345
2,871
Tax
222
244
165
189
469
574
(% of PBT)
18.9
17.3
12.6
9.7
20.0
20.0
PAT (reported)
950
1,169
1,148
1,753
1,876
2,297
Add: Share of earnings of asso.
30
21
(85)
(19)
(21)
(24)
Less: Minority interest (MI)
7
43
12
6
6
6
Prior period items
24
-
-
-
-
-
PAT after MI (reported)
950
1,144
940
1,727
1,848
2,267
ADJ. PAT
1,040
1,147
1,051
1,800
1,848
2,267
% chg
38.0
10.2
(8.3)
71.3
2.7
22.7
(% of Net Sales)
9.8
9.6
7.5
11.0
9.9
10.5
Basic EPS (`)
24.3
26.7
24.5
35.5
36.5
44.7
Fully Diluted EPS (`)
24.3
26.7
24.5
35.5
36.5
44.7
% chg
42.5
10.2
(8.3)
44.8
2.7
22.7
November 21, 2017
8
United Phosphorus | 2QFY2018 Result Update
Balance Sheet (Consolidated)
Y/E March (` cr)
FY2014
FY2015
FY2016
FY2017
FY2018E FY2019E
SOURCES OF FUNDS
Equity Share Capital
86
86
86
183
183
183
Preference Capital
-
-
-
-
-
-
Reserves& Surplus
5,162
5,775
5,803
7,214
8,604
10,413
Shareholders’ Funds
5,247
5,860
5,889
7,398
8,788
10,596
Minority Interest
172
44
44
33
39
45
Total Loans
2,873
2,781
5,258
6,058
6,058
6,058
Other Long term liab.
311
594
449
446
446
446
Long Term Provisions
53
53
53
-
-
-
Deferred Tax Liability
57
45
(390)
(501)
(501)
(501)
Total Liabilities
8,713
9,378
11,303
13,434
14,830
16,645
APPLICATION OF FUNDS
Gross Block
6,039
6,792
9,315
10,115
10,915
11,715
Less: Acc. Depreciation
3,580
4,005
5,870
6,542
7,278
8,070
Net Block
2,459
2,787
3,445
2,632
3,637
3,645
Capital Work-in-Progress
378
378
484
484
484
484
Goodwill / Intangilbles
1,212
1,449
417
1,747
1,747
1,747
Investments
737
764
335
379
379
379
Long Term Loan & Adv.
389
418
591
811
658
757
Current Assets
7,572
8,372
11,207
13,657
15,467
18,306
Cash
1,023
1,010
1,189
2,894
3,214
4,452
Loans & Advances
771
586
840
1,380
1,581
1,582
Other
5,779
6,776
9,178
9,383
10,672
12,272
Current liabilities
4,033
4,789
5,176
6,277
7,542
8,674
Net Current Assets
3,539
3,582
6,031
7,380
7,924
9,633
Others
-
-
-
-
-
-
Total Assets
8,714
9,378
11,303
13,434
14,830
16,645
November 21, 2017
9
United Phosphorus | 2QFY2018 Result Update
Cash Flow Statement (Consolidated)
Y/E March (` cr)
FY2013 FY2014 FY2015 FY2016 FY2017E FY2018E
Profit before tax
1,172
1,413
1,313
1,941
2,345
2,871
Depreciation
407
425
676
672
736
792
Change in Working Capital
171
(86)
(2,443)
135
(70)
(569)
Less: Other income
-
-
-
-
-
-
Direct taxes paid
(222)
(244)
(165)
(189)
(469)
(574)
Cash Flow from Operations
1,528
1,508
(619)
2,559
2,542
2,520
(Inc.)/ Dec. in Fixed Assets
(653)
(753)
(2,630)
(800)
(800)
(800)
(Inc.)/ Dec. in Investments
-
-
-
-
-
-
Inc./ (Dec.) in loans and adv.
-
-
-
-
-
-
Other income
-
-
-
-
-
-
Cash Flow from Investing
(653)
(753)
(2,630)
(800)
(800)
(800)
Issue of Equity
(3)
-
-
98
-
-
Inc./(Dec.) in loans
1,413
(192)
(2,331)
(744)
(0)
(0)
Dividend Paid (Incl. Tax)
(201)
(214)
(214)
(642)
(458)
(458)
Others
(2,612)
(362)
5,973
1,331
(963)
(24)
Cash Flow from Financing
(1,403)
(768)
3,427
43
(1,422)
(482)
Inc./(Dec.) in Cash
(525)
(13)
179
1,705
320
1,238
Opening Cash balances
1,548
1,023
1,010
1,189
2,894
3,214
Closing Cash balances
1,023
1,010
1,189
2,894
3,214
4,452
November 21, 2017
10
United Phosphorus | 2QFY2018 Result Update
Key Ratios
Y/E March
FY2013 FY2014 FY2015 FY2016 FY2017E FY2018E
Valuation Ratio (x)
P/E (on FDEPS)
31.1
28.2
30.8
21.2
20.7
16.9
P/CEPS
22.3
20.6
18.7
15.5
14.8
12.5
P/BV
6.2
5.5
5.5
5.2
4.4
3.6
Dividend yield (%)
0.5
0.7
0.7
0.9
0.9
0.9
EV/Sales
4.3
3.8
3.4
2.9
2.5
2.1
EV/EBITDA
25.1
21.0
21.4
16.3
13.7
11.4
EV / Total Assets
5.3
4.9
4.3
3.5
3.2
2.8
Per Share Data (`)
EPS (Basic)
24.3
26.7
24.5
35.5
36.5
44.7
EPS (fully diluted)
24.3
26.7
24.5
35.5
36.5
44.7
Cash EPS
33.8
36.7
40.3
48.8
51.0
60.3
DPS
4.0
5.0
5.0
7.0
7.0
7.0
Book Value
122.4
136.7
137.4
145.9
173.3
209.0
DuPont Analysis
EBIT margin
15.0
15.0
11.3
14.4
14.9
15.4
Tax retention ratio
81.1
82.7
87.4
90.3
80.0
80.0
Asset turnover (x)
1.5
1.6
1.6
1.6
1.8
1.9
ROIC (Post-tax)
18.5
20.3
16.0
21.2
20.9
23.1
Cost of Debt (Post Tax)
11.2
15.1
15.3
11.7
10.4
10.4
Leverage (x)
0.5
0.3
0.5
0.6
0.4
0.2
Operating ROE
21.9
22.0
16.3
26.5
24.9
26.1
Returns (%)
ROCE (Pre-tax)
17.7
19.9
15.4
19.1
19.9
21.2
Angel ROIC (Pre-tax)
23.2
24.7
18.3
23.7
26.3
29.0
ROE
21.0
20.6
17.9
27.1
22.8
23.4
Turnover ratios (x)
Asset Turnover (Gross Block)
1.9
1.9
1.7
1.7
1.8
1.9
Inventory / Sales (days)
83
86
84
84
85
85
Receivables (days)
83
86
84
84
85
85
Payables (days)
69
72
68
70
71
71
WCcycle (ex-cash) (days)
92
78
96
104
89
84
Solvency ratios (x)
Net debt to equity
0.6
0.4
0.3
0.7
0.4
0.3
Net debt to EBITDA
1.8
1.0
0.8
1.8
1.1
0.8
Interest Coverage (EBIT / Int.)
3.3
3.5
2.3
3.2
3.6
4.2
November 21, 2017
11
United Phosphorus | 2QFY2018 Result Update
Research Team Tel: 022 - 39357800
DISCLAIMER
Angel Broking Private Limited (hereinafter referred to as “Angel”) is a registered Member of National Stock Exchange of India Limited,
Bombay Stock Exchange Limited and Metropolitan Stock Exchange Limited. It is also registered as a Depository Participant with CDSL
and Portfolio Manager with SEBI. It also has registration with AMFI as a Mutual Fund Distributor. Angel Broking Private Limited is a
registered entity with SEBI for Research Analyst in terms of SEBI (Research Analyst) Regulations, 2014 vide registration number
INH000000164. Angel or its associates has not been debarred/ suspended by SEBI or any other regulatory authority for accessing
/dealing in securities Market. Angel or its associates/analyst has not received any compensation / managed or co-managed public
offering of securities of the company covered by Analyst during the past twelve months.
This document is solely for the personal information of the recipient, and must not be singularly used as the basis of any investment
decision. Nothing in this document should be construed as investment or financial advice. Each recipient of this document should make
such investigations as they deem necessary to arrive at an independent evaluation of an investment in the securities of the companies
referred to in this document (including the merits and risks involved), and should consult their own advisors to determine the merits
and risks of such an investment.
Reports based on technical and derivative analysis center on studying charts of a stock's price movement, outstanding positions and
trading volume, as opposed to focusing on a company's fundamentals and, as such, may not match with a report on a company's
fundamentals. Investors are advised to refer the Fundamental and Technical Research Reports available on our website to evaluate the
contrary view, if any.
The information in this document has been printed on the basis of publicly available information, internal data and other reliable
sources believed to be true, but we do not represent that it is accurate or complete and it should not be relied on as such, as this
document is for general guidance only. Angel Broking Pvt. Limited or any of its affiliates/ group companies shall not be in any way
responsible for any loss or damage that may arise to any person from any inadvertent error in the information contained in this report.
Angel Broking Pvt. Limited has not independently verified all the information contained within this document. Accordingly, we cannot
testify, nor make any representation or warranty, express or implied, to the accuracy, contents or data contained within this document.
While Angel Broking Pvt. Limited endeavors to update on a reasonable basis the information discussed in this material, there may be
regulatory, compliance, or other reasons that prevent us from doing so.
This document is being supplied to you solely for your information, and its contents, information or data may not be reproduced,
redistributed or passed on, directly or indirectly.
Neither Angel Broking Pvt. Limited, nor its directors, employees or affiliates shall be liable for any loss or damage that may arise from
or in connection with the use of this information.
Disclosure of Interest Statement
UPL
1. Financial interest of research analyst or Angel or his Associate or his relative
No
2. Ownership of 1% or more of the stock by research analyst or Angel or associates or relatives
No
3. Served as an officer, director or employee of the company covered under Research
No
4. Broking relationship with company covered under Research
No
Ratings (Based on expected returns
Buy (> 15%)
Accumulate (5% to 15%)
Neutral (-5 to 5%)
over 12 months investment period):
Reduce (-5% to -15%)
Sell (< -15)
November 21, 2017
12