2QFY2018 Result Update | Pharmaceutical
November 24, 2017
Sun Pharma
BUY
CMP
`535
Performance Highlights
Target Price
`615
% chg
% chg
Investment Period
12 months
(` cr)
2QFY2018
1QFY2018
2QFY2017
(qoq)
(yoy)
6,590
6,167
6.9
7,764
(15.1)
Net sales
Stock Info
Other income
315
194
62.3
621
(49.2)
Sector
Pharm aceutical
4,713
4,489
5.0
5,924
(20.5)
Gross profit
Market Cap (` cr)
128,411
1,315
1,054
24.9
2,667
(50.7)
Net Debt (` cr)
(8,242)
Operating profit
Beta
0.7
Adj. Net profit
1,002
632
58.6
2,471
(59.5)
52 Week High / Low
731/433
Avg. D aily Volum e
477,916
Source: Company, Angel Research
Face Value (`)
1
For 2QFY2018, sales came in at `6,590cr (`7,118cr expected) v/s. `7,764cr in
BSE Sensex
33,562
2QFY2017, a yoy de-growth of 15.1%, following a decline in US sales (which was
Nifty
10,342
impacted on the back of pricing pressures and base effect). On operating front,
Reuters Code
SUN.BO
Bloom berg Code
SUNP@IN
the EBITDA margins came in at 20.0% as expected v/s. 34.3% in 2QFY2017, mainly
on the back of lower sales during the quarter and base effect. Thus, Adj. net profit
Shareholding Pattern (%)
came in at `1,002cr V/s `2,471cr in 2QFY2017, a yoy dip of 59.5%. The management
Prom oters
54.4
has maintained top-line guidance of high-single-digit decline in FY2018; EBITDA
MF / Banks / Indian Fls
18.5
margin guidance is also maintained at 20-22% for 2HFY18. We maintain our BUY.
FII / NRIs / OCBs
18.7
Indian Public / Others
8.4
US impact sales: Sales came in at `6,590cr (`7,118cr expected) v/s. `7,764cr in
2QFY2017, a yoy de-growth of 15.1%, following a decline in US sales (which was
Abs . (% )
3m
1 yr
3 yr
Sensex
6.3
29.3
17.8
impacted on the back of pricing pressures and base effect). US sales came in at
Sun Pharma
14.2
(22.4)
(36.1)
`1986cr, a yoy dip of 46.5%. Domestic Formulation sales were `2,221cr, a yoy growth
of 10.5%. On operating front, the EBITDA margins came in at 20.0% as expected v/s.
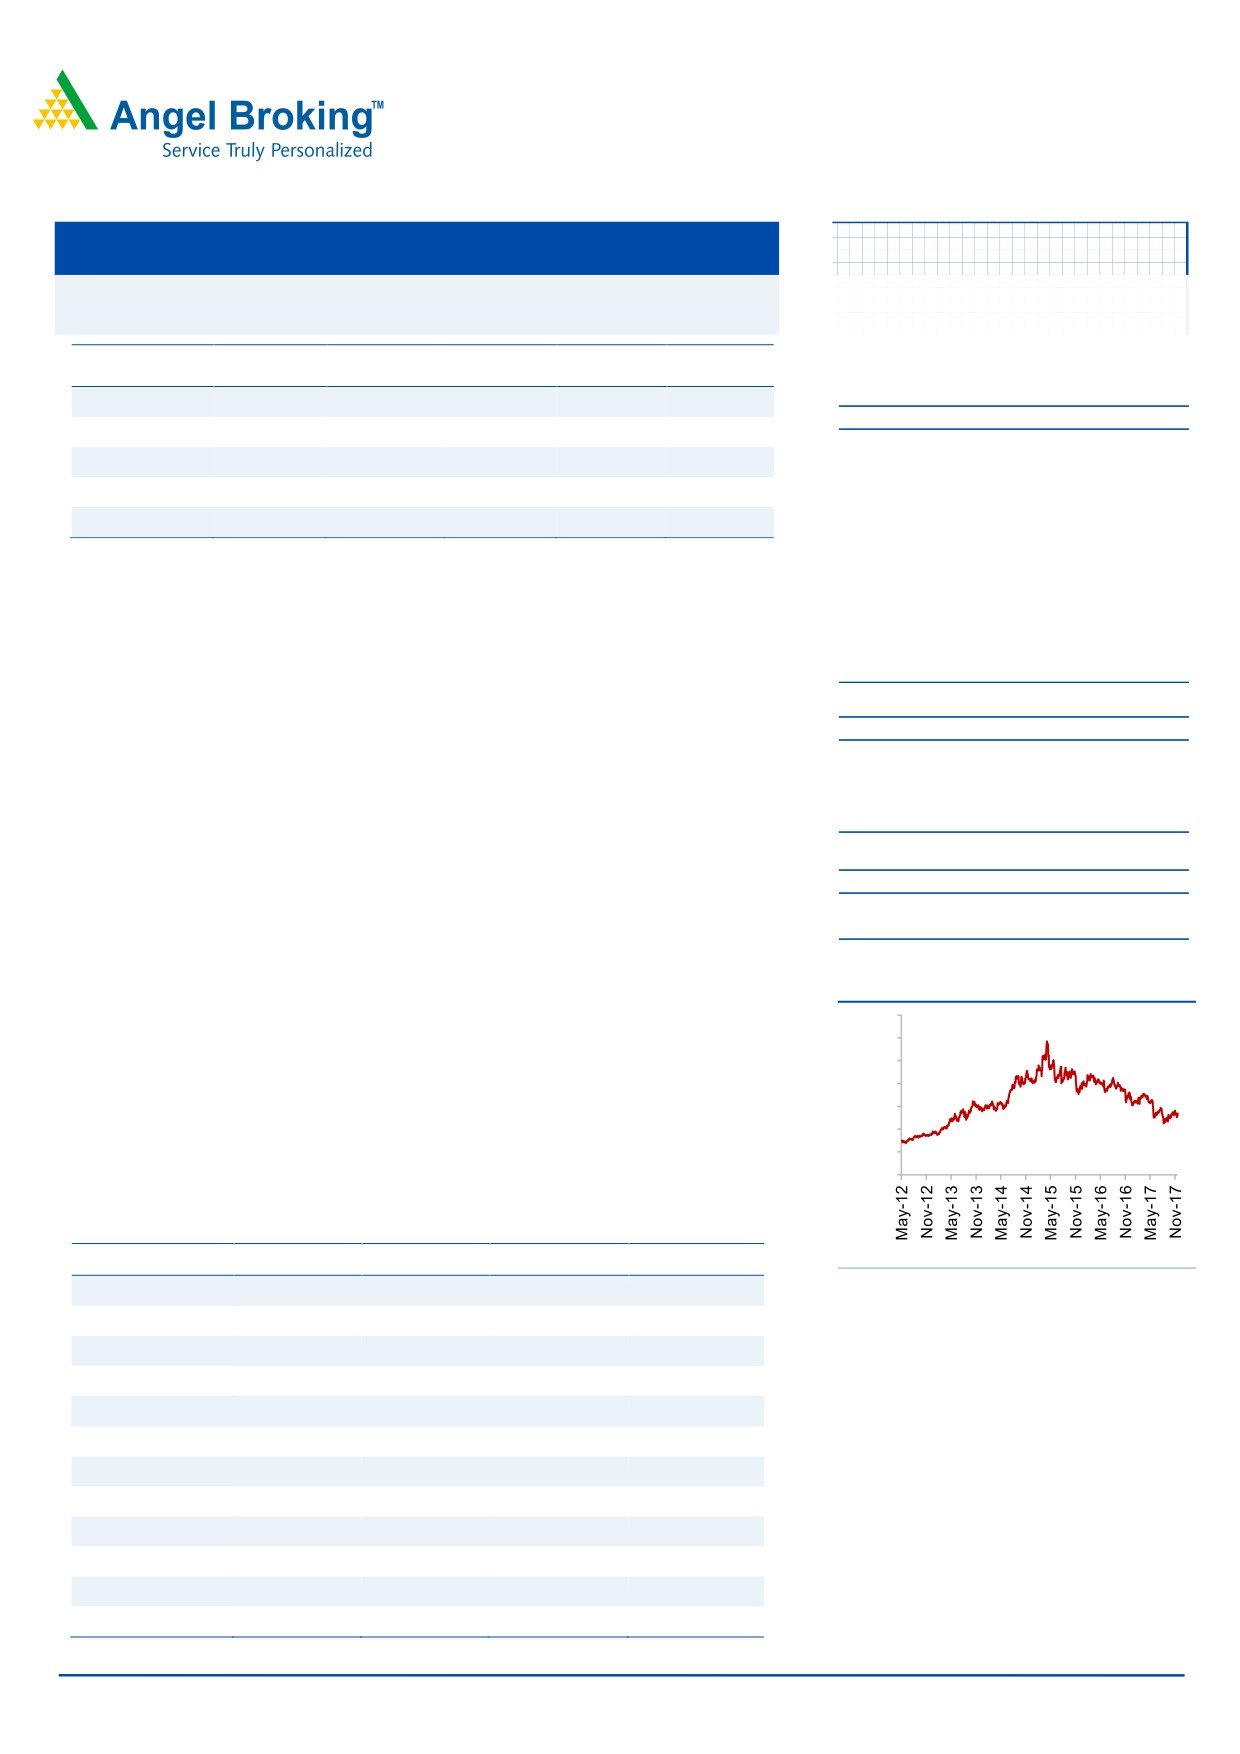
3-year price chart
34.3% in 2QFY2017, mainly on the back of lower sales during the quarter and base
1,400
effect. Thus, Adj. net profit came in at `1,002cr V/s `2,471cr in 2QFY2017, a yoy dip
1,200
of 59.5%.
1,000
Outlook and valuation: We expect its net sales to post a CAGR of 2.5% to `31,826cr
800
600
and EPS to come in at `24.8 over FY2017-19E. %. The management has maintained
400
top-line guidance of high-single-digit decline in FY2018; EBITDA margin guidance is
200
also maintained at 20-22% for 2HFY18.We maintain a Buy rating.
0
Key financials (Consolidated)
Y/E March (` cr)
FY2016
FY2017
FY2018E
FY2019E
Source: Company, Angel Research
Net sales
27,888
30,264
28,466
31,826
% chg
2.2
8.5
(5.9)
11.8
Adj. Net profit
6,248
7,846
5,101
5,949
% chg
31.7
25.6
(35.0)
16.6
EPS (`)
26.0
32.7
21.3
24.8
EBITDA margin (%)
24.6
29.0
20.8
22.4
P/E (x)
18.7
14.8
22.8
19.6
RoE (%)
21.0
22.2
13.0
15.2
RoCE (%)
15.6
18.8
11.5
12.3
P/BV (x)
Sarabjit Kour Nangra
3.5
3.2
2.9
2.6
+91 22 39357600 Ext: 6806
EV/Sales (x)
4.0
3.6
3.7
3.2
EV/EBITDA (x)
16.3
12.5
17.9
14.4
Source: Company, Angel Research; Note: CMP as of November 22, 2017
Please refer to important disclosures at the end of this report
1
Sun Pharma | 2QFY2018 Result Update
Exhibit 1: 2QFY2018 performance (Consolidated)
Y/E March (` cr)
2QFY2018
1QFY2018
% chg QoQ 2QFY2017
% chg yoy 1HFY2018 1HFY2017
% chg
Net sales
6,590
6,167
6.9
7,764
(15.1)
12,757
15,756
(19.0)
315.1
194.1
62.3
620.5
(49.2)
509
1,037
(50.9)
Other income
Total income
6,905
6,361
8.6
8,385
(17.6)
13,266
16,793
(21.0)
Gross profit
4,713
4,489
5.0
5,924
(20.5)
9,202
12,069
(23.8)
Gross margin (%)
71.5
72.8
76.3
72.1
76.6
Operating profit
1,315
1,054
24.9
2,667
(50.7)
2,369
5,328
(55.5)
20.0
17.1
34.3
18.6
33.8
Operating margin (%)
Interest
157
109
43.9
54
193.1
267
188
41.7
Depreciation
359
347
3.5
304
18.0
705
620
13.8
Extraordinary item loss/ ( gain)
0
951
0
951
0
PBT
1,114
792
40.8
2,930
(62.0)
1,906
5,557
(65.7)
111
161.8
(31.1)
441.7
(74.8)
273
794
(65.6)
Provision for taxation
PAT before extra-ordinary item
1,003
630
59.3
2,488
(59.7)
1,633
4,763
(65.7)
Minority interest(MI)
(1)
(2)
(38.4)
17
(3)
(24)
Reported PAT
1,002
632
58.6
2,471
(59.5)
1,636
4,739
(65.5)
Adj. PAT/(Loss)
1,002
(323)
-
2,471
(59.5)
679
4,739
(85.7)
4.2
2.6
9.3
6.8
17.7
Adj. EPS (`)
Source: Company, Angel Research
Exhibit 2: 2QFY2018 - Actual V/s Angel estimates
(` cr)
Actual
Estimates
Variance (%)
Net sales
6,590
7,118
(7.4)
Other income
315
200
57.6
1,315
1,422
(7.5)
Operating profit
Tax
111
162
(31.1)
Adj. Net profit
1,002
752
33.3
Source: Company, Angel Research
Sales lower than expectations: Sales came in at `6,590cr (`7,118cr expected)
v/s. `7,764cr in 2QFY2017, a yoy de-growth of 15.1%, following a decline in the
US (which was impacted on back of pricing pressures and base effect). India
sales at `1,761cr (which accounted for 33.7% of sales) were up by 10.5% yoy,
while Exports (`3,956cr) were down 26% yoy, following a 46.5% yoy dip in the US
sales during the quarter.
Sales in the US were US$309mn for the quarter, a de-growth of 44% yoy over
same period last year and accounted for 30% of total sales. Taro posted
2QFY2018 sales of US$170mn, down 26% over 2QFY2017. For the first half, sales
were US$331mn, down 28% over first half last year. Taro’s net profit for 2QFY2018
was US$ 52mn, down by 58% over 2QFY2017. Net profit for 1HFY2018 was
US$107mn, down by 54% over first half last year.
Sales in emerging markets were at US$196mn for 2QFY2018, a growth of 16% yoy
and accounted for 19% of total sales. The growth was partly boosted by the
consolidation of the Biosintez acquisition in Russia.
November 24, 2017
2
Sun Pharma | 2QFY2018 Result Update
Formulation sales in Rest of World (ROW) markets excluding US and Emerging
Markets were US$111mn in 2QFY2018, a growth of 37% from 2QFY2017 and
accounting for 11% of revenues. The growth was partly boosted by the
consolidation of revenues from the acquisition of 14 brands from Novartis.
The company had a total of 422 ANDAs filed with the USFDA. Currently, ANDAs
for 136 products await USFDA approval, including 15 tentative approvals. For
the quarter, 4 ANDAs were filed and 3 approvals were received. Additionally,
the pipeline includes 37 approved NDAs while 4 NDAs await USFDA approval.
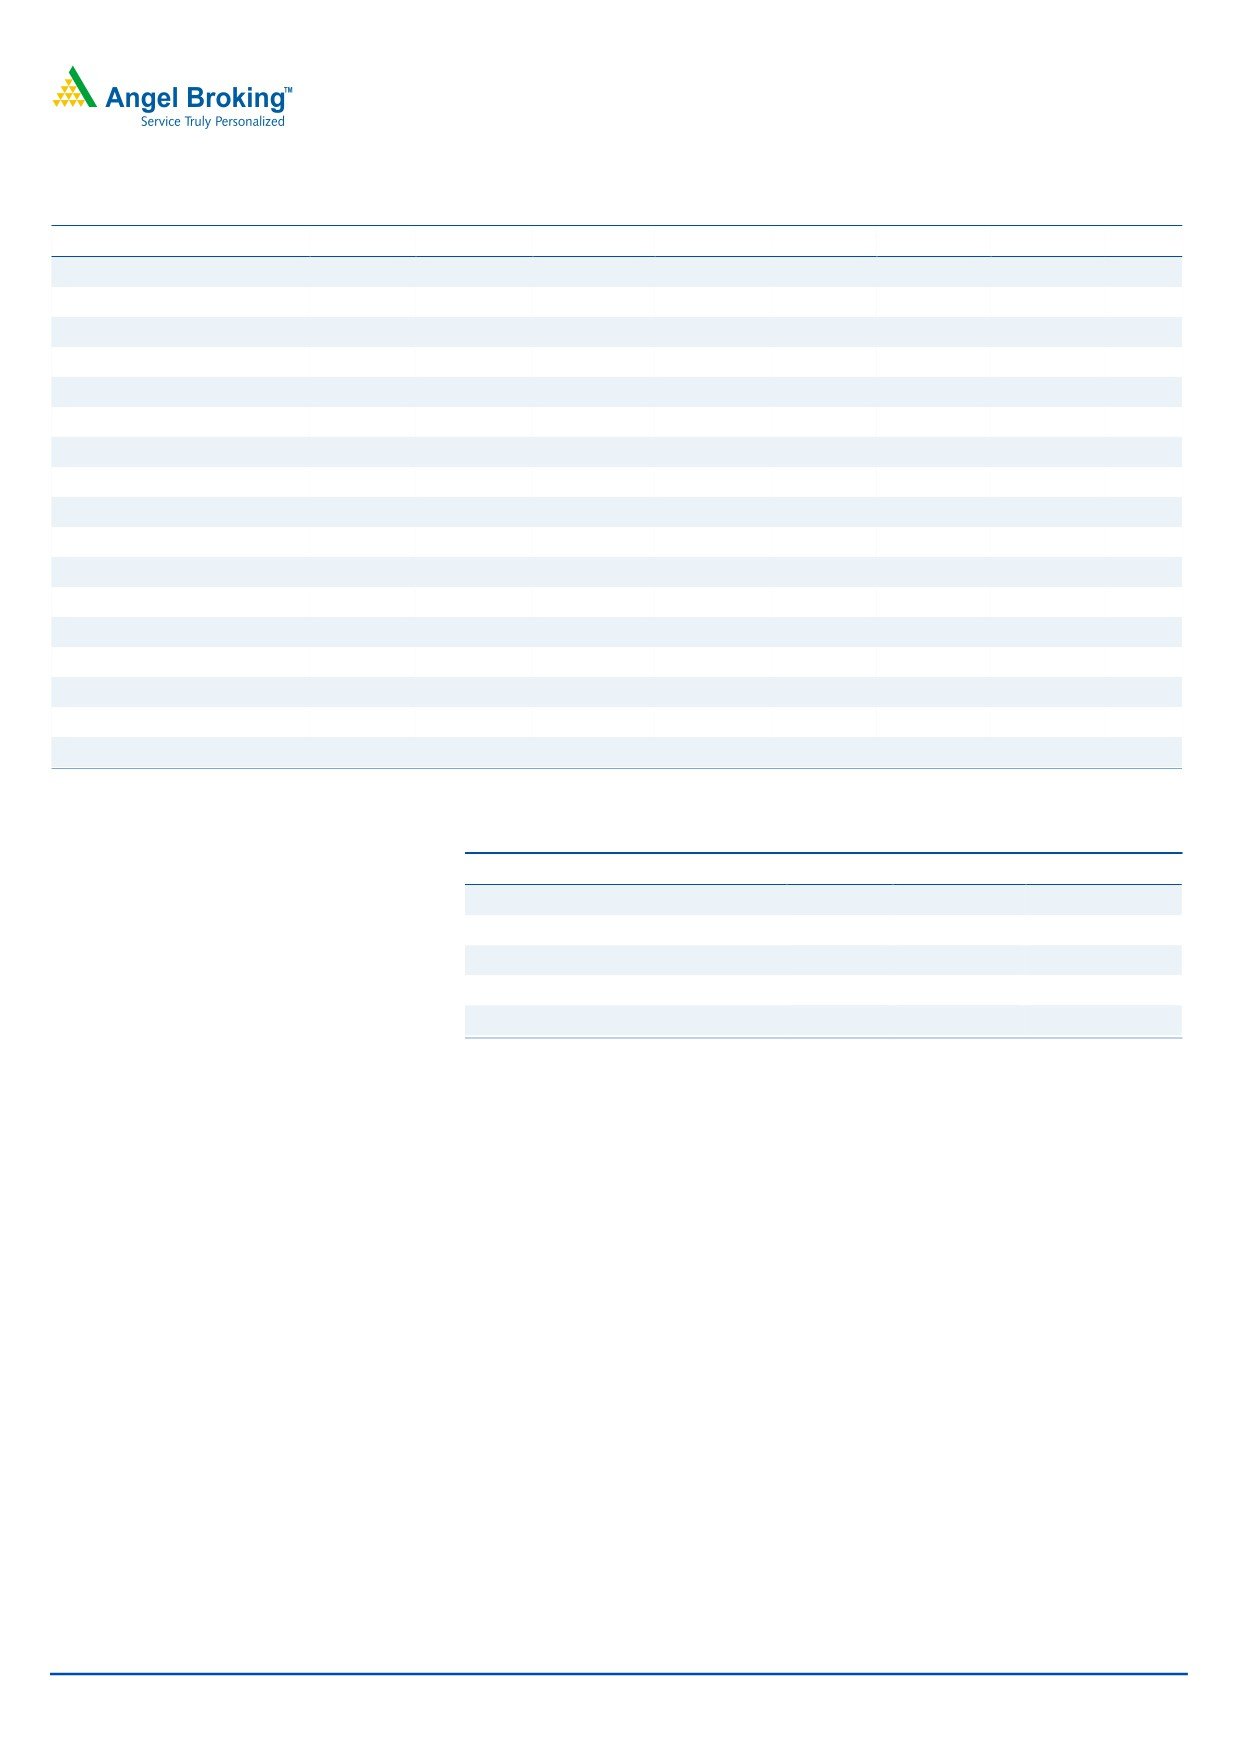
Exhibit 3: Sales trend
7000
5755
5714
6000
4909
5000
4406
4369
4000
3000
2221
2010
1969
1916
1761
2000
1000
0
2QFY2017
3QFY2017
4QFY2017
1QFY2018
2QFY2018
Domestic Formulation
Export Formulation, Bulk and others
Source: Company, Angel Research
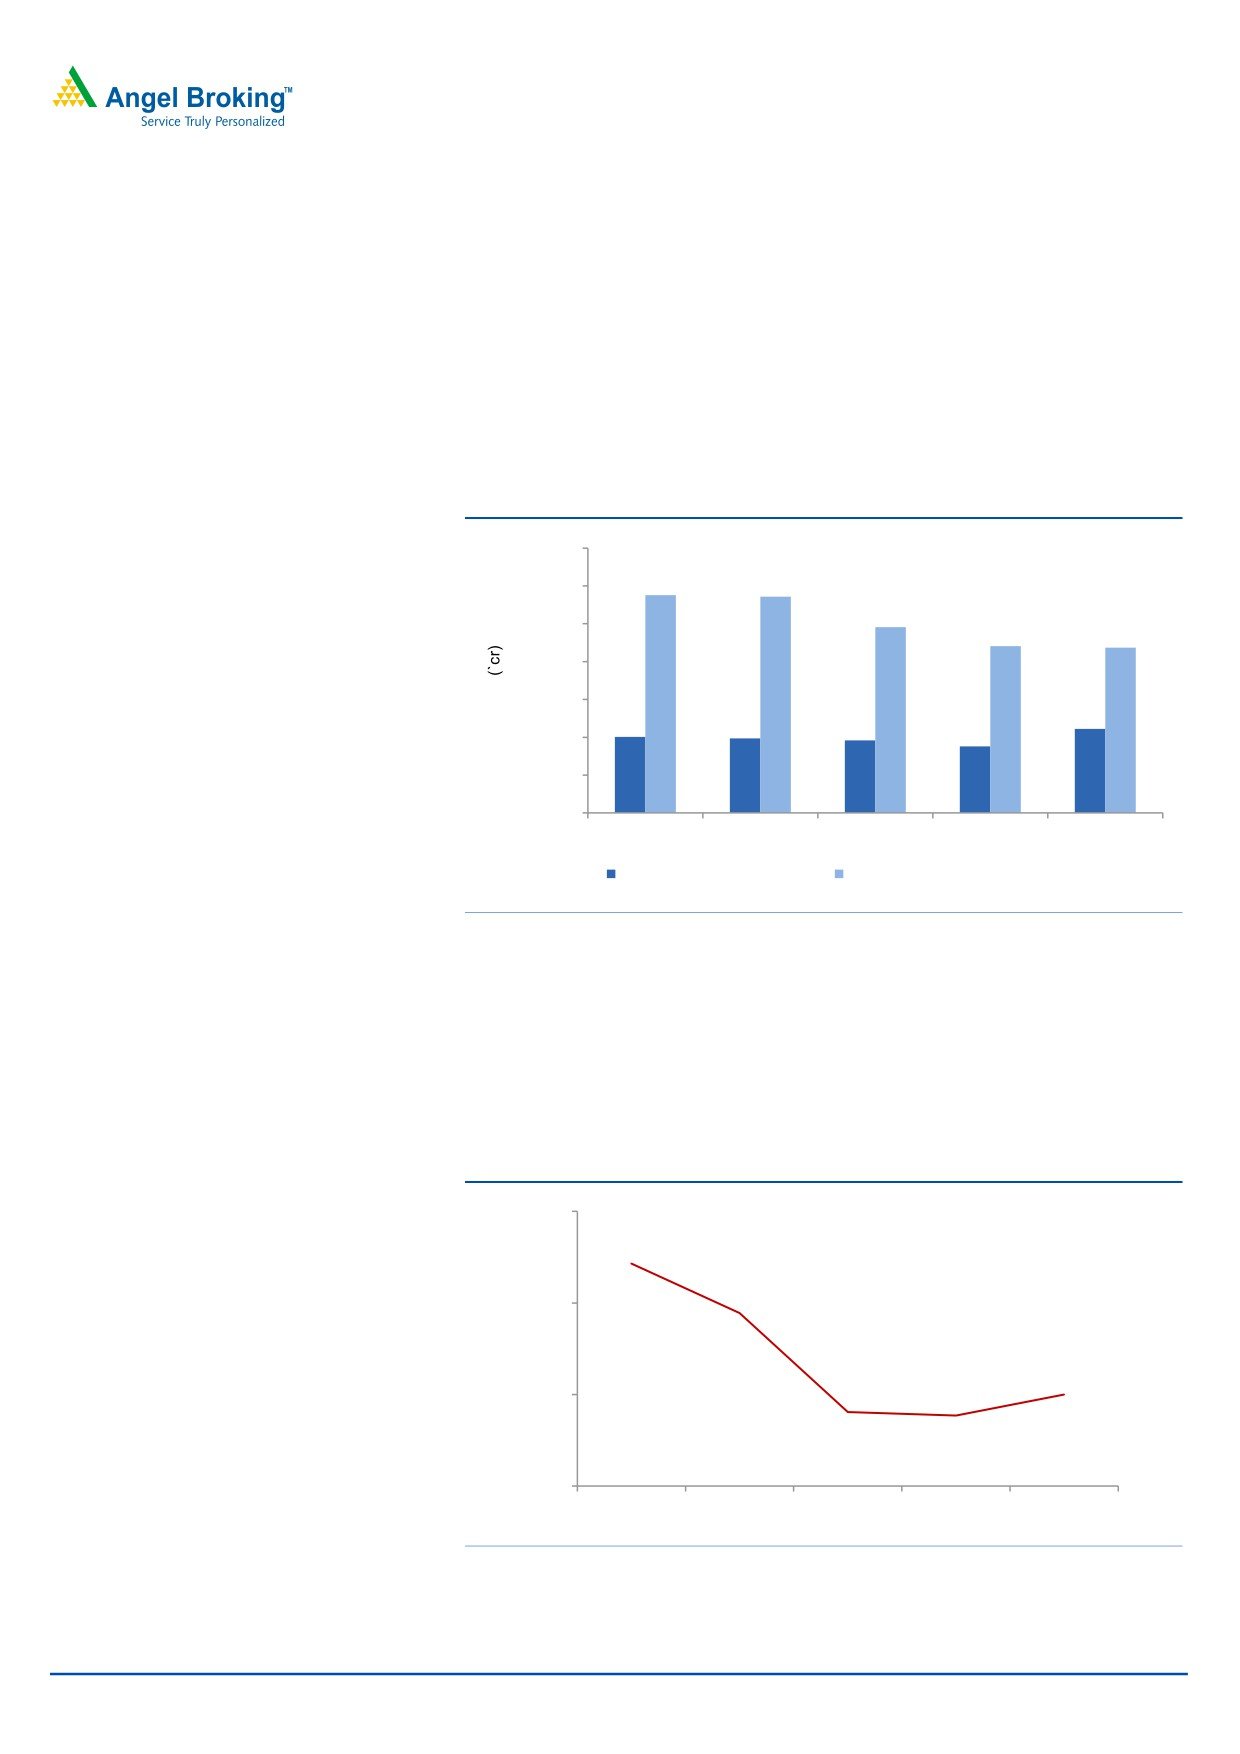
OPM at 20.0%, lower than expected: On operating front, the EBITDA margins
came in at 20.0% as expected v/s. 34.3% in 2QFY2017, mainly on the back of
lower sales during the quarter and base effect. Gross margins came in at 71.5%
v/s. 76.3% in 2QFY2017, while R&D expenses were at 8.5% of sales v/s 7.3% of
sales during the last corresponding period.
Exhibit 4: OPM trend (%)
40.0
34.3
28.9
30.0
20.0
18.1
20.0
17.7
10.0
2QFY2017
3QFY2017
4QFY2017
1QFY2018
2QFY2018
Source: Company, Angel Research,
November 24, 2017
3
Sun Pharma | 2QFY2018 Result Update
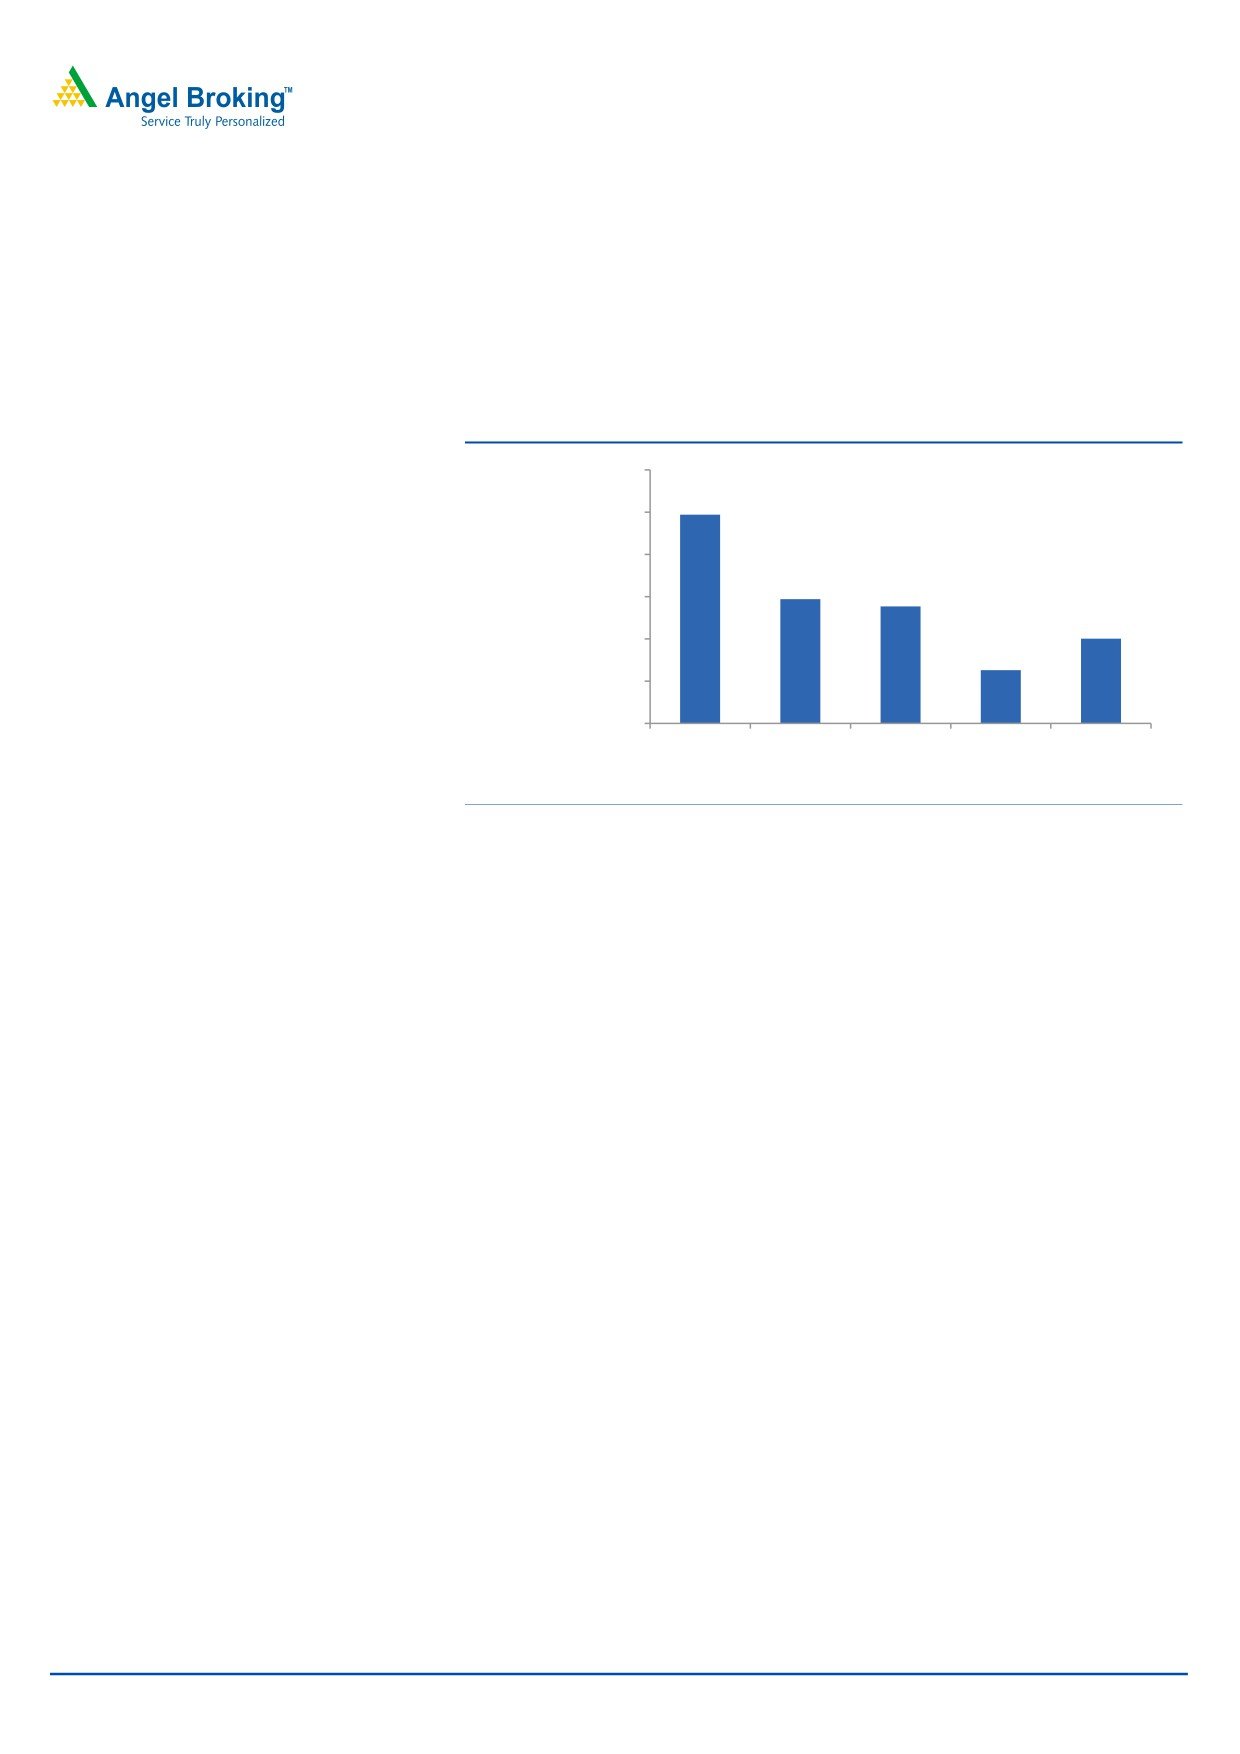
Net profit above expectations; mainly driven by other income:
Thus, Adj. net profit came in at `1,002cr V/s `2,471cr in 2QFY2017, a yoy dip of 59.5%,
but higher compared to `752cr expected, mainly on back of better than expected
other income. The yoy dip was mainly on back of lower sales and base effect, further
augmented by the 193.1% yoy rise in interest expenses.
Exhibit 5: Adjusted Net profit trend (` cr)
3,000
2,471
2,500
2,000
1,472
1,386
1,500
1,002
1,000
632
500
0
2QFY2017
3QFY2017
4QFY2017
1QFY2018
2QFY2018
Source: Company, Angel Research
Concall takeaways
The management has maintained top-line guidance of high-single-digit
decline in FY2018.
Company expects US FDA inspection at Halol before CY2017-end
2HFY2018E EBITDA margin to be ~20-22%.
MK-3222- EU approval deferred to CY2018-end/CY2019- beginning; US
approval expected in 2018.
Investment arguments
Strongest ANDA pipeline: Sun Pharma, with the recent acquisitions of DUSA,
URL Pharma and Ranbaxy Laboratories, has now become strong in the US
region, which accounted for 37% of its sales in FY2017. In terms of ANDAs,
the company cumulatively has 422 products, out of which 136 products
now await USFDA approval, including 15 tentative approvals. With the
merger of Ranbaxy Laboratories, the company is now the fifth-largest
specialty generics company in the world (behind Teva, Sandoz, Activas and
Mylan). However, the near term performance of the company has been
impacted on the back of supply constraints at the Halol facility; although
the company has taken redemption measures including site transfers. Also,
during FY2018, the company like other generic players in the US is expecting
a pricing dip on back of the consolidation in the buyers chain (4 players
hold now 90% market share). Overall, we expect the region to post a CAGR
of -10.5% in sales over FY2017-19E, accounting for almost 34% of the overall
sales in FY2019E.
November 24, 2017
4
Sun Pharma | 2QFY2018 Result Update
Domestic business: Sun Pharma’s domestic formulation business is among
the fastest growing in the Indian pharmaceutical industry. It contributed 23%
to the company’s total turnover in FY2014. Sun Pharma, with Ranbaxy
Laboratories’ merger, is now the segment leader with a market share of 8.7%
in the domestic formulation market, followed by Abbott India, which has a
market share of 6.5%. This is a significant gap considering that the segment
is highly fragmented. We expect the domestic formulation business to post
a CAGR of 15.0% over FY2017-19E, contributing
32% to the overall
formulation sales of the company in FY2019.
Healthy balance sheet: Sun Pharma has one of the strongest balance sheets
in the sector with cash of ~`15,000cr. The same can continue to support the
Management in inorganic growth and in scouting for acquisitions,
especially in the US and in emerging markets.
Outlook and valuation: Sun Pharma is one of the largest and fastest growing
Indian pharmaceutical companies. We expect its net sales to post a CAGR
of 2.5% (including Ranbaxy Laboratories) to `31,826cr and EPS to post a
CAGR of 8.0% to `24.8 over FY2017-19E. We recommend a Buy.
Exhibit 6: Key assumptions
FY2018E
FY2019E
Domestic Formulation sales growth (%)
10.0
20.0
Export Formulation sales growth (%)
(11.8)
9.9
Growth in employee expenses (%)
15.0
15.0
Operating margins (%)
20.7
22.4
Tax as % of PBT
15.0
15.0
Source: Company, Angel Research
Exhibit 7: One-year forward PE band
1,200
1,000
800
600
400
200
-
10x
15x
20x
25x
Source: Company, Angel Research
November 24, 2017
5
Sun Pharma | 2QFY2018 Result Update
Exhibit 8: Valuation summary
Company
Reco
CMP Tgt. Price Upside
FY2019E
FY17-19E
FY2019E
PE
EV/Sales
EV/EBITDA
CAGR in EPS
RoCE
RoE
(`)
(`)
%
(x)
(x)
(x)
(%)
(%)
(%)
Alembic Pharma
Buy
511
600
17.3
21.4
2.9
13.0
5.7
20.6
18.4
Aurobindo Pharma Buy
699
823
17.8
13.6
2.5
9.9
14.2
25.3
22.7
Cadila Healthcare Reduce
443
411
(7.2)
21.6
4.1
17.6
18.9
16.5
22.2
Cipla
Sell
619
462
(25.3)
25.5
3.2
16.2
39.3
10.9
13.1
Dr Reddy's
Reduce
2,361
2,040
(13.6)
23.2
3.1
13.3
18.5
10.3
12.4
Dishman Pharma
Under Review
301
-
-
19.3
2.7
10.1
23.3
4.5
4.4
GSK Pharma
Sell
2,496
2,000
(19.9)
53.9
6.9
39.3
19.3
25.8
23.5
Indoco Remedies Sell
280
136
(49.0)
23.5
2.1
14.9
16.2
10.1
14.5
Ipca labs
Neutral
535
-
-
21.2
1.9
13.5
24.7
12.4
11.0
Lupin
Buy
828
1,091
31.8
16.7
2.4
9.3
(6.6)
13.7
13.7
Sanofi India*
Neutral
4,434
-
-
27.1
3.8
17.0
12.8
25.8
27.5
Sun Pharma
Buy
535
615
15.0
24.0
3.7
16.3
(17.5)
11.3
14.0
Source: Company, Angel Research; Note: * December year ending
Company background
Sun Pharma is an international specialty pharma company, with a large
presence in the US and India, and a footprint across 40 other markets. In India
and rest of the world markets, the key chronic therapy areas for the company
are cardiology, psychiatry, neurology, gastroenterology, diabetology, etc. The
company is a market leader in specialty therapy areas in India. In India, the
company has emerged as a leading pharma company, where it is the third
largest player. Also, in the US, a key geography, the company has expanded
significantly through both in-organic and organic routes.
November 24, 2017
6
Sun Pharma | 2QFY2018 Result Update
Profit & Loss statement (Consolidated)
Y/E March (` cr)
FY2015
FY2016
FY2017
FY2018E FY2019E
27,652
28,254
30,536
28,569
32,115
Gross sales
Less: Excise duty
366
366
272
257
289
Net sales
27,287
27,888
30,264
28,312
31,826
147
599
1,314
599
599
Other operating income
Total operating income
27,433
28,487
31,578
28,911
32,425
70.6
3.8
10.9
-8.4
12.2
% chg
Total expenditure
19,470
21,014
21,489
22,446
24,699
Net raw materials
6,739
6,330
8,131
7,644
8,550
1,192
1,218
1,322
1,237
1,390
Other mfg costs
Personnel
4,430
4,772
4,902
5,638
6,483
7,109
8,693
7,134
7,927
8,275
Other
EBITDA
7,817
6,874
8,775
5,866
7,127
% chg
12.9
(12.1)
(27.5)
(56.5)
3.7
28.6
24.6
29.0
20.7
22.4
(% of Net Sales)
Depreciation & amort.
1,195
1,038
1,265
1,465
1,665
6,622
6,436
8,825
5,000
6,061
EBIT
% chg
1.7
(2.8)
(18.7)
(43.3)
21.2
(% of Net Sales)
24.3
23.1
29.2
17.7
19.0
579
523
400
400
400
Interest & other charges
Other income
451
1,248
623
623
623
6.8
17.4
6.9
11.9
9.9
(% of PBT)
Share in profit of Asso.
-
-
-
1.0
Recurring PBT
6,641
7,161
9,048
5,223
6,285
(6.4)
7.8
(16.8)
0.0
0.1
% chg
Extraordinary expense/(inc.)
237.8
589.9
-
951
-
6,641
7,161
9,048
4,272
6,285
PBT (reported)
Tax
914.7
913.8
1,211.6
640.9
942.7
(% of PBT)
13.8
12.8
13.4
15.0
15.0
5,726
6,247
7,836
3,632
5,342
PAT (reported)
Add: Share of earnings of asso.
(13)
1
10
-
-
936
-
-
-
-
Less: Minority interest (MI)
Prior period items
-
-
-
-
4,539
5,658
7,846
3,632
5,342
PAT after MI (reported)
4,743
6,248
7,846
4,440
5,342
ADJ. PAT
% chg
(10.0)
31.7
65.4
(53.7)
47.1
16.6
0.0
1.0
2.0
3.0
(% of Net Sales)
Basic EPS (`)
22.9
26.0
32.7
18.5
22.3
22.9
26.0
32.7
18.5
22.3
Fully Diluted EPS (`)
(10.0)
13.4
42.8
(43.4)
20.3
% chg
November 24, 2017
7
Sun Pharma | 2QFY2018 Result Update
Balance Sheet (Consolidated)
Y/E March (` cr)
FY2015
FY2016
FY2017
FY2018E
FY2019E
SOURCES OF FUNDS
207
241
240
240
240
Equity share capital
Preference capital
26,300
32,742
36,400
38,908
43,127
Reserves & surplus
Shareholders’ funds
26,507
32,982
36,640
39,148
43,367
2,851
4,085
3,791
3,791
3,791
Minority interest
Total loans
7,596
8,316
8,091
8,091
8,091
Deferred tax liability
(1,752)
(3,046)
(2,178)
(2,178)
(2,178)
Other Long Term Liabilities
9
-
-
-
-
Long Term Provisions
2,710
2,106
1,342
2,355
2,591
Total liabilities
37,922
44,443
47,685
51,207
55,663
APPLICATION OF FUNDS
15,041
15,084
18,162
19,162
20,162
Gross block
Less: Acc. depreciation
4,863
7,139
8,404
9,869
11,534
10,179
7,945
9,758
9,293
8,628
Net block
Capital work-in-progress
842
842
303
303
303
3,701
9,261
10,417
10,417
10,417
Goodwill
Investments
2,716
1,830
1,192
1,388
1,389
Long term long & adv.
2,736
3,276
4,526
3,956
4,425
27,005
29,227
32,723
34,330
39,831
Current assets
Cash
10,998
13,182
15,141
17,745
21,201
2,193
2,006
2,480
2,332
2,608
Loans & advances
Other
13,813
14,040
15,102
14,253
16,022
9,256
7,938
11,232
8,479
9,330
Current liabilities
Net current assets
17,748
21,290
21,491
25,851
30,501
Others
-
-
-
-
-
Total assets
37,922
44,443
47,685
51,207
55,663
November 24, 2017
8
Sun Pharma | 2QFY2018 Result Update
Cash Flow Statement (Consolidated)
Y/E March (` cr)
FY2015
FY2016
FY2017
FY2018E
FY2019E
Profit before tax
6,641
7,161
9,048
5,223
6,285
Depreciation
1,195
1,038
1,265
1,465
1,665
(Inc)/Dec in working capital
(4,322)
(1,898)
(2,505)
(12,062)
(2,341)
Direct taxes paid
915
914
1,212
641
943
2,598
5,386
6,596
(6,015)
4,665
Cash Flow from Operations
(Inc.)/Dec.in Fixed Assets
(8,653)
(43)
(1,682)
(1,000)
(1,000)
(Inc.)/Dec. in Investments
70
886
1,524
(196)
(1)
Other income
-
-
-
-
-
Cash Flow from Investing
(8,583)
843
(157)
(1,196)
(1,001)
Issue of Equity
-
-
-
-
-
(4,928)
(1,333)
(1,873)
1,013
236
Inc./(Dec.) in loans
Dividend Paid (Incl. Tax)
-
(282)
(1,123)
(1,123)
(1,123)
Others
14,320
(2,431)
(1,485)
9,925
678
9,392
(4,046)
(4,480)
9,815
(209)
Cash Flow from Financing
Inc./(Dec.) in Cash
3,408
2,184
1,959
2,604
3,456
Opening Cash balances
7,590
10,998
13,182
15,141
17,745
10,998
13,182
15,141
17,745
21,201
Closing Cash balances
November 24, 2017
9
Sun Pharma | 2QFY2018 Result Update
Key Ratios
Y/E March
FY2015
FY2016
FY2017
FY2018E
FY2019E
Valuation Ratio (x)
23.4
20.6
16.4
28.9
24.0
P/E (on FDEPS)
P/CEPS
19.3
19.2
14.1
25.2
18.3
P/BV
4.9
3.9
3.5
3.3
3.0
0.6
0.2
0.2
0.2
0.2
Dividend yield (%)
EV/Sales
3.9
4.5
4.0
4.2
3.7
EV/EBITDA
13.7
18.1
13.8
20.4
16.3
2.8
2.8
2.5
2.3
2.1
EV / Total Assets
Per Share Data (`)
EPS (Basic)
22.9
26.0
32.7
18.5
22.3
22.9
26.0
32.7
18.5
22.3
EPS (fully diluted)
Cash EPS
27.7
27.8
38.0
21.2
29.2
3.0
1.0
1.0
1.0
1.0
DPS
110.2
137.1
152.3
162.7
180.2
Book Value
Dupont Analysis
24.3
23.1
29.2
17.7
19.0
EBIT margin
86.2
87.2
86.6
85.0
85.0
Tax retention ratio
Asset turnover (x)
1.2
1.0
1.1
0.9
1.0
26.1
19.7
27.5
13.2
15.5
ROIC (Post-tax)
Cost of Debt (Post Tax)
9.8
5.7
4.4
8.4
4.1
Leverage (x)
0.0
0.0
0.0
0.0
0.0
26.1
19.7
27.5
13.2
15.5
Operating ROE
Returns (%)
ROCE (Pre-tax)
21.1
15.6
18.8
10.1
11.3
38.3
29.6
41.3
22.4
26.1
Angel ROIC (Pre-tax)
ROE
21.1
21.0
22.2
11.5
14.0
Turnover ratios (x)
2.6
1.9
1.9
1.5
1.6
Asset Turnover (Gross Block)
Inventory / Sales (days)
58
77
76
87
90
Receivables (days)
50
76
76
87
90
61
91
95
69
69
Payables (days)
WC cycle (ex-cash) (days)
82
95
71
51
98
Solvency ratios (x)
(0.1)
(0.1)
(0.2)
(0.2)
(0.3)
Net debt to equity
Net debt to EBITDA
(0.4)
(0.7)
(0.8)
(1.6)
(1.8)
Interest Coverage (EBIT/Int.)
-
-
-
-
-
November 24, 2017
10
Sun Pharma | 2QFY2018 Result Update
Research Team Tel: 022 - 39357800
DISCLAIMER
Angel Broking Private Limited (hereinafter referred to as “Angel”) is a registered Member of National Stock Exchange of
India Limited, Bombay Stock Exchange Limited and Metropolitan Stock Exchange Limited. It is also registered as a
Depository Participant with CDSL and Portfolio Manager with SEBI. It also has registration with AMFI as a Mutual Fund
Distributor. Angel Broking Private Limited is a registered entity with SEBI for Research Analyst in terms of SEBI (Research
Analyst) Regulations, 2014 vide registration number INH000000164. Angel or its associates has not been debarred/
suspended by SEBI or any other regulatory authority for accessing /dealing in securities Market. Angel or its
associates/analyst has not received any compensation / managed or co-managed public offering of securities of the
company covered by Analyst during the past twelve months.
This document is solely for the personal information of the recipient, and must not be singularly used as the basis of any
investment decision. Nothing in this document should be construed as investment or financial advice. Each recipient of this
document should make such investigations as they deem necessary to arrive at an independent evaluation of an
investment in the securities of the companies referred to in this document (including the merits and risks involved), and
should consult their own advisors to determine the merits and risks of such an investment.
Reports based on technical and derivative analysis center on studying charts of a stock's price movement, outstanding
positions and trading volume, as opposed to focusing on a company's fundamentals and, as such, may not match with a
report on a company's fundamentals. Investors are advised to refer the Fundamental and Technical Research Reports
available on our website to evaluate the contrary view, if any.
The information in this document has been printed on the basis of publicly available information, internal data and other
reliable sources believed to be true, but we do not represent that it is accurate or complete and it should not be relied on
as such, as this document is for general guidance only. Angel Broking Pvt. Limited or any of its affiliates/ group companies
shall not be in any way responsible for any loss or damage that may arise to any person from any inadvertent error in the
information contained in this report. Angel Broking Pvt. Limited has not independently verified all the information contained
within this document. Accordingly, we cannot testify, nor make any representation or warranty, express or implied, to the
accuracy, contents or data contained within this document. While Angel Broking Pvt. Limited endeavors to update on a
reasonable basis the information discussed in this material, there may be regulatory, compliance, or other reasons that
prevent us from doing so.
This document is being supplied to you solely for your information, and its contents, information or data may not be
reproduced, redistributed or passed on, directly or indirectly.
Neither Angel Broking Pvt. Limited, nor its directors, employees or affiliates shall be liable for any loss or damage that may
Disclosure of Interest Statement
Sun Pharma
1. Financial interest of research analyst or Angel or his Associate or his relative
No
2. Ownership of 1% or more of the stock by research analyst or Angel or associates or relatives
No
3. Served as an officer, director or employee of the company covered under Research
Yes
4. Broking relationship with company covered under Research
No
Ratings (Based on expected returns
Buy (> 15%)
Accumulate (5% to 15%)
Neutral (-5 to 5%)
over 12 months investment period):
Reduce (-5% to -15%)
Sell (< -15)
November 24, 2017
11