2QFY2018 Result Update | Agrichemical
November 21, 2017
Rallis India
SELL
CMP
`231
Performance Highlights
Target Price
‘189
Y/E March (` cr)
2QFY2018 1QFY2018
% chg (qoq) 2QFY2017
% chg (yoy)
Investment Period
12 months
Net sales
588
442
33.1
539
9.1
Other income
3
5
(26.2)
12
(72.1)
Stock Info
354
205
72.2
210
68.4
Gross profit
Sector
Agrichemical
122
69
76.5
96
27.6
Operating profit
Market Cap (` cr)
4,501
77
45
70.7
67
16.1
Adj. Net profit
Net debt (` cr)
(212)
Source: Company, Angel Research
Beta
0.8
52 Week High / Low
265/180
For 2QFY2018 Rallis India (Rallis) reported a yoy growth of 9.1% in sales to `588cr
Avg. Daily Volume
50,723
(v/s. `539cr in 2QFY2017). The performance of Rallis was impacted during the
Face Value (`)
1
quarter on the back of transition to GST and high channel inventory. On the
BSE Sensex
33,478
operating front, the OPM came in at 20.8% (v/s. 17.8% in 2QFY2017). Owing to
Nifty
10,327
lower sales growth the Adjusted Net profit grew by 16.1% yoy to `77cr (v/s. `67cr
Reuters Code
RALL.BO
in 2QFY2017). We recommend a Sell.
Bloomberg Code
RALI@IN
Decent performance; aided by OPM expansion: For 2QFY2018, the company
reported a yoy growth of 9.1% in sales to `588cr (v/s. `539cr in 2QFY2017). The
performance, was impacted during the quarter on back of transition to GST and
Shareholding Pattern (%)
high channel inventory. On the operating front, the gross margin came in at 39.8%
Promoters
50.1
(v/s. 39.0% in 2QFY2017), while marginally higher other expenses aided the OPM
MF / Banks / Indian Fls
21.4
to come in at 20.8% (v/s. 17.8% in 2QFY2017). Owing to lower sales growth, the
FII / NRIs / OCBs
3.6
Adj. Net profit grew by 16.1% yoy to `67cr (v/s. `45cr in 1QFY2018).
Indian Public / Others
25.0
Outlook and valuation: For FY2017-19E, we expect a CAGR of 10.5% and 24.9%
in net sales and profit respectively. At the current levels, the stock is trading at a
Abs. (%)
3m 1yr 3yr
fair valuation of 20.8x its FY2019E EPS. Hence, we downgrade our view from
Sensex
7.0
29.9
18.2
Neutral to Sell.
Rallis India
2.0
26.8
3.3
Key financials (Consolidated)
Y/E March (` cr)
FY2016
FY2017
FY2018E
FY2019E
3-year price chart
400
1,637
1,687
1,837
2,058
Net Sales
350
% chg
(10.1)
3.0
8.9
12.1
300
250
Adj.Net Profit
143
139
180
216
200
% chg
(9.0)
(3.0)
29.6
20.3
150
100
13.3
15.7
15.0
16.0
EBITDA %
50
7.4
7.1
9.2
11.1
0
FDEPS (`)
31.5
32.5
25.0
20.8
P/E (x)
5.0
4.1
3.7
3.3
P/BV (x)
Source: Company, Angel Research
RoE (%)
16.7
13.8
15.5
16.9
RoACE (%)
19.2
20.1
18.4
20.1
Sarabjit Kour Nangra
EV/Sales (x)
2.7
2.5
2.3
2.0
+91-22-39357800 ext. 6806
20.7
15.7
15.1
12.7
EV/EBITDA (x)
Source: Company, Angel Research; Note: CMP as of November 21, 2017
Please refer to important disclosures at the end of this report
1
Rallis India | 2QFY2018 Result Update
Exhibit 1: 2QFY2018 performance (Consolidated)
Y/E March (` cr)
2QFY2018
1QFY2018
% chg (QoQ)
2QFY2017
% chg (YoY) 1HFY2018
1HFY2017
% chg
Net sales
588
442
33.1
539
9.1
1,030
985
4.5
Other income
3
5
(26.2)
4
(10.9)
8
178
(95.2)
Total income
591
446
32.5
551
7.4
1,038
1,163
(10.8)
Gross profit
234
205
14.0
210
11.5
440
412
6.7
Gross margin (%)
39.8
46.5
39.0
42.7
41.8
EBDITA
122
69
76.5
96
27.6
192
166
15.6
EBDITA margin (%)
20.8
15.7
17.8
18.6
16.9
Financial cost
1
1
(32.2)
1
(22.0)
2
3
(35.7)
Depreciation
13
11
9.8
11
14.4
24
23
4.5
PBT
112
61
83.4
96
17.2
174
317
(45.2)
Provision for taxation
35
16
29
21.5
51
76
(32.5)
PAT Before Exc. And MI
77
45
70.7
67
16.1
123
241
(49.2)
Minority
0
0
0
0
0
-
Exceptional
0
0
0
0
120
Reported PAT
77
45
70.7
67
16.1
123
241
(49.1)
Adjusted PAT
77
45
70.7
67
16.1
123
120
1.8
EPS (`)
4.0
2.3
3.4
6.3
6.2
Source: Company, Angel Research
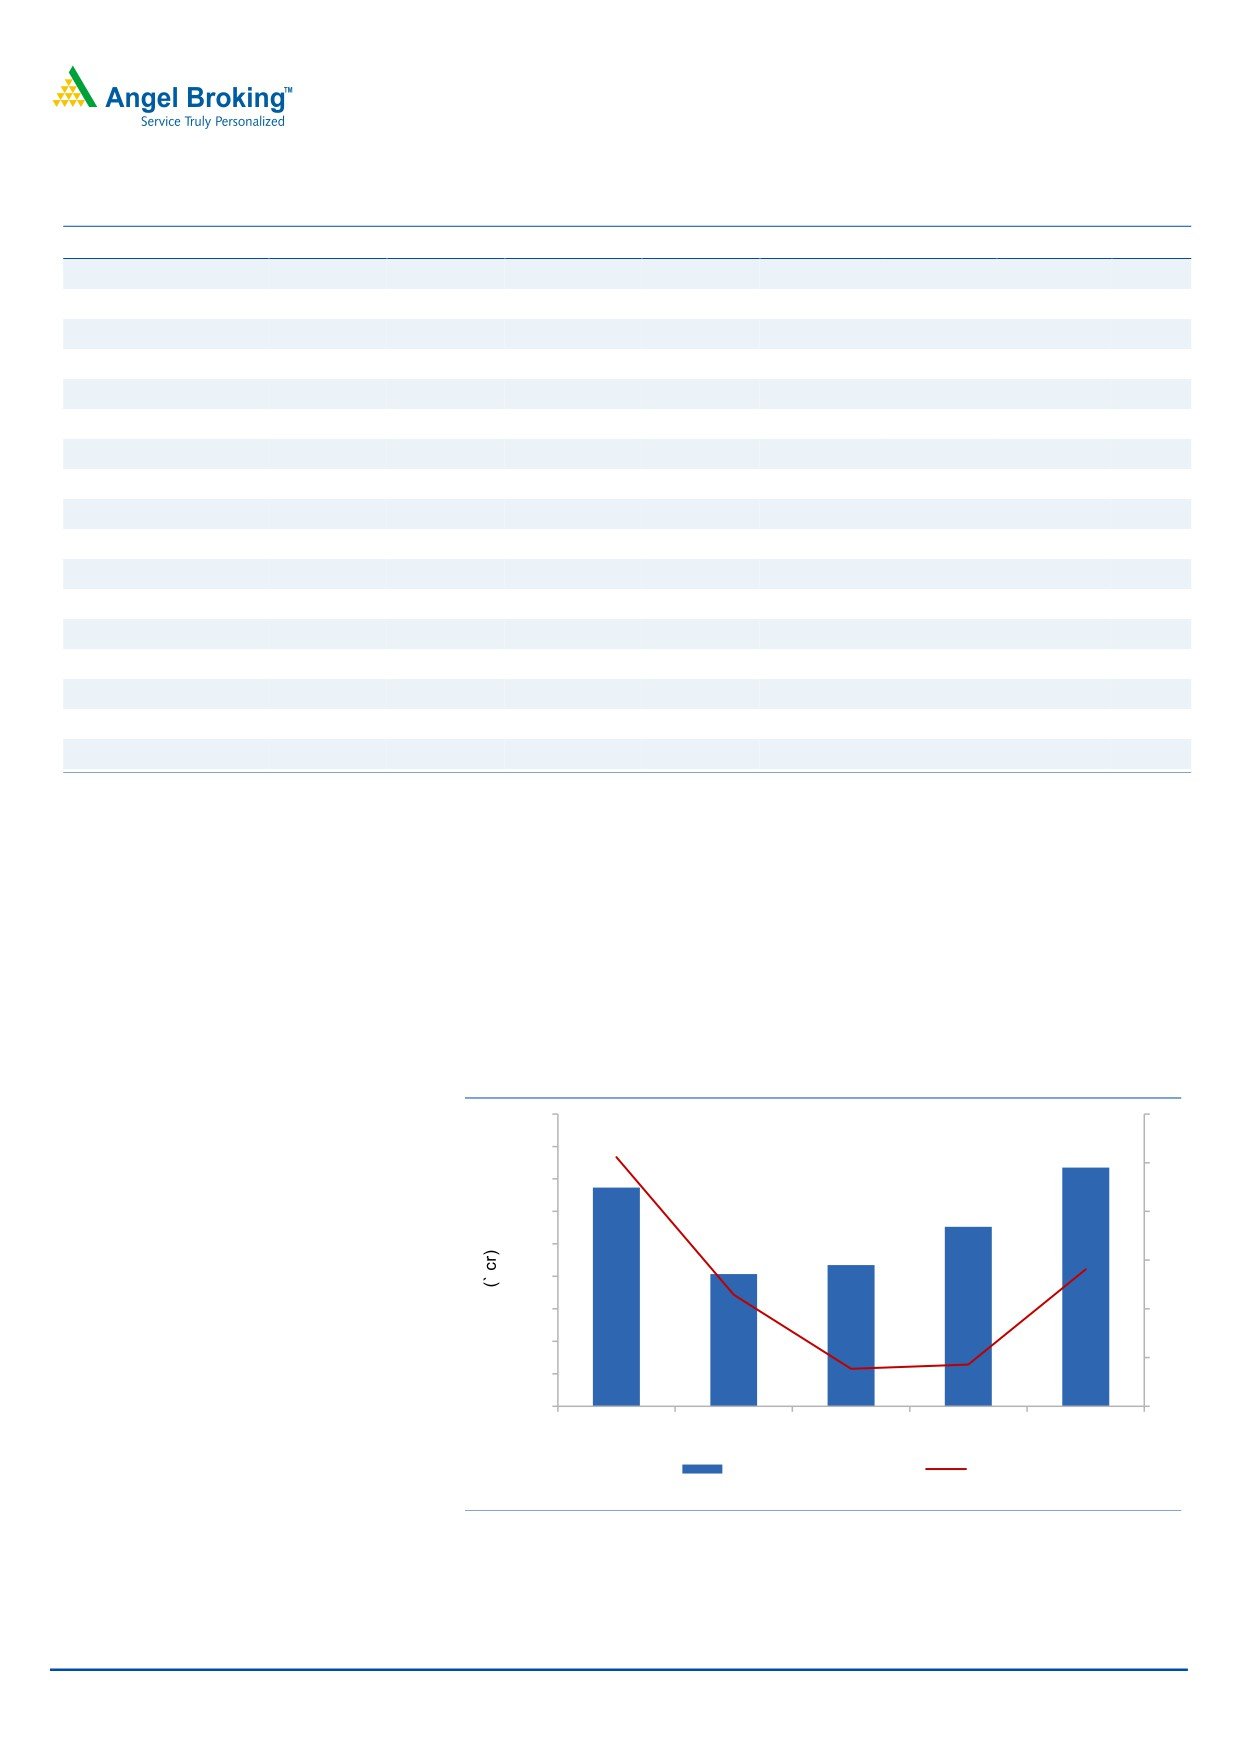
Sales 9.1% yoy growth
For 2QFY2018, the company’s sales grew by 9.1% yoy to `588cr (v/s. `539cr in
2QFY2017). Management has indicated that though the transition to GST has been
smooth, restocking has not been adequately executed. This is owing to a scanty
monsoon and an extended dry spell during Aug-Sept’2017. During the quarter,
Seeds business (Metahelix) reported de-growth of 13% yoy in revenue at `39.3cr.
Operating efficiency narrowed the EBITDA loss at `4.4cr Vs. `5.5cr in 2QFY2017.
Exhibit 2: Revenue performance
720
25
588
640
20
539
560
480
442
15
400
348
326
10
320
240
5
160
0
80
0
(5)
2QFY2017
3QFY2017
4QFY2017
1QFY2018
2QFY2018
Total Revenue
% YoY
Source: Company, Angel Research
November 21, 2017
2
Rallis India | 2QFY2018 Result Update
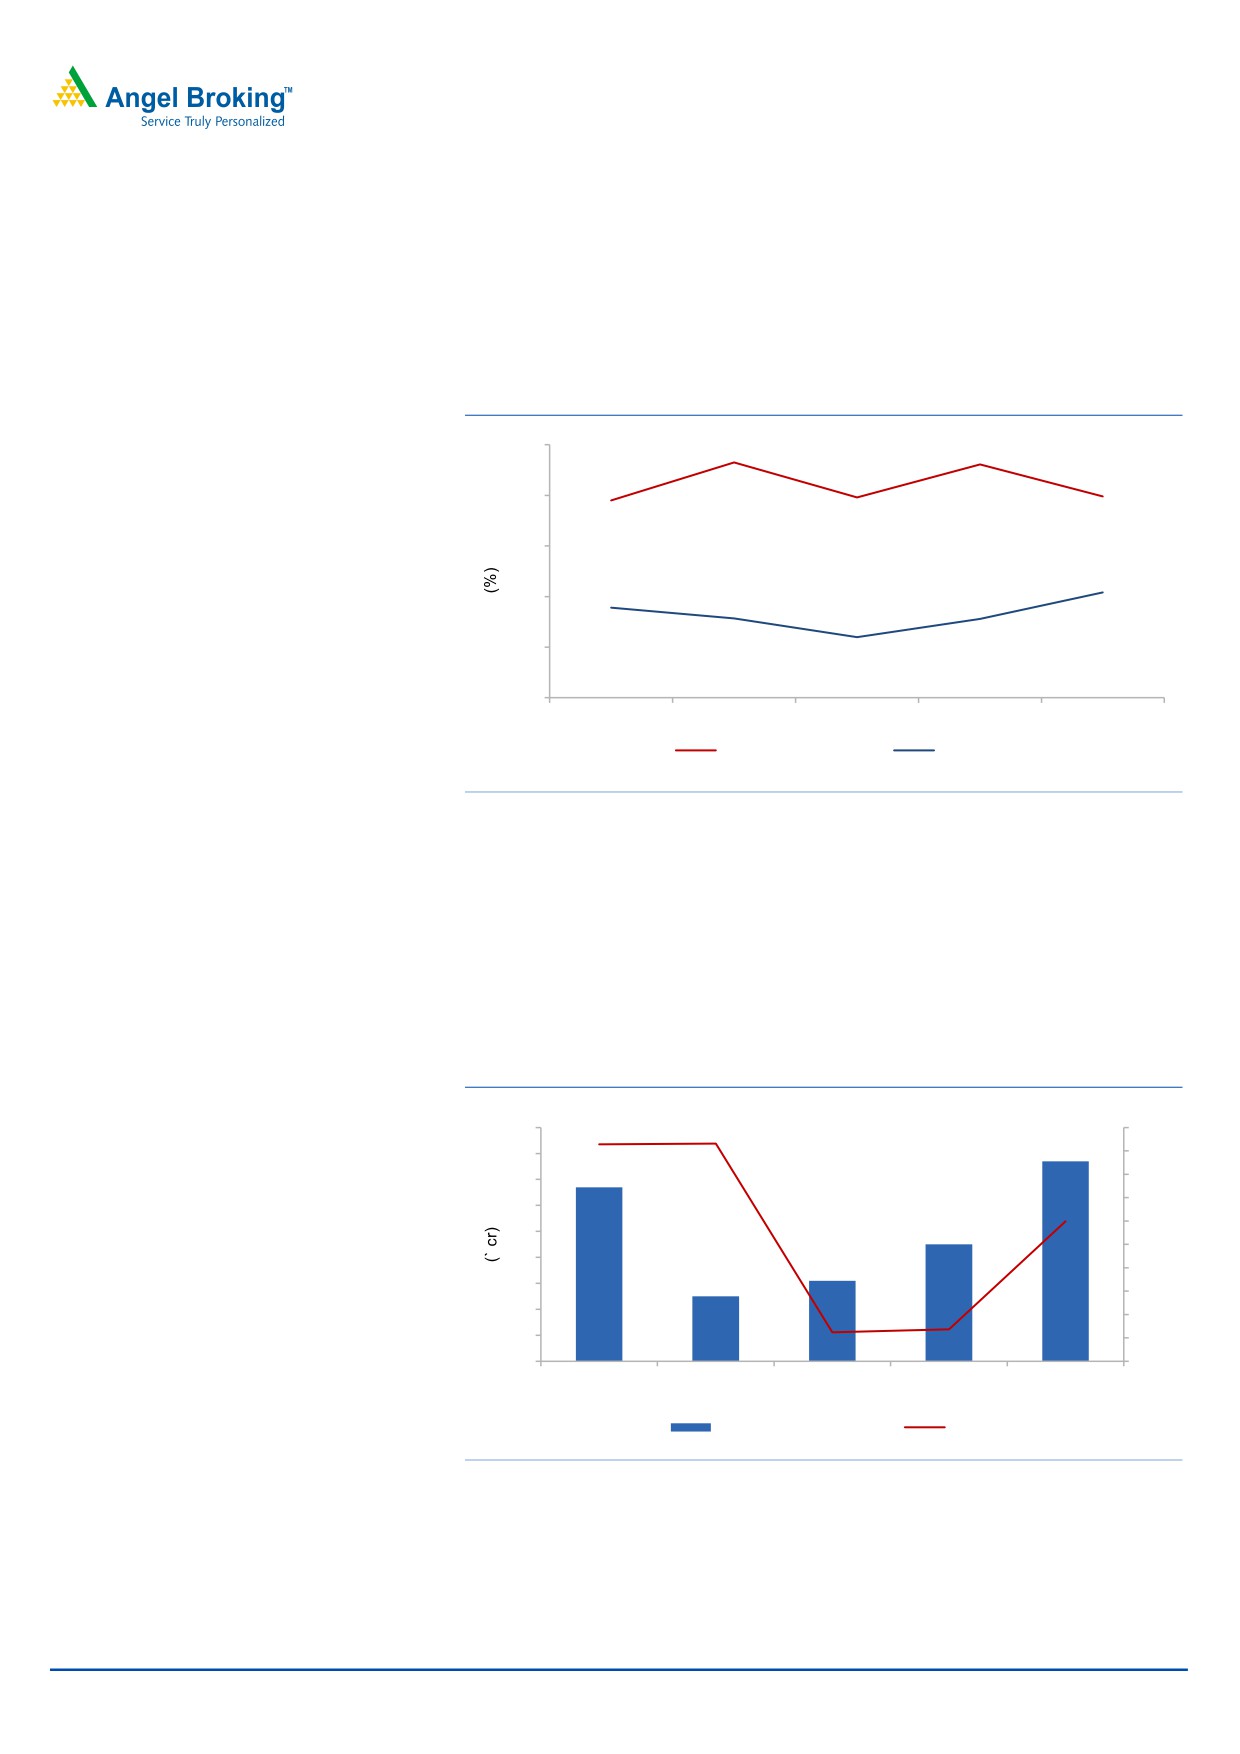
OPM expands
On the operating front, the gross margin came in at 39.8% (v/s. 39.0% in 2QFY2017).
Thus, the OPM came in at 20.8% (v/s. 17.8% in 2QFY2017). The expansion in the
OPM was mainly on back of the other expenses which rose by 1.1% yoy during the
quarter.
Exhibit 3: Margin trend (%)
50.0
46.5
46.1
39.0
39.6
39.8
40.0
30.0
20.0
20.8
17.8
10.0
15.7
15.6
12.0
0.0
2QFY2017
3QFY2017
4QFY2017
1QFY2018
2QFY2018
Gross margin
EBITDA margin
Source: Company, Angel Research
Earnings grow; driven by OPM expansion
The Adj. Net profit grew by 16.1% yoy to `77cr (v/s. `67cr in 2QFY2017). The
Reported Net Profit came in at `77cr v/s. `67cr, yoy growth of 16.1%, mainly driven
by OPM expansion. Other income was `3.4cr in 2QFY2018 (v/s. 3.8cr 2QFY2017).
Exhibit 4: Adjusted PAT trend
90
35
77
80
30
67
70
25
20
60
15
50
45
10
40
31
5
30
25
0
20
(5)
10
(10)
0
(15)
2QFY2017
3QFY2017
4QFY2017
1QFY2018
2QFY2018
Adj PAT
% YoY
Source: Company, Angel Research
November 21, 2017
3
Rallis India | 2QFY2018 Result Update
Investment arguments
Company set to seize rising opportunities in the domestic crop protection
market: India's overall pesticide consumption is one of the lowest in the world and
has a huge potential to grow. We believe Rallis is well placed to seize this
opportunity on the back of its wide distribution network, strong brands, and a
robust new product pipeline. According to industry estimates, the unorganized
market accounts for 50% of the industry. Nonetheless, we believe Rallis is in a
position to wrest market share as well as charge a premium for its products. A lower
base would result in 11.0% CAGR in the domestic business during FY2017-19E.
Exports remain flat: Although a late entrant, the company has been enhancing its
focus in the exports market, which is now turning out to be its main growth driver.
Overall exports formed ~31% of sales in FY2017. In FY2017, the global weakness in
the agrochemical industry had put pressure on Rallis’ exports business, which
resulted in revenue coming in at `450cr. Moreover, going forward, the segment will
continue to post a 15.0% CAGR over FY2017-19E.
Seed business to augment the domestic portfolio: After the acquisition of
Metahelix seeds business in 2010, the seeds business forms a major part of the
domestic business of the company. During FY2017, Rallis’ seeds business (under
Metahelix) reported a decent growth of 15% yoy to `280cr on the back of increased
market share, and despite significant reduction in acreages for some of the key
crops such as millet seeds and corn. The company is also strengthening its cotton
portfolio and will be launching a new product to take on the market leaders in this
crop. The management remains confident of Metahelix achieving 12-14% margin
in a good monsoon year.
Contract manufacturing ramping up slowly: Rallis plans to focus on contract
manufacturing for exports and selectively target top players. To facilitate the same,
the company has set up a plant at Dahej, which in FY2013 was working at full
capacity and contributed significantly to the overall growth of the company. The
company has bagged two CRAMS projects on a pilot basis during the year. The
management expects to convert these pilot projects into full commercial contracts
in FY2017 and contribute to earnings growth from FY2018-2019 onwards.
Outlook and valuation
Over FY2017-19E, we expect the company to post a CAGR of 10.5% and 24.9% in
net sales and profit respectively. At the current level, the stock is trading at a fair
valuation of 20.7x its FY2019E EPS. Hence, we are downgrading our view from
Neutral to Sell.
November 21, 2017
4
Rallis India | 2QFY2018 Result Update
Exhibit 5: Key assumptions
Particulars (%)
FY2018E
FY2019E
Domestic growth
11.0
11.0
Export growth
15.0
15.0
Total revenue growth
11.0
12.1
EBITDA margin
15.0
16.0
Capex (` cr)
70
70
Source: Company, Angel Research
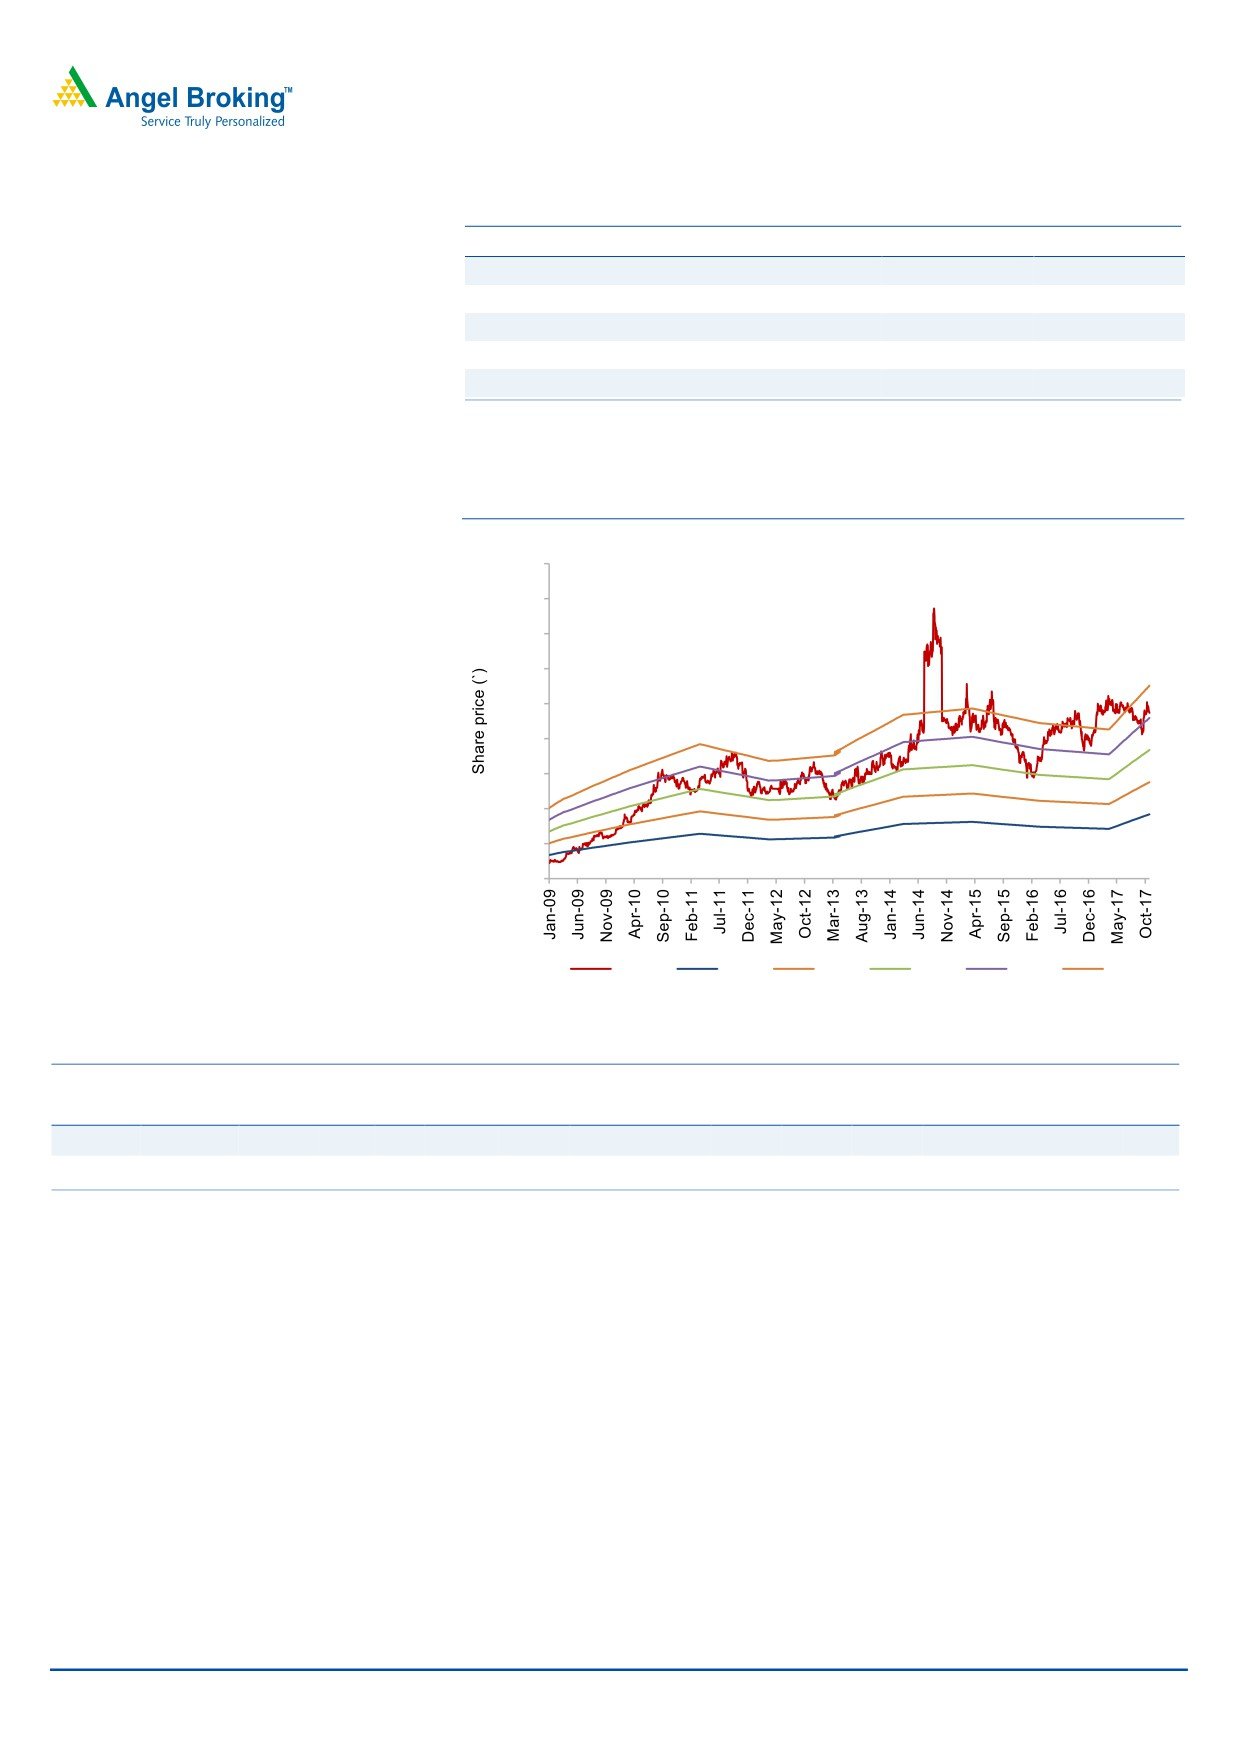
Exhibit 6: P/E Band
450.0
400.0
350.0
300.0
250.0
200.0
150.0
100.0
50.0
0.0
Price
10x
15x
20x
25x
30x
Exhibit 7: Peer valuation
Company Reco
Mcap CMP TP Upside
P/E (x)
EV/Sales (x)
EV/EBITDA (x)
RoE (%)
CAGR (%)
(` cr)
(`)
(`)
(%)
FY18E FY19E FY18E FY19E FY18E FY19E FY18E FY19E Sales PAT
Rallis
Sell
4,501
231
189
(18.3)
25.0
20.8
2.3
2.0
15.1
12.7
15.5
16.9
10.5
24.9
UPL
Accumulate
44,006
754
805
7.0
20.7
16.9
2.5
2.1
13.7
11.4
22.8
23.4
15.0
12.2
Source: Company, Angel Research, Bloomberg
Company background
Rallis is one of the oldest and second largest pesticide agrichemical companies in
the country with a market share of around 13% and belongs to the Tata Group. The
company also has a credible presence in the international market. Contribution
from the domestic business stands at ~70%, while exports account for the balance.
November 21, 2017
5
Rallis India | 2QFY2018 Result Update
Profit & loss (Consolidated)
Y/E March (` cr)
FY2014
FY2015
FY2016
FY2017
FY2018E FY2019E
Gross sales
1,840
1,922
1,730
1,783
1,957
2,193
Less: Excise duty
114
121
119
105
130
144
Net Sales
1,726
1,801
1,612
1,678
1,828
2,049
Other operating income
21
21
26
9
9
9
Total operating income
1,747
1,822
1,637
1,687
1,837
2,058
% chg
19.8
4.3
(10.1)
3.0
8.9
12.1
Total Expenditure
1,485
1,545
1,398
1,415
1,554
1,722
Net Raw Materials
1,008
995
839
950
1,023
1,127.11
Other Mfg costs
344
343
406
319
347
389
Personnel
111
129
132
146
159
179
Other
23
23
21
23
24
27
EBITDA
240
256
214
263
274
327
% chg
20.8
6.5
(16.5)
23.2
3.9
19.7
(% of Net Sales)
13.9
14.2
13.3
15.7
15.0
16.0
Depreciation & Amort.
41
50
45
47
53
58
EBIT
221
228
195
225
230
279
% chg
18.9
3.1
(14.3)
15.2
2.4
21.3
(% of Net Sales)
12.8
12.6
12.1
13.4
12.6
13.6
Interest & other Charges
13
10
14
7
4
6
Other Income
6
4
4
4
4
4
(% of PBT)
3
2
2
2
2
2
Share in profit of Asso.
Recurring PBT
214
222
186
222
230
277
% chg
26.3
3.4
(16.2)
19.3
4.0
20.3
Extraordinary Exp./(Inc.)
-
-
-
158
-
-
PBT (reported)
214
222
186
63
230
277
Tax
62
62
39
83
51
61
(% of PBT)
28.8
27.9
21.0
131.2
22.0
22.0
Minority Interest
0.8
2.6
3.7
3.7
3.7
3.7
PAT (reported)
152
157
143
(20)
180
216
ADJ. PAT
152
157
143
139
180
216
% chg
32.9
3.5
(9.0)
(3.0)
29.6
20.3
(% of Net Sales)
8.8
8.7
8.9
8.3
9.8
10.6
Basic EPS (`)
7.8
8.1
7.4
7.1
9.2
11.1
Fully Diluted EPS (`)
7.8
8.1
7.4
7.1
9.2
11.1
% chg
32.9
3.5
(9.0)
(3.0)
29.6
20.3
November 21, 2017
6
Rallis India | 2QFY2018 Result Update
Balance sheet (Consolidated)
Y/E March (` cr)
FY2014
FY2015
FY2016
FY2017
FY2018E FY2019E
SOURCES OF FUNDS
Equity Share Capital
19
19
19
19
19
19
Preference Capital
-
-
-
-
-
-
Reserves & Surplus
699
795
880
1,092
1,194
1,332
Shareholders Funds
718
815
899
1,111
1,213
1,352
Minority Interest
10
10
4
0
0
0
Total Loans
75
111
75
37
37
80
Other Long Term Liabilities
4
4
4
-
-
-
Long Term provisions
15
19
18
23
23
23
Deferred Tax Liability
32
36
39
26
26
26
Total Liabilities
853
993
1,038
1,198
1,300
1,482
APPLICATION OF FUNDS
Gross Block
651
687
764
717
787
857
Less: Acc. Depreciation
233
282
327
374
427
484
Net Block
418
405
437
343
360
372
Capital Work-in-Progress
21
21
21
21
21
21
Goodwill
186
196
259
237
237
237
Investments
25
24
28
239
239
239
Long Term Loans and Adv.
98
110
110
137
137
137
Current Assets
549
680
650
728
748
1,028
Cash
9
7
8
10
28
26
Loans & Advances
40
28
35
324
65
269
Other
500
645
607
394
654
733
Current liabilities
445
443
467
507
442
553
Net Current Assets
104
237
183
221
306
475
Mis. Exp. not written off
-
-
-
-
-
-
Total Assets
853
993
1,038
1,198
1,300
1,482
November 21, 2017
7
Rallis India | 2QFY2018 Result Update
Cash flow statement (Consolidated)
Y/E March (` cr)
FY2014
FY2015
FY2016
FY2017
FY2018E FY2019E
Profit before tax
214
222
186
63
230
277
Depreciation
41
50
45
47
53
58
(Inc)/Dec in Working Capital
(7)
(147)
55
(63)
(66)
(171)
Direct taxes paid
(62)
(62)
(39)
(83)
(51)
(61)
Cash Flow from Operations
186
63
246
(35)
166
102
(Inc.)/ Dec. in Fixed Assets
(56)
(36)
(76)
47
(70)
(70)
(Inc.)/ Dec. in Investments
(5)
1
(4)
(211)
-
-
Inc./ (Dec.) in loans and adv.
Cash Flow from Investing
(61)
(35)
(80)
(164)
(70)
(70)
Issue of Equity
-
-
-
-
-
-
Inc./(Dec.) in loans
(73)
40
(36)
(33)
-
43
Dividend Paid (Incl. Tax)
(55)
(68)
(68)
(78)
(78)
(78)
Others
(14)
(1)
-
-
(0)
0
Cash Flow from Financing
(142)
(29)
(165)
202
(78)
(34)
Inc./(Dec.) in Cash
(17)
(2)
1
2
18
(2)
Opening Cash balances
26
9
7
8
10
28
Closing Cash balances
9
7
8
10
28
26
November 21, 2017
8
Rallis India | 2QFY2018 Result Update
Key ratios
Y/E March
FY2014
FY2015
FY2016
FY2017
FY2018E FY2019E
Valuation Ratio (x)
P/E (on FDEPS)
29.5
28.4
31.3
32.3
24.9
20.7
P/CEPS
23.2
21.6
23.8
162.1
19.2
16.3
P/BV
6.2
5.5
5.0
4.0
3.7
3.3
Dividend yield (%)
0.9
0.9
1.3
1.7
2.2
2.6
EV/Sales
2.6
2.5
2.7
2.5
2.3
2.0
EV/EBITDA
18.4
17.4
20.7
15.7
15.1
12.7
EV / Total Assets
5.2
4.5
4.3
3.5
3.2
2.8
Per Share Data (`)
EPS (Basic)
7.8
8.1
7.4
7.1
9.2
11.1
EPS (fully diluted)
7.8
8.1
7.4
7.1
9.2
11.1
Cash EPS
9.9
10.6
9.6
1.4
11.9
14.1
DPS
2.0
2.0
3.0
4.0
5.0
6.0
Book Value
36.9
41.9
46.2
57.1
62.4
69.5
Dupont Analysis
EBIT margin
12.8
12.6
12.1
13.4
12.6
13.6
Tax retention ratio
71.2
72.1
79.0
(31.2)
78.0
78.0
Asset turnover (x)
2.1
2.0
1.6
1.5
1.5
1.5
ROIC (Post-tax)
19.0
18.0
15.4
(6.3)
14.4
15.7
Cost of Debt (Post Tax)
8.7
7.9
11.6
(4.1)
7.8
7.8
Leverage (x)
0.2
0.2
0.2
0.1
0.0
0.0
Operating ROE
20.6
19.6
16.1
(6.5)
14.6
16.0
Returns (%)
ROCE (Pre-tax)
26.4
24.7
19.2
20.1
18.4
20.1
Angel ROIC (Pre-tax)
35.9
32.4
25.7
26.7
23.7
25.2
ROE
22.7
20.5
16.7
13.8
15.5
16.9
Turnover ratios (x)
Asset Turnover (Gross Block)
2.8
2.7
2.3
2.3
2.4
2.5
Inventory / Sales (days)
62
74
89
89
88
94
Receivables (days)
35
37
44
45
44
47
Payables (days)
98
105
119
126
111
105
WC cycle (ex-cash) (days)
20
33
46
42
49
65
Solvency ratios (x)
Net debt to equity
0.1
0.2
0.1
0.0
0.0
0.1
Net debt to EBITDA
0.3
0.5
0.4
0.2
0.1
0.2
Interest Coverage (EBIT / Int.)
17.5
22.5
14.4
30.8
62.3
47.7
November 21, 2017
9
Rallis India | 2QFY2018 Result Update
Research Team Tel: 022 - 39357800
DISCLAIMER
Angel Broking Private Limited (hereinafter referred to as “Angel”) is a registered Member of National Stock Exchange of India Limited,
Bombay Stock Exchange Limited and Metropolitan Stock Exchange Limited. It is also registered as a Depository Participant with CDSL
and Portfolio Manager with SEBI. It also has registration with AMFI as a Mutual Fund Distributor. Angel Broking Private Limited is a
registered entity with SEBI for Research Analyst in terms of SEBI (Research Analyst) Regulations, 2014 vide registration number
INH000000164. Angel or its associates has not been debarred/ suspended by SEBI or any other regulatory authority for accessing
/dealing in securities Market. Angel or its associates/analyst has not received any compensation / managed or co-managed public
offering of securities of the company covered by Analyst during the past twelve months.
This document is solely for the personal information of the recipient, and must not be singularly used as the basis of any investment
decision. Nothing in this document should be construed as investment or financial advice. Each recipient of this document should make
such investigations as they deem necessary to arrive at an independent evaluation of an investment in the securities of the companies
referred to in this document (including the merits and risks involved), and should consult their own advisors to determine the merits
and risks of such an investment.
Reports based on technical and derivative analysis center on studying charts of a stock's price movement, outstanding positions and
trading volume, as opposed to focusing on a company's fundamentals and, as such, may not match with a report on a company's
fundamentals. Investors are advised to refer the Fundamental and Technical Research Reports available on our website to evaluate the
contrary view, if any.
The information in this document has been printed on the basis of publicly available information, internal data and other reliable
sources believed to be true, but we do not represent that it is accurate or complete and it should not be relied on as such, as this
document is for general guidance only. Angel Broking Pvt. Limited or any of its affiliates/ group companies shall not be in any way
responsible for any loss or damage that may arise to any person from any inadvertent error in the information contained in this report.
Angel Broking Pvt. Limited has not independently verified all the information contained within this document. Accordingly, we cannot
testify, nor make any representation or warranty, express or implied, to the accuracy, contents or data contained within this document.
While Angel Broking Pvt. Limited endeavors to update on a reasonable basis the information discussed in this material, there may be
regulatory, compliance, or other reasons that prevent us from doing so.
This document is being supplied to you solely for your information, and its contents, information or data may not be reproduced,
redistributed or passed on, directly or indirectly.
Neither Angel Broking Pvt. Limited, nor its directors, employees or affiliates shall be liable for any loss or damage that may arise from
or in connection with the use of this information.
Disclosure of Interest Statement
Rallis India
1. Financial interest of research analyst or Angel or his Associate or his relative
No
2. Ownership of 1% or more of the stock by research analyst or Angel or associates or relatives
No
3. Served as an officer, director or employee of the company covered under Research
No
4. Broking relationship with company covered under Research
No
Ratings (Based on expected returns
Buy (> 15%)
Accumulate (5% to 15%)
Neutral (-5 to 5%)
over 12 months investment period):
Reduce (-5% to -15%)
Sell (< -15)