1QFY2018 Result Update | Pharmaceutical
August 3, 2017
Dr. Reddy’s Laboratories
NEUTRAL
CMP
`2,723
Performance Highlights
Target Price
-
Y/E March (` cr)
1QFY2018
4QFY2017
% chg (qoq)
1QFY2017
% chg (yoy)
Investment Period
12 months
Net sales
3,316
3,554
(6.7)
3,235
2.5
Gross profit
1,990
2,111
(5.7)
2,086
(4.6)
Stock Info
Operating profit
306
555
(44.9)
377
(19.0)
Sector
Pharmaceutical
Adj. net profit
59
312
(81.1)
126
(53.2)
Market Cap (` cr)
40,241
Source: Company, Angel Research
Net Debt (` cr)
2,839
Dr Reddy’s Labs posted poor results for 1QFY2018, which were much lower than
Beta
0.4
expectations. The sales came in at `3,316cr (`3,636cr expected) v/s. `3,235cr, a yoy
52 Week High / Low
3,395/2,371
growth of 2.5%. Global Generics at `2,745.5cr, posted a yoy growth of 3.0%, while PSAI at
Avg. Daily Volume
33,208
`465.1cr, registered a yoy de-growth of 1.0%. On operating front, the EBDITA came in at
Face Value (`)
5
9.2% (16.1% expected) v/s. 11.7% in 1QFY2017. R&D expenses were at 15.3% of sales in
BSE Sensex
32,575
1QFY2018 v/s. 14.8% of sales in 1QFY2017. Consequently, the PAT came in at `59cr
Nifty
10,115
(`321cr expected) v/s. `126cr in 1QFY2017, a yoy de-growth of 53.2%. We maintain our
Reuters Code
REDY.BO
neutral.
Bloomberg Code
DRRD@IN
A subdued quarter: The sales came in at `3,316cr (`3,636cr expected) v/s. `3,235cr, a
yoy growth of 2.5%. Global Generics at `2,745.5cr, posted a yoy growth of 3.0%, while
Shareholding Pattern (%)
PSAI at `465.1cr, registered a yoy de-growth of 1.0%. The Global Generics, which forms
Promoters
26.8
83% of overall sales, saw dip in its key growth market USA (`1,494.6cr), which posted a
MF / Banks / Indian Fls
14.9
dip of 4.0% yoy, while Indian sales at `468.7cr posted a dip of 10.0%. The USA market
FII / NRIs / OCBs
49.0
continued to reel under the pricing pressures, while Indian sales were under the pressure on
Indian Public / Others
9.4
the back of GST. On operating front, the EBDITA came in at 9.2% (16.1% expected) v/s.
11.7% in 1QFY2017. R&D expenses were at 15.3% of sales in 1QFY2018 v/s. 14.8% of
sales in 1QFY2017. Consequently, the PAT came in at `59cr (`321cr expected) v/s. `126cr
Abs. (%)
3m 1yr
3yr
in 1QFY2017, a yoy de-growth of 53.2%.
Sensex
8.9
16.3
27.8
Outlook & Valuation: We expect net sales to grow at a CAGR of 13.0% to `17,973cr
Dr Reddy
(11.6)
(18.4)
(12.0)
and adjusted EPS to post a CAGR of 23.6% to end the period at `111 in FY2019E. We
recommend a Neutral.
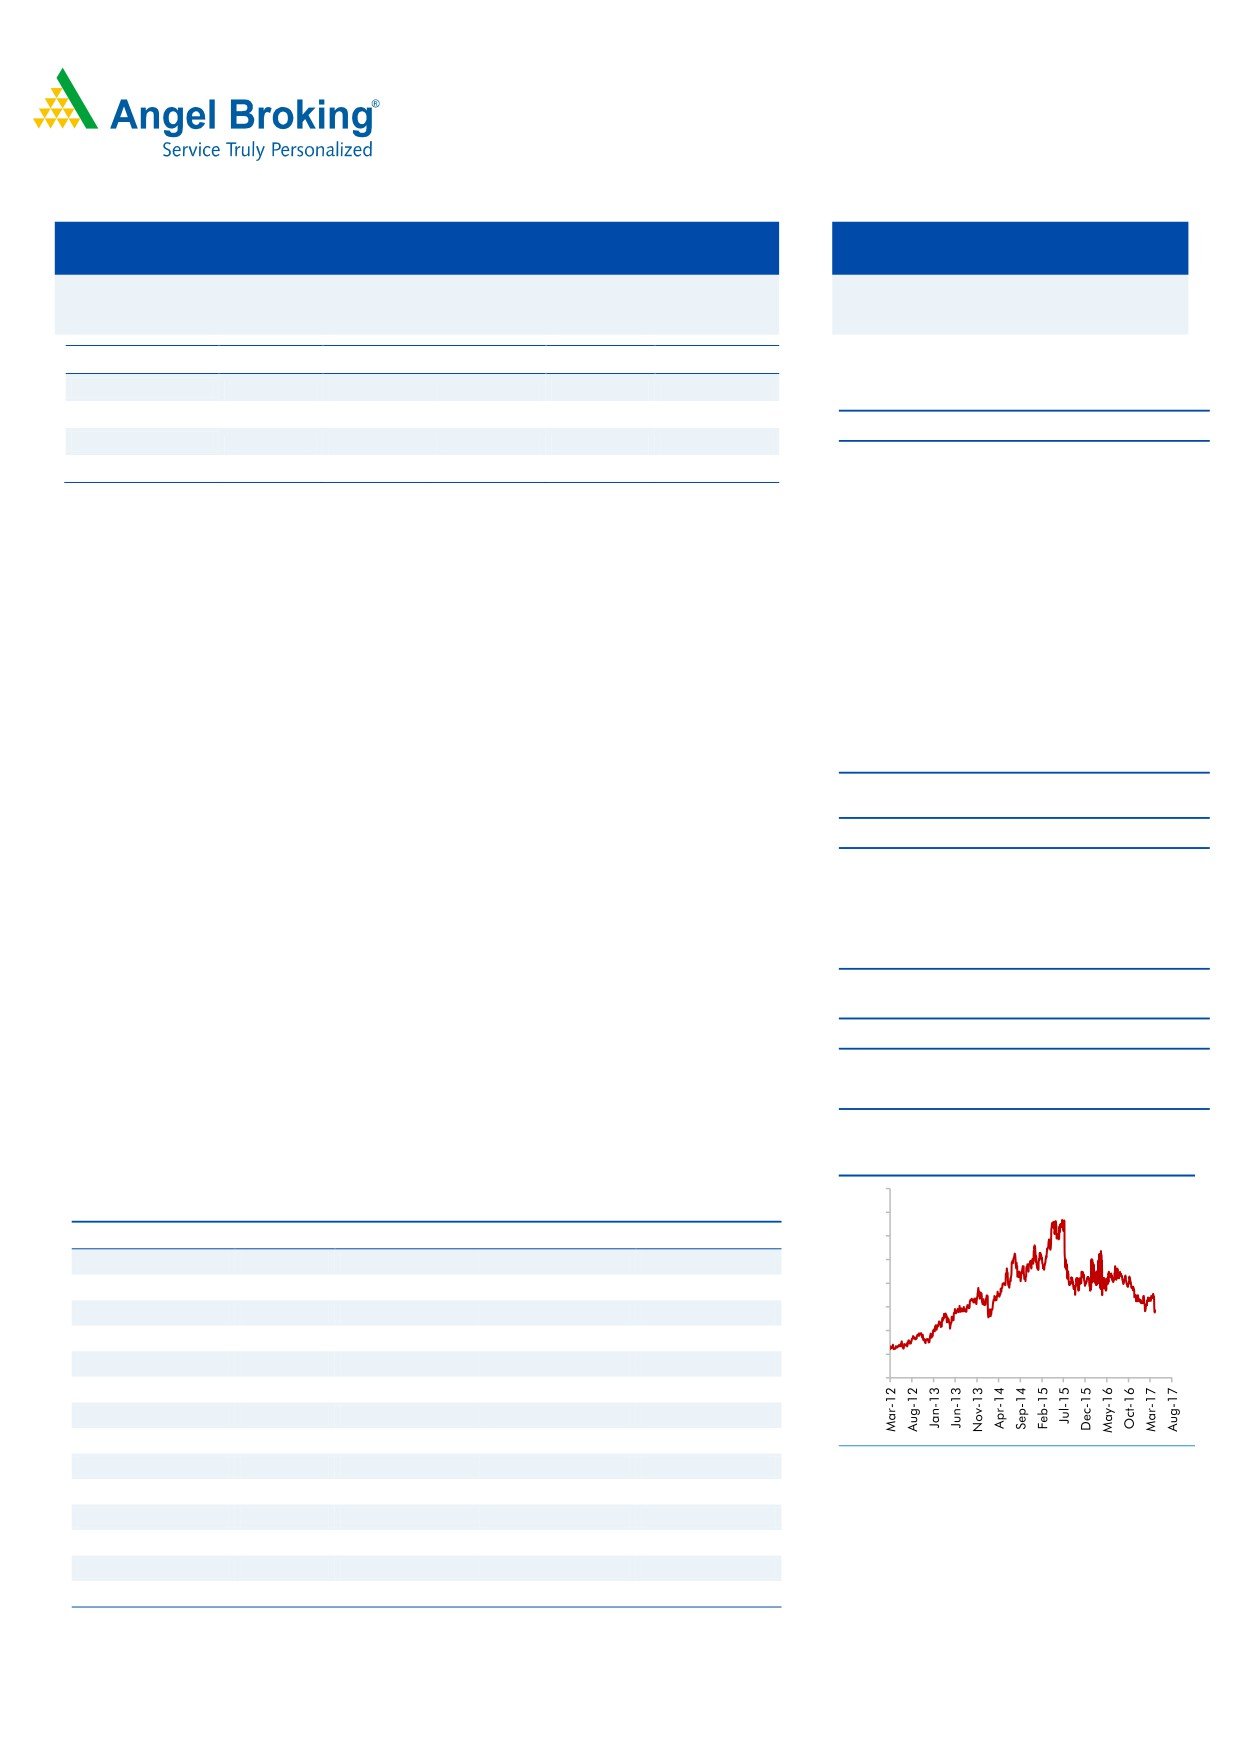
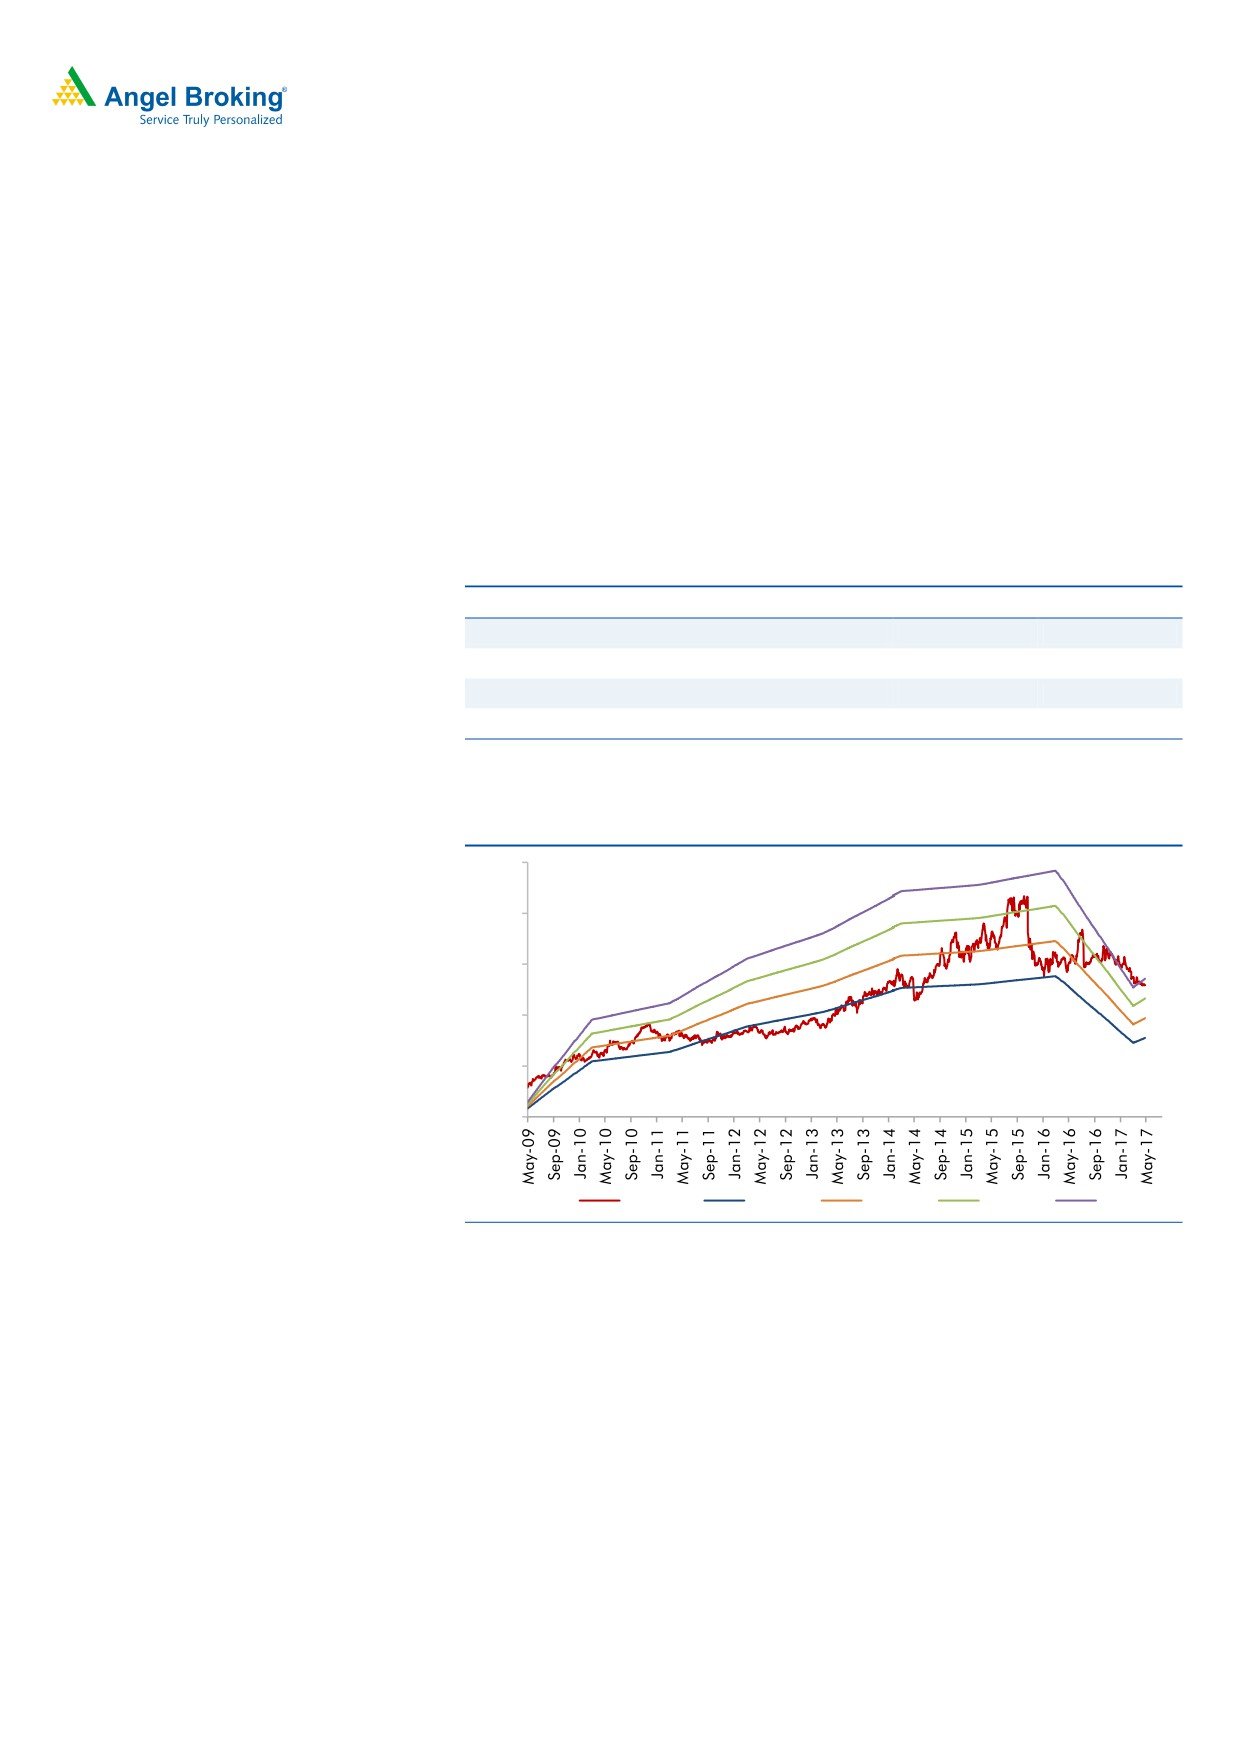
3-year Daily Price Chart
5,000
Key financials (IFRS Consolidated)
4,500
Y/E March (` cr)
FY2016
FY2017
FY2018E
FY2019E
4,000
Net sales
15,471
14,081
15,844
17,973
3,500
% chg
4.4
-9.0
12.5
13.4
3,000
2,500
Net profit
2,001
1,204
1,521
1,840
2,000
% chg
(9.8)
(39.8)
26.3
21.0
1,500
Adj net profit
2,357
1,204
1,521
1,840
1,000
% chg
6.3
(48.9)
26.3
21.0
Adj. EPS (`)
138.2
72.6
91.7
111.0
EBITDA margin (%)
24.6
16.1
17.6
18.2
Source: Company, Angel Research
P/E (x)
17.6
33.4
26.5
21.9
RoE (%)
19.7
9.6
11.9
13.0
RoCE (%)
18.7
7.5
9.8
11.2
P/BV (x)
3.2
3.3
3.0
2.7
EV/Sales (x)
2.6
3.1
2.7
2.4
Sarabjit Kour Nangra
EV/EBITDA (x)
10.7
19.0
15.6
13.4
+91 2 39357600 Ext: 6806
Source: Company, Angel Research; Note: CMP as of August 1, 2017
Please refer to important disclosures at the end of this report
1
Dr. Reddy’s Laboratories | 1QFY2018 Result Update
Exhibit 1: 1QFY2018 performance (IFRS, consolidated)
Y/E March (` cr)
1QFY2018
4QFY2017
% chg (qoq) 1QFY2017
% chg (yoy)
FY2017
FY2016
% chg
Net sales
3,316
3,554
(6.7)
3,235
2.5
14,081
15,471
(9.0)
Other income/(loss)
42
56
(25.8)
61
222
(161)
-
Total income
3,357
3,610
(7.0)
3,296
1.9
14,303
15,310
(6.6)
Gross profit
1,990
2,111
(5.7)
2,086
(4.6)
8,621
9,970
(13.5)
Gross margin (%)
60.0
59.4
64.5
61.2
64.4
SG&A expenses
1,176
1,097
7.2
1,228
(4.2)
4,637
4,570
1.5
R&D expenses
508
458
10.8
480
5.7
1,955
1,783
9.6
EBDITA
306
555
(44.9)
377
(19.0)
2,029
3,617
(43.9)
EBDITA (%)
9.2
15.6
-
11.7
14.4
23.4
-
Depreciation
280
292
(4.3)
268.2
4.4
785.7
742.0
5.9
Interest
-
-
-
-
-
PBT
67
319
(78.9)
170
(60.5)
1,465
2,714
(46.0)
Tax
18
6
200.0
44
261
713
(63.3)
Net Profit
49
313
(84.2)
126
(60.8)
1,204
2,001
(39.9)
Share of profit/ (loss) in associates
10
-
-
-
-
Reported net profit before exceptional
59
312
(81.1)
126
(53.2)
1,204
2,001
(39.9)
Exceptional items (loss) /profit
-
-
-
-
-
Reported PAT
59
312
(81.1)
126
(53.2)
1,204
2,001
(39.8)
Adj. Net Profit
59
312
(81.1)
126
(53.2)
1,204
2,357
(48.9)
EPS (`)
3.6
18.8
7.6
72.6
138.2
Source: Company, Angel Research
Exhibit 2: Actual Vs Estimates
(` cr)
Actual
Estimates
Variation (%)
Net sales
3,316
3,636
(8.8)
Other income
42
56
(25.9)
Operating profit
306
596
(48.7)
Tax
18
186
(90.3)
Adj. Net profit
59
321
(81.6)
Source: Company, Angel Research
Revenue lower than expectations: The sales came in at `3,316cr (`3,636cr expected)
in 1QFY2018 v/s. `3,235cr, a yoy growth of 2.5%. Global Generics at `2,745.5cr,
posted a yoy growth of 3.0%, while PSAI at `465.1cr, registered a yoy de-growth of
1.0%. The Global Generics, which constitutes 83% of overall sales, saw dip in its key
growth market USA (`1,494.6cr), which posted a dip of 4.0% yoy, while India (
`468.7cr), posted a dip of 10.0%. The USA market continued to reel under the pricing
pressures, while Indian sales were under the pressure on the back of GST.
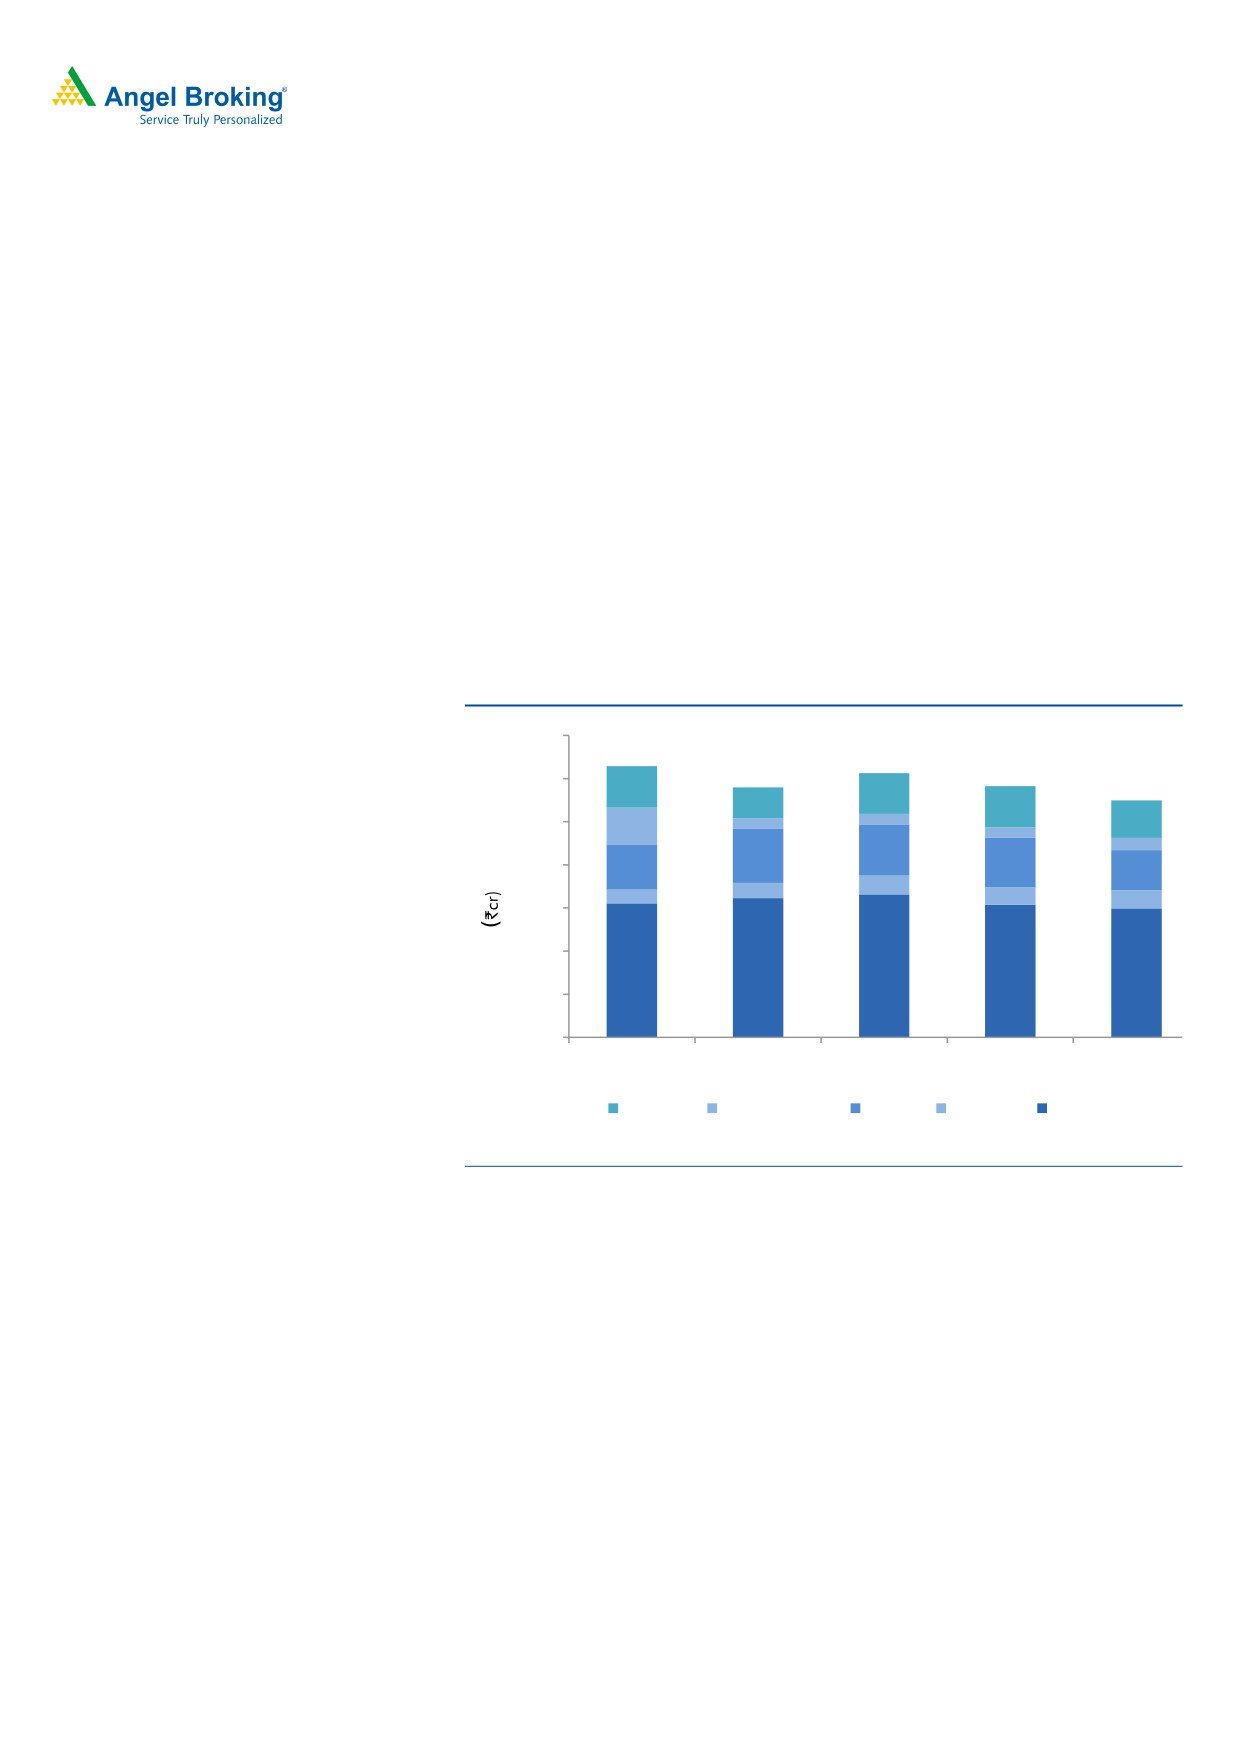
The global generic market with sales at`2,746cr (up 3.0% yoy), was mainly lead by the
Europe performance, which posted a yoy growth of 28.0% to end the period at
`207.5cr. On constant currency basis, the growth in the region was 37.0% yoy. Growth
in the region was driven primarily on account of new launches and improvement in
base business.
Apart from this the Emerging markets (`575cr, up 34% yoy) posted robust growth on
the back of Russia (~`350cr) posted a growth of 48% in the reported currency, while
on constant currency terms the region posted a yoy growth of 31%. Its key growth
market USA (`1,494.6cr), posted a dip of 4.0% yoy, while India (`468.7cr), posted a
dip of 10.0%.
August 3, 2017
2
Dr. Reddy’s Laboratories | 1QFY2018 Result Update
US posted a dip, primarily on account of higher price erosion, increased competition in
the key products namely Valganciclovir, Decitabine, Azacitidine, etc., and
discontinuation of the McNeil business. This was partially offset by contribution from
new launches. During the quarter the company launched
4 new products
-
Ezetimibe+Simvastatin, Liposomal Doxorubicin, Progesterone, and Bivalirudin injection.
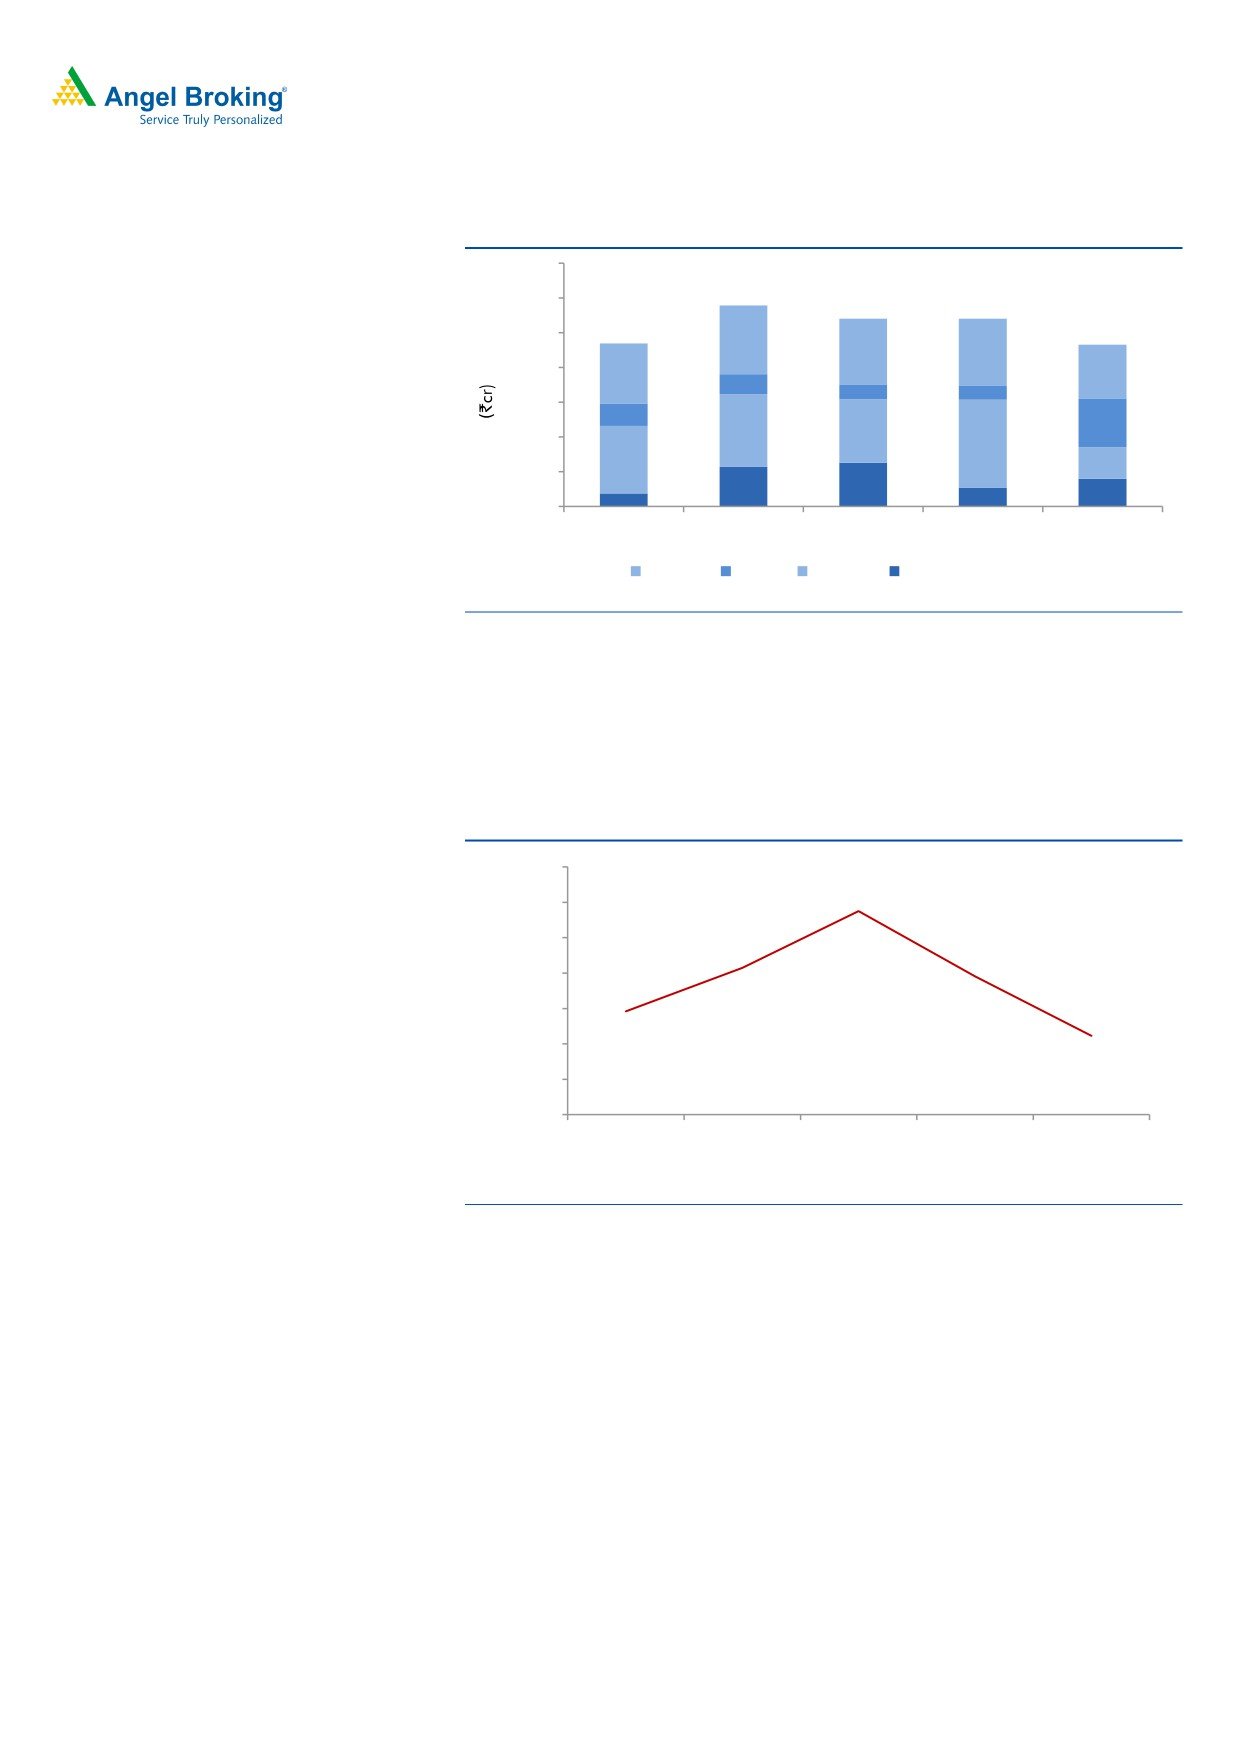
The PSAI segment posted sales of `465cr, down 1.0% yoy. The de-growth came in on
the back of Europe (`91.1cr, a yoy de-growth of 53%) and ROW (`156cr, a yoy dip of
10.0%). However, growth was registered in the sales of India (`139cr, a yoy growth of
273%) and USA (`80cr, a yoy growth of 24%).
As of June 30, 2017, cumulatively 99 generic filings are pending for approvals with the
USFDA (97 ANDAs and 2 NDAs under 505(b)(2) route). Of these 97 ANDAs, 59 are
Para IVs, out of which we believe 26 have ‘First to File’ status.
Exhibit 3: Trend in Global generics
3500
3000
2500
123
428
123
123
140
625
595
2000
571
522
469
215
177
162
207
208
1500
1000
1,613
1,659
1,552
1,535
1,496
500
0
1QFY2017
2QFY2017
3QFY2017
4QFY2017
1QFY2018
Others
Russia & CIS
India
Europe
North America
Source: Company, Angel Research
In the PSAI segment (14% of sales), the US grew by 24% yoy, while, ROW, Europe and
India grew by (10)%, (53)% & 273% yoy respectively during the quarter. Proprietary
Products & Others at `105.3cr posted a yoy growth of 4.0%.
August 3, 2017
3
Dr. Reddy’s Laboratories | 1QFY2018 Result Update
Exhibit 4: PSAI trend
700
600
500
198
190
194
400
173
156
58
41
40
300
64
139
210
183
200
254
195
91
100
114
126
53
80
0
37
1QFY2017 2QFY2017 3QFY2017 4QFY2017 1QFY2018
Others
India
Europe
North America
Source: Company, Angel Research
EBITDA margin dips yoy: On operating front, the EBDITA came in at 9.2% (16.1%
expected) in 1QFY2018 v/s. 11.7% in 1QFY2017. R&D expenses were at 15.3% of
sales in 1QFY2018 v/s. 14.8% of sales in 1QFY2017. Gross margins during the
quarter were at 60.0% v/s. 64.5% in 1QFY2017.
Exhibit 5: EBITDA margin trend (%)
28.0
23.0
24.0
20.0
16.6
15.6
16.0
11.7
12.0
9.2
8.0
4.0
0.0
1QFY2017 2QFY2017 3QFY2017 4QFY2017 1QFY2018
Source: Company, Angel Research
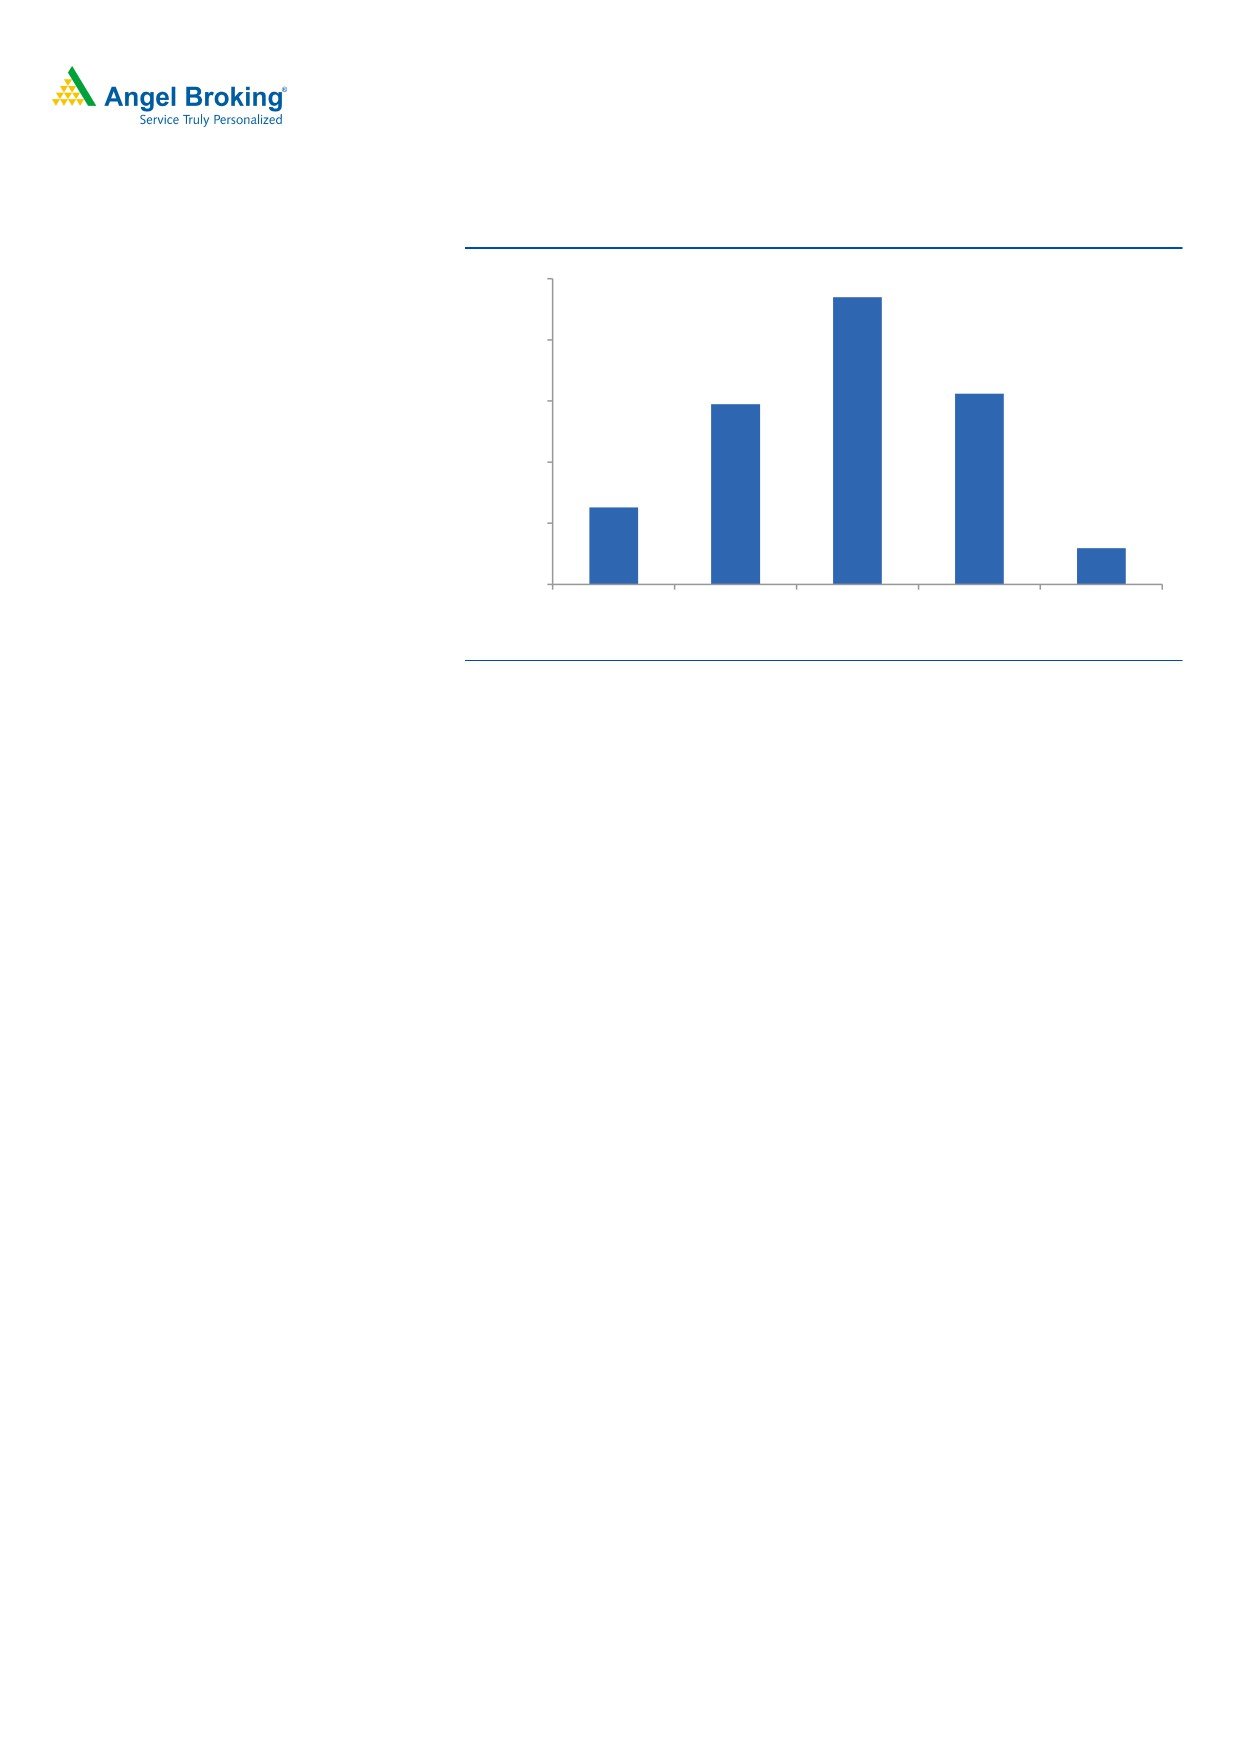
Net profit lower than expected: Consequently, the PAT came in at `59.1cr (`321cr
expected) in 1QFY2018 v/s. `126cr in 1QFY2017, a yoy de-growth of 53.2%.
August 3, 2017
4
Dr. Reddy’s Laboratories | 1QFY2018 Result Update
Exhibit 6: Adjusted net profit trend
470
500
400
312
295
300
200
126
59
100
0
1QFY2017
2QFY2017
3QFY2017
4QFY2017
1QFY2018
Source: Company, Angel Research
Concall takeaways
Duvvada will require re-inspection (expected by Dec’2017 end).
DRL expects 15 ANDA launches in FY2018 (including
4-5 meaningful
launches.
Tax rate in FY2018 to stay at ~23-25% of PBT.
R&D expense is expected to remain at higher levels due to strong product
pipeline of complex generics, Biosimilars and differentiated products. R&D
expenses during the quarter are expected to be ~`2000cr in FY2018.
Investment arguments
Robust pipeline for US going ahead: After attaining a critical mass (US$981mn in
FY2017), DRL aims to scale up its business to the next orbit in the US market on
the back of a strong product pipeline (99 ANDAs are pending approval, of which,
62 are Para IVs and 21 are FTFs). The Management has guided for a robust
growth in the US over the medium term, driven by introduction of new products,
some of which are also Para IV opportunities. Owing to the import alert on the
three facilities of the company, in a worst case scenario, we expect the ex-
exclusivity US sales to post a 14.3% growth over FY2017-19E.
Domestic to be back in focus: DRL reported a 9.0% yoy growth in FY2017. The
management expects the company’s performance to rebound and targets to
achieve an above industry growth rate going ahead, driven by - (a) field force
expansion and improvement in productivity; (b) new product launches (including
biosimilars); and (c) focus on brand building. In 4QFY2015, DRL had acquired
UCB’s India portfolio and had completed the integration process of these brands
in 1QFY2016. UCB’s India business had registered ~`150cr sales in CY2014 and
has a branded portfolio of
21 products focusing on Allergy, Respiratory,
Dermatology and Pediatric space. The acquisition had been successfully integrated
August 3, 2017
5
Dr. Reddy’s Laboratories | 1QFY2018 Result Update
by 2QFY2016. Also, in FY2017, the domestic formulation business posted a lower
growth, on account of NPPA pricing notifications and demonetization. In FY2018,
the Indian domestic sales have taken a hit on back of the GST implementation,
and hence, the year is expected to end with domestic formulation business growing
at single digit or low double digit growth. Thus, we expect sales in India to post a
CAGR of ~12.0% over FY2017-19E.
Outlook & Valuation: We expect net sales to grow at a CAGR of 13.0% to
`17,973cr and adjusted EPS to post a CAGR of 23.6% over FY2017-19E to end
FY2019 at `111.0. The stock has been severely beaten down post the import alert
from the USFDA. However, considering the valuations, we recommend a Neutral
rating on the stock.
Exhibit 7: Key assumptions
FY2018E
FY2019E
PSAI segment growth (%)
3.5
3.8
Generics segment growth (%)
14.0
14.8
Operating margin (%)
17.6
18.2
Capex (` cr)
1200
1200
Source: Company, Angel Research
Exhibit 8: PE chart
5,000
4,000
3,000
2,000
1,000
0
Price
20x
25x
30x
35x
Source: Company, Angel Research
August 3, 2017
6
Dr. Reddy’s Laboratories | 1QFY2018 Result Update
Exhibit 9: Recommendation summary
Company
Reco.
CMP
Tgt Price
Upside
FY2019E
FY17-19E
FY2019E
(`)
(`)
(%)
PE
EV/Sales
EV/EBITDA
CAGR in EPS
RoCE
RoE
(x)
(x)
(x)
(%)
(%)
(%)
Alembic Pharma
Accumulate
525
600
14.4
19.3
2.2
11.3
12.8
24.3
20.6
Aurobindo Pharma
Accumulate
735
877
12.0
14.3
2.2
10.0
14.2
25.3
22.7
Cadila Healthcare
Sell
542
450
(16.9)
25.5
4.1
20.2
21.0
17.3
22.9
Cipla
Sell
562
465
(18.0)
23.2
2.4
15.0
39.2
11.0
13.2
Dr Reddy's
Neutral
2,427
-
-
21.9
2.4
13.4
23.6
11.2
13.0
Dishman Pharma
Under Review
301
-
-
18.9
1.3
10.1
(6.8)
2.9
2.5
GSK Pharma
Neutral
2,377
-
-
40.6
5.5
30.4
30.6
28.9
26.5
Indoco Remedies
Sell
200
153
(23.5)
15.7
1.5
10.3
23.0
11.2
15.0
Ipca labs
Buy
483
613
28.5
7.9
0.6
4.1
27.9
12.8
11.2
Lupin
Buy
1,018
1,526
49.9
14.7
2.0
8.5
10.4
20.6
17.8
Sanofi India*
Neutral
4,286
-
-
27.9
2.9
17.2
9.2
23.9
25.8
Sun Pharma
Buy
535
712
33.2
16.5
3.1
12.2
1.2
15.1
18.8
Source: Company, Angel Research; Note: *December year ending
Company Background
Established in
1984, Dr. Reddy's Laboratories is an integrated global
pharmaceutical company, through its three businesses - Pharmaceutical Services &
Active Ingredients, Global Generics and Proprietary Products. The company’s key
therapeutic focus is on gastro-intestinal, cardiovascular, diabetology, oncology,
pain management, anti-infective and paediatrics. The company’s key markets
include India, USA, Russia & CIS and Germany.
August 3, 2017
7
Dr. Reddy’s Laboratories | 1QFY2018 Result Update
Profit & loss statement (IFRS Consolidated)
Y/E March
FY2014
FY2015
FY2016
FY2017
FY2018E
FY2019E
Net sales
13,217
14,819
15,471
14,081
15,844
17,973
Other operating income
141.6
91.7
87.4
106.5
106.5
106.5
Total operating income
13,359
14,911
15,558
14,187
15,951
18,080
% chg
12.5
11.6
4.3
(8.8)
12.4
13.3
Total expenditure
10,096
11,535
11,669
11,811
13,049
14,701
Cost of revenues
4,977
5,531
5,315
5,219
6,236
6,793
SG&A expenses
3,878
4,259
4,570
4,637
4,595
5,212
R&D expenses
1,240
1,745
1,783
1,955
2,218
2,696
EBITDA
3,121
3,284
3,802
2,270
2,796
3,272
% chg
16.6
5.2
15.8
(40.3)
23.2
17.0
(% of Net Sales)
23.6
22.2
24.6
16.1
17.6
18.2
Depreciation & amortisation
659.8
747.4
927.4
1,026.6
1,052.8
1,115.5
EBIT
2,462
2,537
2,875
1,243
1,743
2,157
% chg
27.4
3.1
13.3
(56.7)
40.2
23.7
(% of Net Sales)
18.6
17.1
18.6
8.8
11.0
12.0
Interest & other charges
-
-
-
-
-
-
Other Income
40.0
168.2
(270.8)
80.6
80.6
80.6
(% of PBT)
1.5
6.0
(10.0)
5.5
4.1
3.4
Share in profit of associates
17.4
19.5
22.9
34.9
34.9
34.9
Recurring PBT
2,661
2,816
2,714
1,465
1,965
2,379
% chg
19.0
5.9
(3.6)
(46.0)
34.1
21.1
Extraordinary expense/(Inc.)
-
-
508.5
-
-
-
PBT (reported)
2,660.6
2,816.3
2,714.0
1,465.3
1,964.9
2,378.8
Tax
509.4
598.4
712.7
261.4
443.9
539.1
(% of PBT)
19.1
21.2
26.3
17.8
22.6
22.7
PAT (reported)
2,151.2
2,217.9
2,001.3
1,203.9
1,521.0
1,839.7
Add: Share of earnings of asso.
-
-
-
-
-
-
Less: Minority interest (MI)
-
-
-
-
-
-
Exceptional items
-
-
-
-
-
-
PAT after MI (reported)
2,151.2
2,217.9
2,001.3
1,203.9
1,521.0
1,839.7
ADJ. PAT
2,151.2
2,217.9
2,357.0
1,203.9
1,521.0
1,839.7
% chg
22.9
3.1
6.3
(48.9)
26.3
21.0
(% of Net Sales)
16.3
15.0
12.9
8.5
9.6
10.2
Basic EPS (`)
126.7
130.2
138.2
72.6
91.7
111.0
Fully Diluted EPS (`)
126.7
130.2
138.2
72.6
91.7
111.0
% chg
22.9
2.7
6.1
(47.4)
26.3
21.0
August 3, 2017
8
Dr. Reddy’s Laboratories | 1QFY2018 Result Update
Balance sheet (IFRS Consolidated)
Y/E March (` cr)
FY2014
FY2015
FY2016
FY2017
FY2018E FY2019E
SOURCES OF FUNDS
Equity share capital
84.9
85.2
85.3
82.9
82.9
82.9
Preference Capital
-
-
-
-
-
-
Reserves & surplus
8,995
11,045
12,748
12,179
13,301
14,741
Shareholders funds
9,080
11,130
12,834
12,262
13,384
14,824
Minority Interest
Total loans
4,474.2
3,954.3
3,661.9
5,335.1
5,700.0
5,800.0
Deferred tax liability
(192.9)
(401.3)
(423.0)
(516.4)
(516.4)
(516.4)
Total liabilities
13,361
14,683
16,073
17,081
18,567
20,108
APPLICATION OF FUNDS
Net fixed assets
3,945
4,314
5,396
5,142
6,342
7,542
Goodwill /other intangibles
1,470
1,643
1,969
4,618
4,618
4,618
Capital Work-in-Progress
495.2
495.2
495.2
495.2
495.2
495.2
Investments
2,589
3,811
3,833
2,110
2,110
2,110
Current Assets
7,866
8,558
8,465
8,257
8,857
9,780
Cash
845
539
492
387
299
80
Loans & Advances
793.0
889.1
928.2
844.9
950.7
1,078.4
Other
6,228
7,129
7,045
7,025
7,607
8,622
Current liabilities
3,006
4,214
4,193
4,057
4,371
4,954
Net Current Assets
4,860
4,344
4,273
4,199
4,486
4,826
Other Assets
76
106
517
517
517
Total Assets
13,361
14,683
16,073
17,081
18,567
20,108
August 3, 2017
9
Dr. Reddy’s Laboratories | 1QFY2018 Result Update
Cash flow statement (IFRS Consolidated)
Y/E March (` cr)
FY2014
FY2015
FY2016
FY2017
FY2018E FY2019E
Profit before tax
2,661
2,816
2,714
1,465
1,965
2,379
Depreciation
660
747
927
1,027
1,053
1,116
(Inc)/Dec in Working Capital
(906)
211
24
(32)
(374)
(560)
Less: Other income
40
168
(271)
81
81
81
Direct taxes paid
509
598
713
261
444
539
Cash Flow from Operations
1,865
3,008
3,224
2,118
2,119
2,315
(Inc.)/Dec.in Fixed Assets
(164)
(369)
(1,082)
254
(1,200)
(1,200)
(Inc.)/Dec. in Investments
824
1,222
22
(1,723)
-
-
Other income
40
168
(271)
81
81
81
Cash Flow from Investing
701
1,021
(1,331)
(1,389)
(1,119)
(1,119)
Issue of Equity
-
0
0
(2)
-
-
Inc./(Dec.) in loans
798
(520)
(292)
1,673
365
100
Dividend Paid (Incl. Tax)
358
399
399
399
399
399
Others
(3,390)
(4,214)
(2,047)
(2,904)
(1,851)
(1,914)
Cash Flow from Financing
(2,234)
(4,335)
(1,940)
(834)
(1,087)
(1,415)
Inc./(Dec.) in Cash
331
(306)
(47)
(106)
(88)
(219)
Opening Cash balances
514
845
539
492
387
299
Closing Cash balances
845
539
492
387
299
80
August 3, 2017
10
Dr. Reddy’s Laboratories | 1QFY2018 Result Update
Key ratios
Y/E March
FY2014
FY2015
FY2016
FY2017
FY2018E
FY2019E
Valuation Ratio (x)
P/E (on FDEPS)
19.2
18.6
17.6
33.4
26.5
21.9
P/CEPS
14.7
13.9
14.1
18.0
15.6
13.6
P/BV
4.5
3.7
3.2
3.3
3.0
2.7
Dividend yield (%)
0.6
0.6
0.6
0.6
0.6
0.6
EV/Sales
3.2
2.8
2.6
3.1
2.7
2.4
EV/EBITDA
13.5
12.5
10.7
19.0
15.6
13.4
EV / Total Assets
3.2
2.8
2.5
2.5
2.3
2.2
Per Share Data (`)
EPS (Basic)
126.7
130.2
138.2
72.6
91.7
111.0
EPS (fully diluted)
126.7
130.2
138.2
72.6
91.7
111.0
Cash EPS
165.5
174.0
171.7
134.5
155.2
178.2
DPS
15.0
15.0
15.0
15.0
15.0
15.0
Book Value
534.7
653.3
752.3
739.6
807.2
894.1
Dupont Analysis
EBIT margin
18.6
17.1
18.6
8.8
11.0
12.0
Tax retention ratio
80.9
78.8
73.7
82.2
77.4
77.3
Asset turnover (x)
1.2
1.1
1.0
0.9
0.9
0.9
ROIC (Post-tax)
17.4
15.1
14.3
6.4
7.8
8.8
Cost of Debt (Post Tax)
0.0
0.0
0.0
0.0
0.0
0.0
Leverage (x)
0.4
0.4
0.3
0.3
0.4
0.4
Operating ROE
24.7
20.4
18.3
8.5
10.9
12.2
Returns (%)
ROCE (Pre-tax)
20.2
18.1
18.7
7.5
9.8
11.2
Angel ROIC (Pre-tax)
25.6
22.5
22.9
10.1
14.1
15.4
ROE
26.3
21.9
19.7
9.6
11.9
13.0
Turnover ratios (x)
Asset Turnover (Gross Block)
3.5
3.6
3.2
2.7
2.8
2.6
Inventory / Sales (days)
62
61
60
62
59
57
Receivables (days)
89
90
96
89
85
83
Payables (days)
40
43
59
40
39
39
WC cycle (ex-cash) (days)
97
96
89
98
92
90
Solvency ratios (x)
Net debt to equity
0.4
0.3
0.2
0.4
0.4
0.4
Net debt to EBITDA
1.2
1.0
0.8
2.2
1.9
1.7
Interest Coverage (EBIT / Int.)
-
-
-
-
-
1.0
August 3, 2017
11
Dr. Reddy’s Laboratories | 1QFY2018 Result Update
Research Team Tel: 022 - 39357800
DISCLAIMER
Angel Broking Private Limited (hereinafter referred to as “Angel”) is a registered Member of National Stock Exchange of India Limited,
Bombay Stock Exchange Limited and Metropolitan Stock Exchange Limited. It is also registered as a Depository Participant with CDSL
and Portfolio Manager with SEBI. It also has registration with AMFI as a Mutual Fund Distributor. Angel Broking Private Limited is a
registered entity with SEBI for Research Analyst in terms of SEBI (Research Analyst) Regulations, 2014 vide registration number
INH000000164. Angel or its associates has not been debarred/ suspended by SEBI or any other regulatory authority for accessing
/dealing in securities Market. Angel or its associates/analyst has not received any compensation / managed or co-managed public
offering of securities of the company covered by Analyst during the past twelve months.
This document is solely for the personal information of the recipient, and must not be singularly used as the basis of any investment
decision. Nothing in this document should be construed as investment or financial advice. Each recipient of this document should
make such investigations as they deem necessary to arrive at an independent evaluation of an investment in the securities of the
companies referred to in this document (including the merits and risks involved), and should consult their own advisors to determine
the merits and risks of such an investment.
Reports based on technical and derivative analysis center on studying charts of a stock's price movement, outstanding positions and
trading volume, as opposed to focusing on a company's fundamentals and, as such, may not match with a report on a company's
fundamentals. Investors are advised to refer the Fundamental and Technical Research Reports available on our website to evaluate the
contrary view, if any.
The information in this document has been printed on the basis of publicly available information, internal data and other reliable
sources believed to be true, but we do not represent that it is accurate or complete and it should not be relied on as such, as this
document is for general guidance only. Angel Broking Pvt. Limited or any of its affiliates/ group companies shall not be in any way
responsible for any loss or damage that may arise to any person from any inadvertent error in the information contained in this report.
Angel Broking Pvt. Limited has not independently verified all the information contained within this document. Accordingly, we cannot
testify, nor make any representation or warranty, express or implied, to the accuracy, contents or data contained within this document.
While Angel Broking Pvt. Limited endeavors to update on a reasonable basis the information discussed in this material, there may be
regulatory, compliance, or other reasons that prevent us from doing so.
This document is being supplied to you solely for your information, and its contents, information or data may not be reproduced,
redistributed or passed on, directly or indirectly.
Neither Angel Broking Pvt. Limited, nor its directors, employees or affiliates shall be liable for any loss or damage that may arise from
or in connection with the use of this information.
Disclosure of Interest Statement
Dr. Reddy’s Laboratories
1. Financial interest of research analyst or Angel or his Associate or his relative
No
2. Ownership of 1% or more of the stock by research analyst or Angel or associates or relatives
No
3. Served as an officer, director or employee of the company covered under Research
No
4. Broking relationship with company covered under Research
No
Ratings (Based on expected returns
Buy (> 15%)
Accumulate (5% to 15%)
Neutral (-5 to 5%)
over 12 months investment period):
Reduce (-5% to -15%)
Sell (< -15)
August 3, 2017
12