4QFY2017 Result Update | Pharmaceutical
June 13, 2017
Cipla
SELL
CMP
`550
Performance Highlights
Target Price
`461
Y/E March (` cr)
4QFY2017
3QFY2017
% chg qoq
4QFY2016
% chg yoy
Investment Period
-
Net sales
3,487
3,550
(1.8)
3,253
7.2
Other income
Stock Info
118
251
(53.0)
121
(2.7)
Gross profit
Sector
Pharmaceutical
2,172
2,249
(3.4)
1,842
17.9
Operating profit
Market Cap (` cr)
44,251
411
580
(29.2)
114
259.2
Adj. Net profit
Net Debt (` cr)
3,488
212
375
(43.5)
(93)
-
Source: Company, Angel Research
Beta
0.6
52 Week High / Low
622/460
For 4QFY2017, Cipla posted poor set of numbers primarily related to extra-
Avg. Daily Volume
69,441
ordinary items. For the quarter, the sales came in at `3487cr v/s. `3,253cr in
Face Value (`)
2
4QFY2016, registering a yoy growth of 7.2%, aided by robust growth in export
BSE Sensex
31,262
markets. On the OPM front, the EBDITA margins came in at 11.8% (v/s. 16.8%
Nifty
9,668
expected) v/s 5.0% in 4QFY2016. Thus, the company posted net loss of `62cr
Reuters Code
CIPL.BO
(v/s. profit of `299cr expected) v/s. loss of `93cr in 4QFY2016. We maintain our
Bloomberg Code
CIPLA@IN
SELL.
Results much lower than our expectations: The sales came in at `3487cr v/s.
`3,253cr in 4QFY2016, registering a yoy growth of 7.2%, aided by robust
Shareholding Pattern (%)
growth in export markets. Exports (`2385cr) posted a yoy growth of 22.4%.On
Promoters
36.7
the OPM front, EBDITA margins came in at 11.8% v/s 5.0% in 4QFY2016. The
MF / Banks / Indian Fls
19.2
results for the quarter include one-off charges related to impairment of a part of
FII / NRIs / OCBs
25.4
intangibles from its US acquisition and a provision for loss on certain assets of its
Indian Public / Others
18.7
subsidiary i.e. Cipla BioTec Pvt. Ltd (`56cr). Also, the company posted `214cr
impairment charges pertaining to intangible assets of US Generics business.
Abs. (%)
3m 1yr
3yr
Thus, Adj. net profit was `212cr v/s. loss of `93cr in 4QFY2016.
Sensex
8.1
16.8
22.2
Outlook and valuation: We expect the company to post a 16.7% CAGR in
Cipla
(6.7)
14.6
38.7
net sales to `19,437cr and EPS to record a 39.2% CAGR to `24.3 over
FY2017-19E. We re-iterate our SELL stance on the stock.
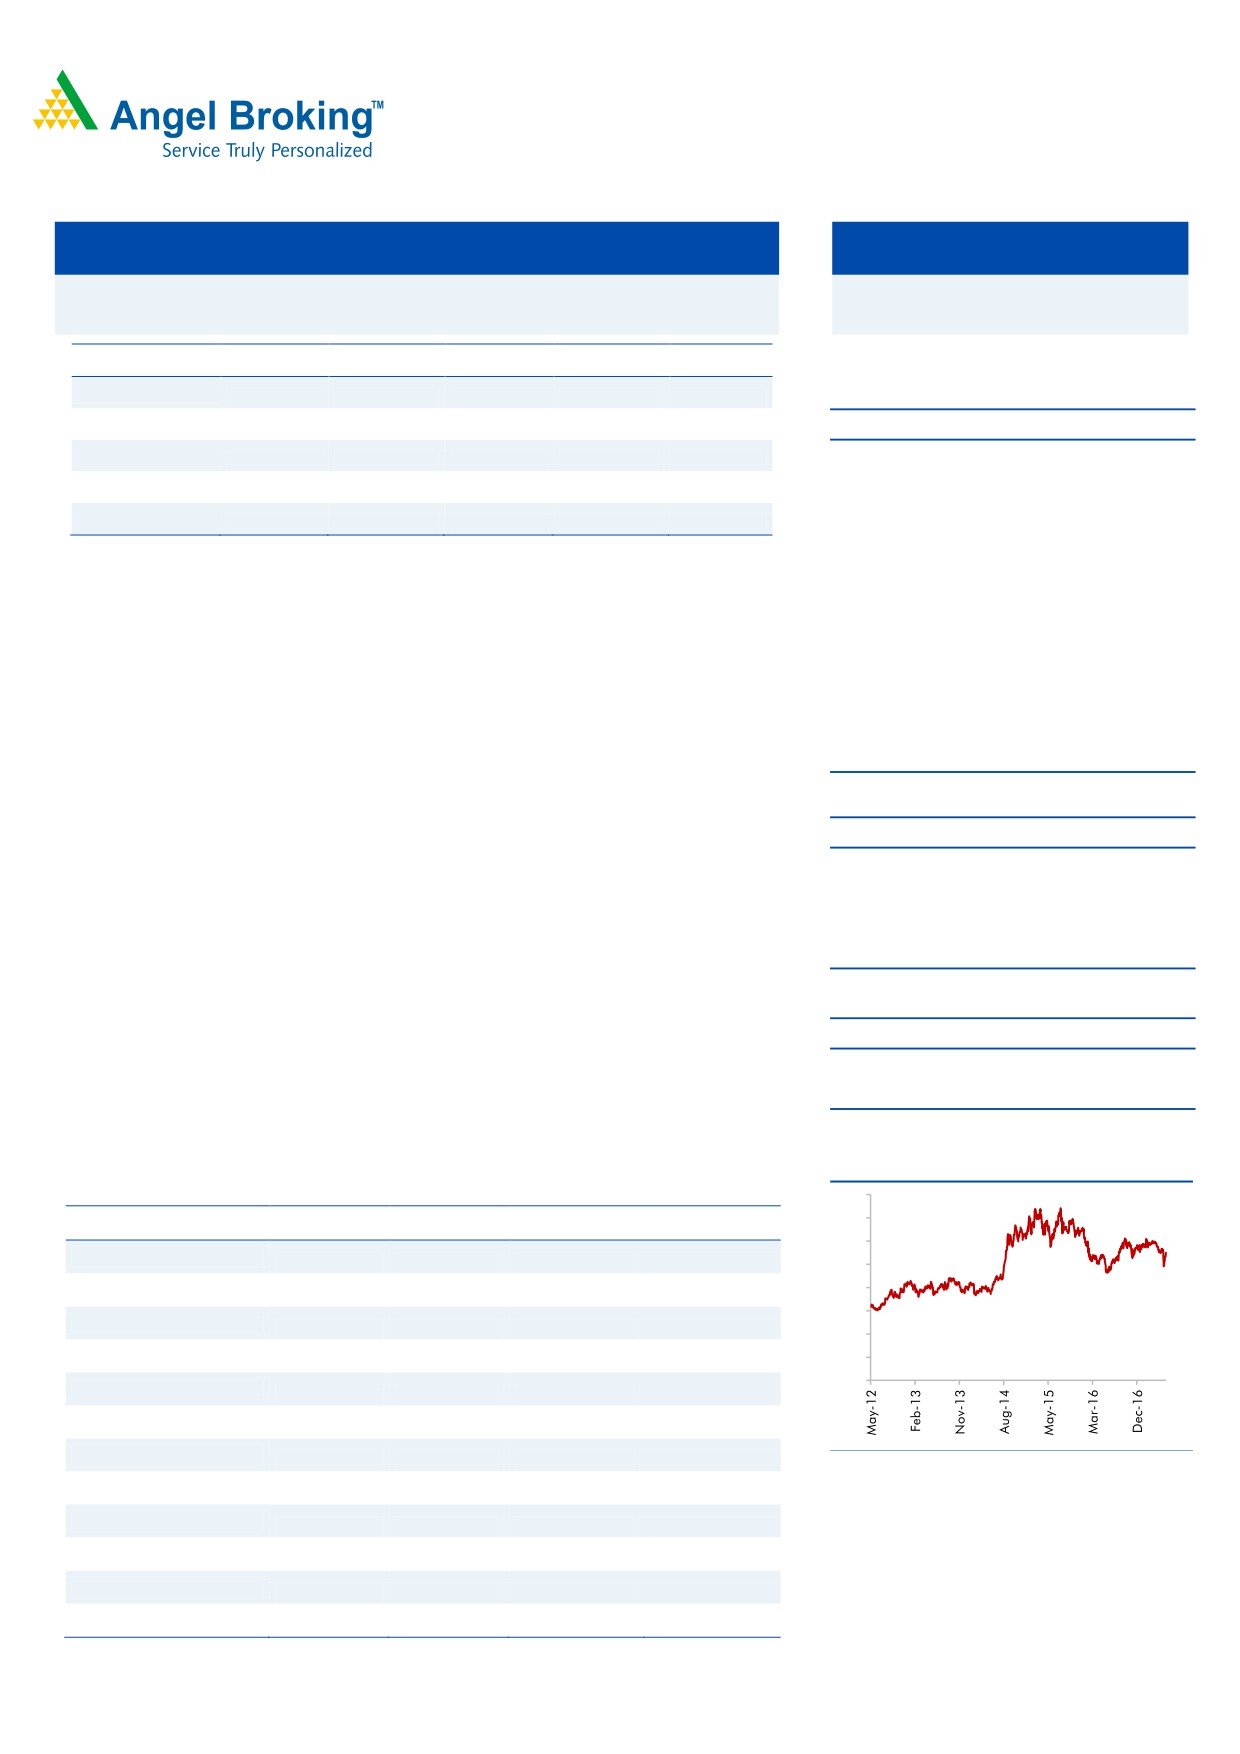
3-Year Daily Price Chart
Key financials (Consolidated)
800
700
Y/E March (` cr)
FY2016
FY2017
FY2018E
FY2019E
600
Net sales
13,372
14,281
16,619
19,437
500
% chg
400
14.5
6.8
16.4
17.0
300
Adj. Net profit
1,506
1,006
1,580
1,949
200
% chg
100
(4.5)
-33.2
57.0
23.3
0
EPS (`)
18.7
12.5
19.7
24.3
EBITDA margin (%)
16.4
14.9
15.4
16.2
P/E (x)
29.3
43.9
28.0
22.7
Source: Company, Angel Research
RoE (%)
13.5
8.4
12.0
13.2
RoCE (%)
10.5
4.4
9.3
11.0
P/BV (x)
3.8
3.5
3.2
2.8
EV/Sales (x)
3.6
3.3
2.8
2.4
Sarabjit Kour Nangra
EV/EBITDA (x)
+91 22 3935 7600 Ext: 6806
21.9
22.2
18.3
14.7
Source: Company, Angel Research; Note: CMP as of June9, 2017
Please refer to important disclosures at the end of this report
1
Cipla | 4QFY2017 Result Update
Exhibit 1: 4QFY2017 ( Consolidated) performance
4QFY2017
3QFY2017
% chg qoq
4QFY2016
% chg yoy
FY2017
FY2016
% chg yoy
Y/E March (` cr)
Net sales
3,487
3,550
(1.8)
3,253
7.2
14,281
13,494
5.8
Other income
117.8
250.7
(53.0)
121.1
(2.7)
578.1
504.1
14.7
Total income
3,605
3,801
(5.2)
3,374
6.8
14,859
13,998
6.1
Gross profit
2172
2249
(3.4)
1842
17.9
8964
8404
6.7
Gross margin
62.3
63.3
56.6
62.8
62.3
Operating profit
411
580
(29.2)
114
259.2
2126
2184
(2.6)
OPM (%)
11.8
16.4
3.5
14.9
16.2
Interest
33.4
59.3
47.7
(30.0)
159
207
(22.9)
Depreciation
632
258
145.3
270
134.4
1323
754
75.4
PBT
(137)
514
-
(82)
-
1222
1727
(29.2)
Provision for taxation
(76)
128
-
-1
-
180
332
(45.8)
PAT before extra-ordinary item
(61)
386
-
(81)
-
1042
1395
(25.3)
Share of Profit /( loss ) of asso.
1
(9)
12
36
35
Extra-ordinary items/(income)
0
0
0
0
0
PAT after extra-ordinary item
(62)
375
-
(93)
-
1006
1360
(26.0)
Adj. PAT
212
375
(43.5)
(93)
-
1006
1360
(26.0)
EPS (`)
2.6
4.7
-
12.5
16.9
Source: Company, Angel Research
Exhibit 2: 4QFY2017 - Actual vs. Angel estimates
(` cr)
Actual
Estimates
Variance
Net sales
3,487
3,817
(8.7)
Other income
118
86
36.9
Operating profit
411
642
(36.0)
Tax
(76)
103
-
Net profit
212
299
(29.2)
Source: Company, Angel Research
Top-line growth lower than expectation
Company posted sales of `3,487cr v/s `3,817cr expected, registering a yoy
growth of 7.2%, aided by robust growth in export markets. Exports (`2385cr)
posted a yoy growth of 22.4%, while domestic formulation (`1197cr) posted a yoy
dip of 4.8%.
USA (US$97mn) posted a yoy growth of 35% in $ terms, mainly on the back of
acquisitions. Cipla is now one of the fastest growing generics players in the US,
strong DTM performance i.e. 10 of the 45 (22%) in IMS are in the leadership (no
1) position, while 25 of 45 (56%) products ranked among Top 3 in their segments.
Cipla has now attained 9th rank in TRx amongst all the generic companies. During
March FY2017, 32 ANDAs have been filed. 18 launches executed in FY2017 with
key launches already at double digit market shares. Going forward in the USA
market, the company would maintain momentum on filings and target a greater
share of limited competition launches.
South Africa (SA) (ZAR925mn) registered a growth of ~26% over the last year.
During FY2017, Cipla improved its overall ranking in SA from 6th to the 4th
largest pharmaceutical company including the tender business; Cipla is the
June 13, 2017
2
Cipla | 4QFY2017 Result Update
3rd largest pharma company in SA. It continued leadership position in
Respiratory, CNS, Oncology & Musculo Skeletal System segments with over
25% market share.
Emerging market sales (US$122mn) posted an overall de-growth of ~8% yoy
in 4QFY2017. De-growth in emerging market territories was largely driven by
currency volatility, impact of rationalization and tender-phasing. Efforts on
improving profitability were driven by greater share of high margin SKUs and
country rationalization.
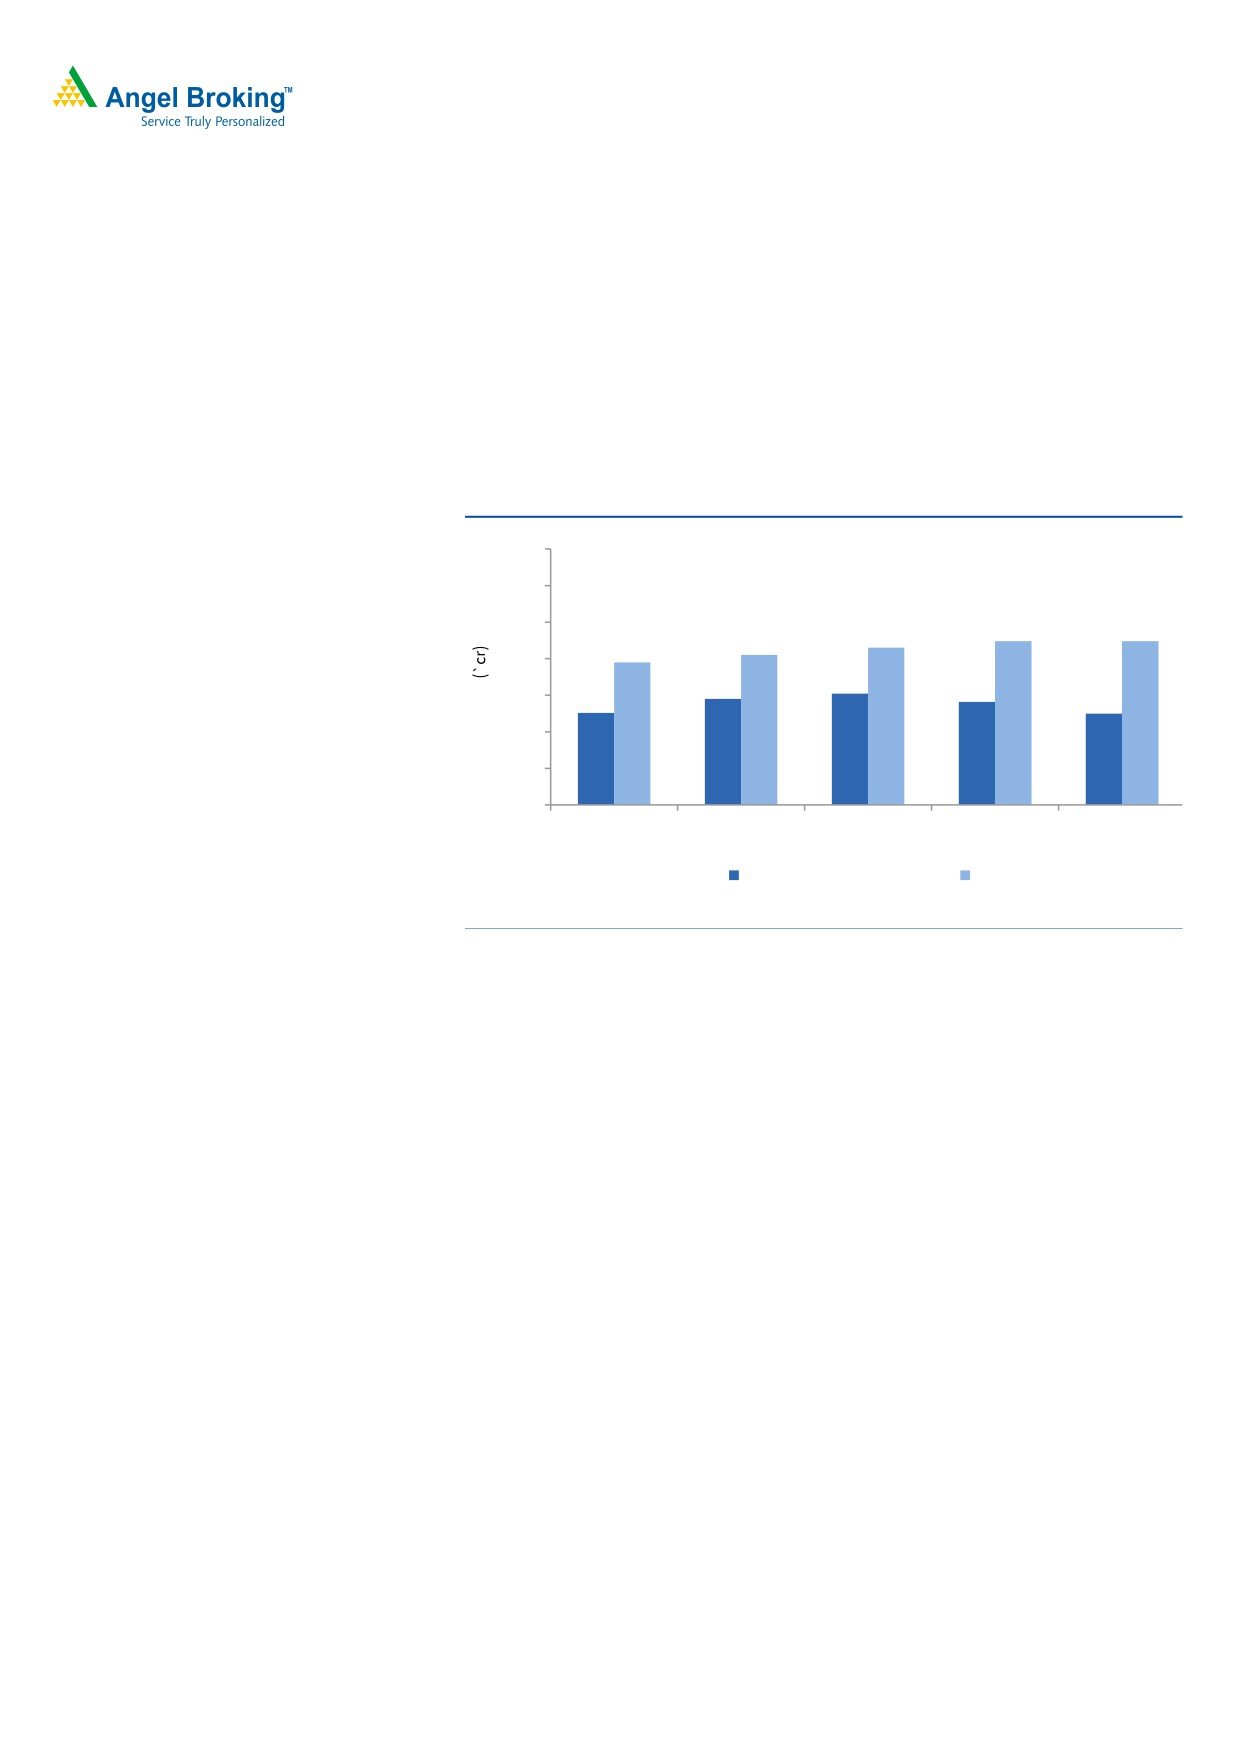
Exhibit 3: Sales Trend
3,500
3,000
2239
2,500
2240
2150
2051
1,948
2,000
1522
1258
1449
1408
1,500
1247
1,000
500
0
4QFY2016
1QFY2017
2QFY2017
3QFY2017
4QFY2017
Domestic
Export
Source: Company
Operating profit margin lower than expectation
On the OPM front, the EBDITA margins came in at 11.8% (v/s. 16.8% expected)
v/s. 5.0% in 4QFY2016. The results for the quarter include one-off charges related
to impairment of a part of intangibles from its US acquisition and a provision for
loss on certain assets of its subsidiary i.e. Cipla BioTec Pvt. Ltd (`56cr). Also, the
company posted `214cr impairment charges pertaining to intangible assets of US
Generics business. Total R&D investments for this quarter were at 8.6% of
revenues. The adjusted EBDITA during the quarter was 13.4%.
June 13, 2017
3
Cipla | 4QFY2017 Result Update
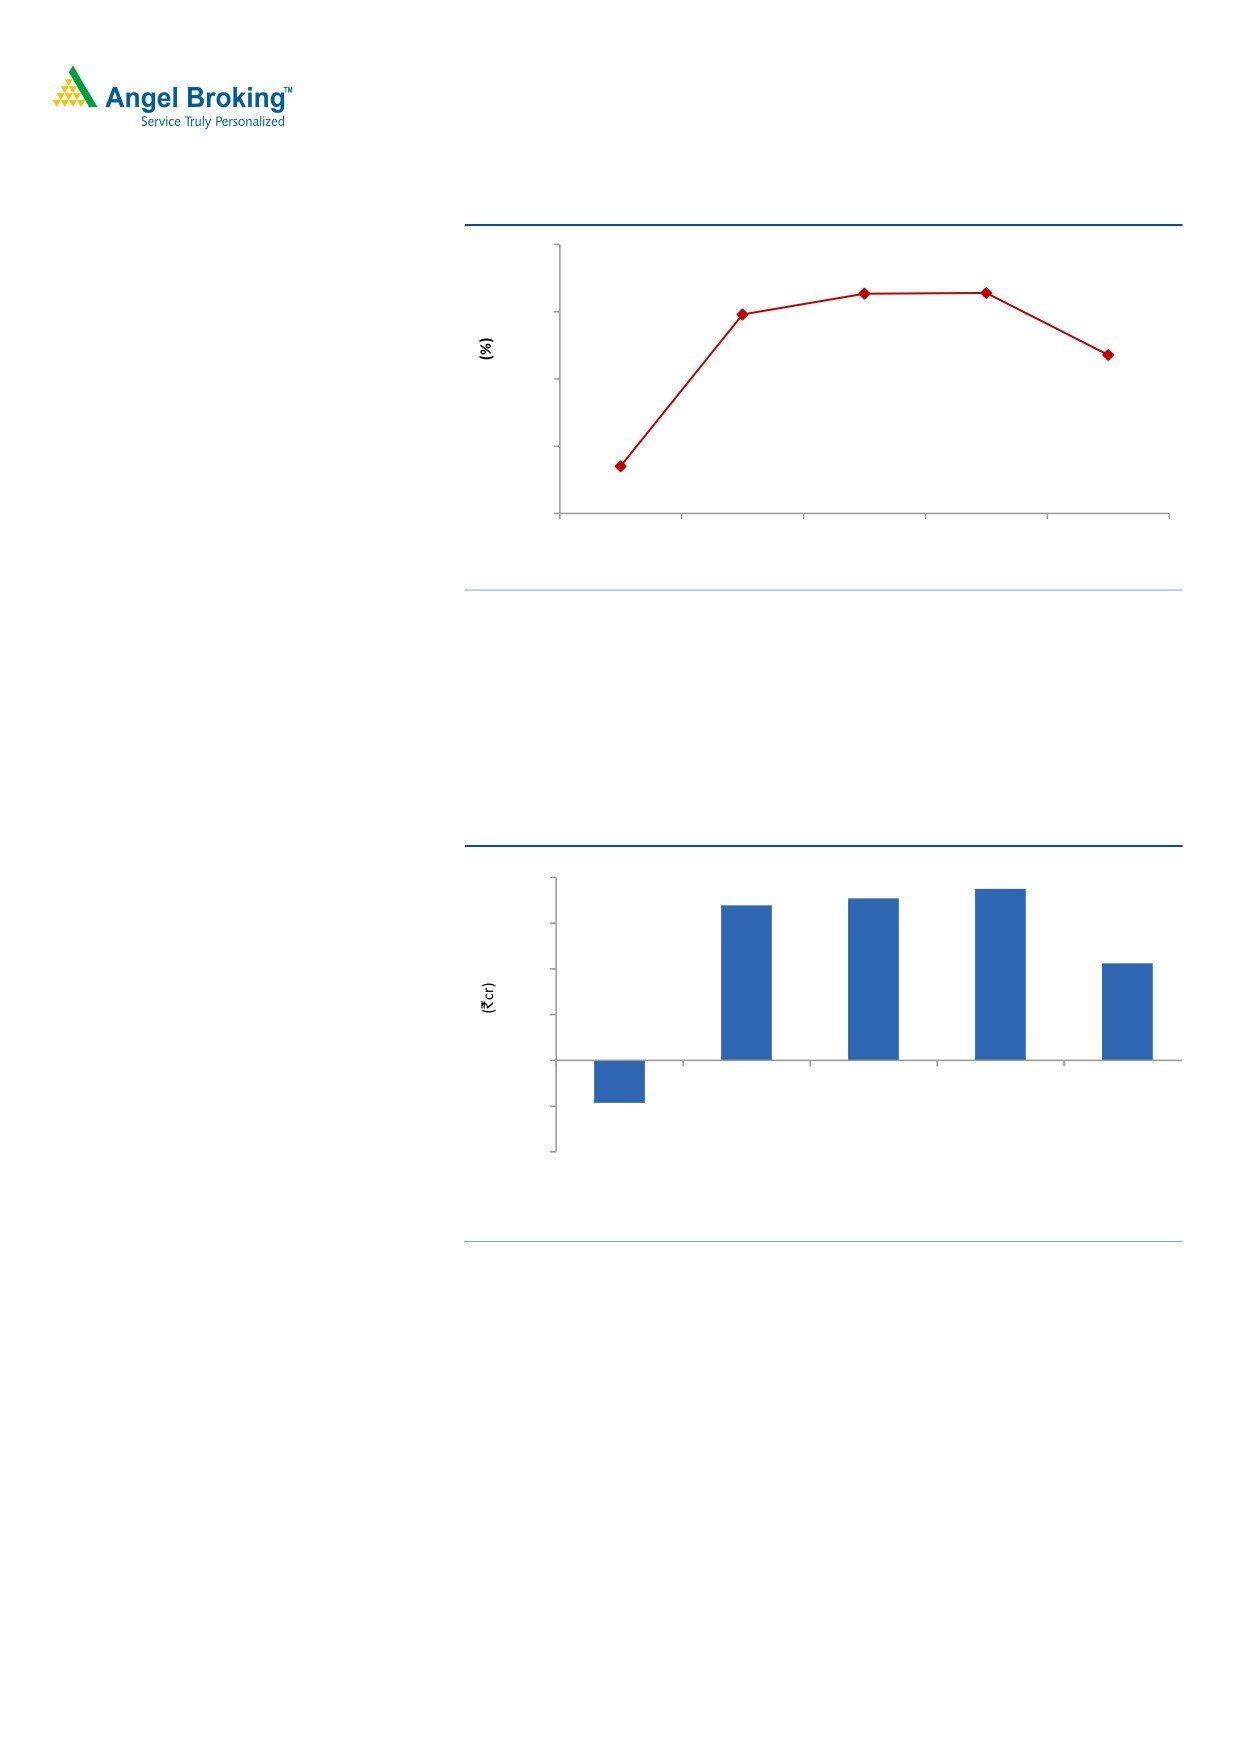
Exhibit 4: OPM Trend
20.0
16.4
15.0
16.4
11.8
14.8
10.0
5.0
3.5
0.0
4QFY2016 1QFY2017 2QFY2017 3QFY2017 4QFY2017
Source: Company
Net profit lower than expectation
Thus, the company posted net loss of `62cr (v/s. profit of `299cr expected) v/s.
loss of `93cr in 4QFY2016. Consequently, Adj. PAT came in at `212cr (v/s.
`299cr expected) v/s. `93cr loss in 4QFY2016.
Exhibit 5: Net Profit Trend
339
375
400
354
300
212
200
100
0
4QFY2016 1QFY2017 2QFY2017 3QFY2017 4QFY2017
-100
-93
-200
Source: Company
Concall takeaways
For FY2018, the company has guided for double-digit growth in revenue with
margin improvement (our est. of 15%) on the back of strong ramp-up in US
sales and double-digit growth in the domestic business.
R&D as % of sales stood at 8.8%; expected to remain at 8-8.5% in FY2018.
Capex expected to be around `700-800cr in FY2018.
In USA, the company expects to file 20-25 ANDAs in FY2018.
GST will take out one quarter of growth in India.
June 13, 2017
4
Cipla | 4QFY2017 Result Update
Recommendation rationale
Export segment to be the growth driver: Cipla exports to more than 180 countries,
with growth coming through marketing alliances and distribution tie-ups in various
markets. Exports contributed 60% to the total turnover in FY2017, with Africa, US
and Latin America constituting more than ~60% of total exports. In the US, Cipla
has a strong product pipeline of 168 ANDAs, out of which, 950 are approved.
Another long term growth driver for the company is the launch of the CFC-free
inhalers in the regulated markets. CFC-free inhalers in Europe and US address a
potential market size of more than US$3bn.
During the quarter, the company strengthened its foothold in the US through the
acquisition of InvaGen Pharma and Exelan Pharma. The companies added a
pipeline of ~70 ANDAs of which 40 are approved (32 marketed) and 30 awaiting
approval. The company is likely to add over US$250mn in FY2017. It will also
provide manufacturing capabilities in the US. Overall, we expect the company’s
exports to grow at a CAGR of 18.7% during FY2017-19E.
Increasing penetration in the domestic market: Cipla is one of the largest players
in the domestic formulation market with a market share of around 5.3%. Domestic
formulations contributed 40% to the company’s total turnover in FY2017. The
company is the market leader in key therapeutic areas such as respiratory care,
anti-viral and urological. Cipla’s distribution network in India consists of a field
force of around 7,000-8,000 employees. The company plans to increase its focus
on domestic markets with new therapies such as oncology and neuro-psychiatry in
the offing. The company plans to focus on growing its market share and sales by
increasing penetration in the Indian market, especially in rural areas, and plans to
expand its product portfolio by launching biosimilars, particularly related to
the oncology, anti-asthmatic and anti-arthritis categories. Overall, we expect
the company’s domestic formulation business to post a CAGR of 13.5% over
FY2017-19E.
Valuation: We expect the company to post a 16.7% CAGR in net sales to
`19,437cr and EPS to record a 39.2% CAGR to `24.3 over FY2017-19E. The
growth in the top-line would be driven by domestic formulation sales and exports.
We maintain our SELL stance on the stock.
Exhibit 6: Key assumptions
Key assumptions
FY2018E
FY2019E
Domestic growth (%)
13.0
15.0
Exports growth (%)
18.6
18.8
Growth in employee expenses (%)
15.0
15.0
Operating margins (excl tech. know-how fees) (%)
15.4
16.2
Source: Company, Angel Research
June 13, 2017
5
Cipla | 4QFY2017 Result Update
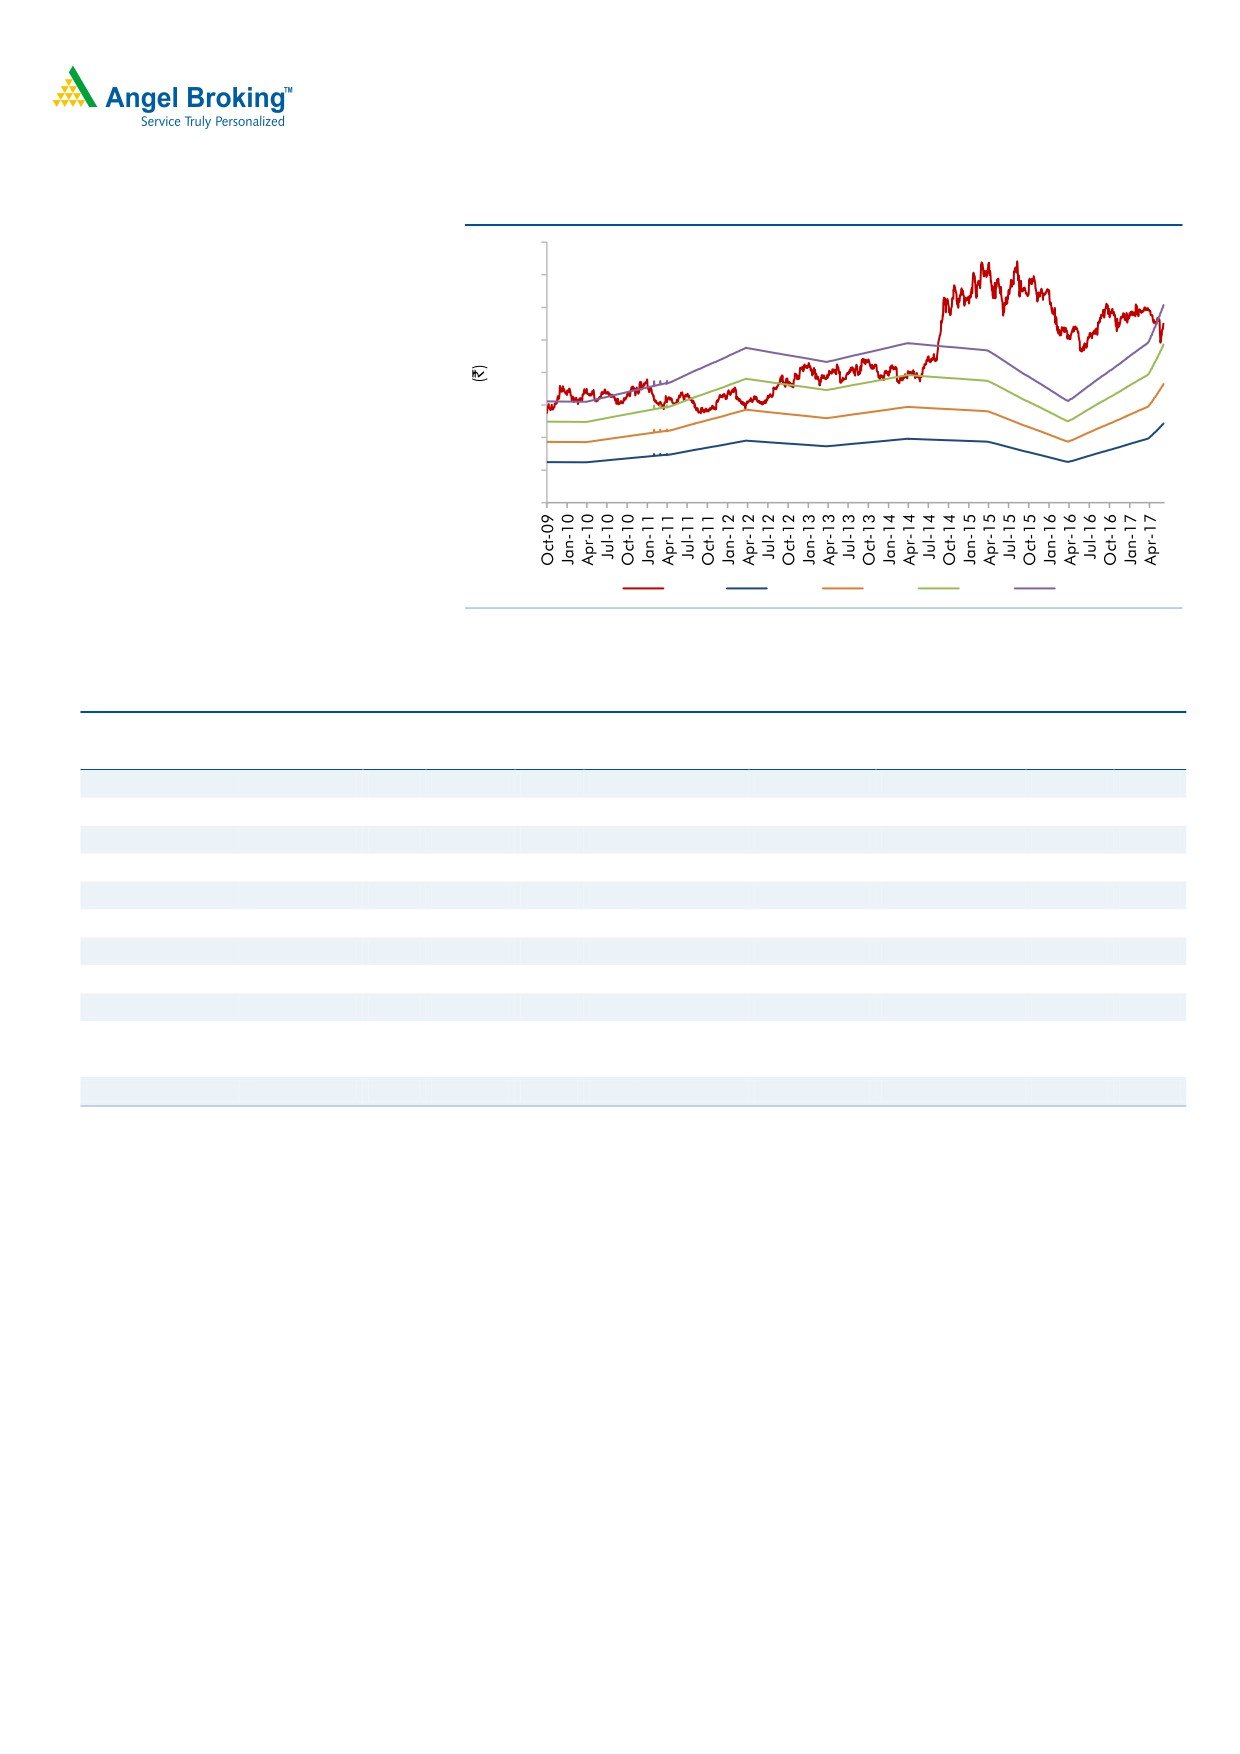
Exhibit 7: One-year forward PE band
800
700
600
500
400
300
200
100
-
Price
10x
15x
20x
25x
Source: Company, Angel Research
Exhibit 8: Recommendation Summary
Company
Reco
CMP
Tgt. price
Upside
FY2018E
FY16-18E
FY2018E
(`)
(`)
% PE (x) EV/Sales (x) EV/EBITDA (x) CAGR in EPS (%) RoCE (%) RoE (%)
Alembic Pharma
Buy
552
648
17.3
21.7
2.5
12.0
(10.8)
27.5
25.3
Aurobindo Pharma
Buy
609
823
35.2
13.6
2.2
9.9
18.1
22.5
26.1
Cadila Healthcare
Sell
541
450
(16.8)
28.4
4.8
23.8
(0.5)
16.2
24.6
Cipla
Sell
550
461
(16.2)
28.0
2.8
18.3
2.4
9.3
12.0
Dr Reddy's
Neutral
2,631
-
-
24.8
2.9
15.8
(13.7)
10.8
13.6
Dishman Pharma
Under Review
301
-
-
26.6
2.9
12.7
16.3
13.0
13.5
GSK Pharma*
Neutral
2,463
-
-
49.7
6.2
38.4
6.0
22.3
21.3
Indoco Remedies
Sell
193
153
(20.7)
17.1
1.7
11.7
6.3
10.1
15.0
Ipca labs
Buy
501
710
41.7
25.8
1.8
12.6
13.9
10.4
9.5
Lupin
Buy
1,161
1,526
31.5
19.0
2.7
11.4
10.0
20.6
17.8
Sanofi India
Neutral
4,051
-
-
29.0
3.3
19.8
16.8
22.5
26.4
Sun Pharma
Buy
525
712
35.7
16.6
3.5
12.9
1.2
16.9
18.7
Source: Company, Angel Research; Note: * December year ending
Company Background
Cipla is a leading pharmaceutical company in India with a strong presence in
both, the export and domestic markets. On the exports front, where it follows the
partnership model, it has 5,700 product registrations in around 180 countries.
Cipla is a market leader in the domestic formulation market with ~5.3% market
share. The company is likely to continue on the growth trajectory owing to its entry
into the inhalers market in the EU and potential new long-term manufacturing
contracts with Global Innovators.
June 13, 2017
6
Cipla | 4QFY2017 Result Update
Profit & loss statement (Consolidated)
Y/E March (` cr)
FY2014
FY2015
FY2016
FY2017
FY2018E
FY2019E
Gross sales
9,902
11,861
13,587
14,497
16,871
19,732
Less: Excise duty
149.3
179.7
215.0
216.4
251.8
294.5
Net sales
9,753
11,681
13,372
14,281
16,619
19,437
Other operating income
348
348
306
349
349
349
Total operating income
10,100
12,029
13,678
14,630
16,968
19,786
% chg
22.0
19.1
13.7
7.0
16.0
16.6
Total expenditure
7,967
9,612
11,177
12,154
14,062
16,292
Net raw materials
3,875
4,556
5,118
5,317
6,199
7,250
Other mfg costs
827
993
1,142
1,313
1,510
1,736
Personnel
1,543
2,083
2,447
2,634
3,029
3,483
Other
1,722
1,981
2,470
2,891
3,324
3,823
EBITDA
1,786
2,069
2,195
2,126
2,557
3,145
% chg
(11.0)
15.9
6.1
(3.1)
20.3
23.0
(% of Net Sales)
18.3
17.7
16.4
14.9
15.4
16.2
Depreciation & amort.
373
457
542
1,323
831
927
EBIT
1,413
1,613
1,654
803
1,726
2,218
% chg
(15.6)
14.1
2.5
(51.4)
114.8
28.5
(% of Net Sales)
14.5
13.8
12.4
5.6
10.4
11.4
Interest & other charges
146
85
161
159
159
159
Other Income
266
266
209
229
229
229
(% of PBT)
14.1
12.4
10.4
18.7
10.7
8.7
Recurring PBT
1,881
2,141
2,007
1,222
2,145
2,636
% chg
(9.1)
13.8
(6.3)
(39.1)
75.5
22.9
Extraordinary exp./(Inc.)
-
-
-
-
-
-
PBT (reported)
1,881
2,141
2,007
1,222
2,145
2,636
Tax
463.4
535.3
439.6
179.8
536.2
659.1
(% of PBT)
24.6
25.0
21.9
14.7
25.0
25.0
PAT (reported)
1,417
1,606
1,567
1,042
1,609
1,977
Add: Share of earnings of asso.
(12)
(12)
(12)
(7)
(10)
(9)
Less: Minority interest (MI)
16
16
49
29
18
19
Prior period items
-
-
-
-
-
-
PAT after MI (reported)
1,388
1,578
1,506
1,006
1,580
1,949
ADJ. PAT
1,388
1,578
1,506
1,006
1,580
1,949
% chg
(8.9)
13.6
(4.5)
(33.2)
57.0
23.3
(% of Net Sales)
14.2
13.5
11.3
7.0
9.5
10.0
Basic EPS (`)
17.3
19.6
18.7
12.5
19.7
24.3
Fully Diluted EPS (`)
17.3
19.6
18.7
12.5
19.7
24.3
% chg
(8.9)
13.6
(4.6)
(33.2)
57.0
23.3
June 13, 2017
7
Cipla | 4QFY2017 Result Update
Balance sheet (Consolidated)
Y/E March (` cr)
FY2014
FY2015
FY2016
FY2017
FY2018E
FY2019E
SOURCES OF FUNDS
Equity share capital
161
161
161
161
161
161
Preference Capital
-
-
-
-
-
-
Reserves & surplus
9,890
10,629
11,356
12,365
13,757
15,518
Shareholders funds
10,050
10,801
11,516
12,525
13,918
15,679
Minority interest
50
180
350
438
438
438
Total loans
1,247.9
1,701.8
5,191.4
4,112.6
4,112.6
4,112.6
Other long term liabilities
32.6
32.6
32.6
32.6
32.6
32.6
Long Term Provisions
77.4
168.4
255.6
263.5
263.5
263.5
Deferred tax liability
309.0
284.6
897.0
588.8
588.8
588.8
Total liabilities
11,767
13,169
18,243
17,961
19,354
21,115
APPLICATION OF FUNDS
Gross block
6,183
6,868
8,081
9,786
10,986
12,186
Less: acc. depreciation
2,180
2,634
3,176
4,499
5,329
6,256
Net block
4,003
4,234
4,905
5,288
5,657
5,930
Capital work-in-progress
442
442
442
442
442
442
Goodwill
2,493
2,735
6,084
5,427
5,427
5,427
Investments
709
640
757
973
973
973
Long Term Loans and Adv.
301
419
603
773
899
1,052
Current assets
5,340
7,201
8,259
7,900
9,280
11,179
Cash
175
564
871
624
804
1,266
Loans & advances
596
701
958
857
997
1,166
Others
4,569
5,936
6,429
6,419
7,479
8,747
Current liabilities
1,634
2,501
2,806
2,841
3,324
3,887
Net current assets
3,706
4,700
5,453
5,059
5,956
7,291
Mis. Exp. not written off
112
-
-
-
-
-
Total assets
11,767
13,169
18,243
17,961
19,354
21,115
June 13, 2017
8
Cipla | 4QFY2017 Result Update
Cash flow statement (Consolidated)
Y/E March (` cr)
FY2014
FY2015
FY2016
FY2017
FY2018E FY2019E
Profit before tax
1,881
2,141
2,007
1,222
2,145
2,636
Depreciation
373
457
542
1,323
831
927
(Inc)/Dec in Working Capital
(149)
(722)
(629)
(23)
(844)
(1,026)
Direct taxes paid
431
537
632
-
-
-
Cash Flow from Operations
1,673
1,339
1,287
2,522
2,132
2,537
(Inc.)/Dec.in Fixed Assets
(930)
(684)
(1,213)
(1,706)
(1,200)
(1,200)
(Inc.)/Dec. in Investments
1,824
69
(117)
(216)
-
-
Other income
-
-
-
-
-
-
Cash Flow from Investing
894
(616)
(1,330)
(1,922)
(1,200)
(1,200)
Issue of Equity
-
-
-
-
-
-
Inc./(Dec.) in loans
311
545
3,577
(1,071)
-
-
Dividend Paid (Incl. Tax)
(188)
(188)
(188)
(188)
(188)
(188)
Others
(2,658)
(692)
(3,039)
412
(564)
(687)
Cash Flow from Financing
(2,535)
(335)
350
(847)
(752)
(875)
Inc./(Dec.) in Cash
32
389
307
(247)
180
462
Opening Cash balances
143
175
564
871
624
804
Closing Cash balances
175
564
871
624
804
1,266
June 13, 2017
9
Cipla | 4QFY2017 Result Update
Key Ratio
Y/E March
FY2014
FY2015
FY2016
FY2017
FY2018E
FY2019E
Valuation Ratio (x)
P/E (on FDEPS)
31.8
28.0
29.3
43.9
28.0
22.7
P/CEPS
25.1
21.7
21.6
19.0
18.3
15.4
P/BV
4.4
4.1
3.8
3.5
3.2
2.8
Dividend yield (%)
0.4
0.4
0.4
0.4
0.4
0.4
EV/Sales
4.6
3.9
3.6
3.3
2.8
2.4
EV/EBITDA
25.2
21.8
21.9
22.2
18.3
14.7
EV / Total Assets
3.8
3.4
2.6
2.6
2.4
2.2
Per Share Data (`)
EPS (Basic)
17.3
19.6
18.7
12.5
19.7
24.3
EPS (fully diluted)
17.3
19.6
18.7
12.5
19.7
24.3
Cash EPS
21.9
25.3
25.5
29.0
30.0
35.8
DPS
2.0
2.0
2.0
2.0
2.0
2.0
Book Value
125.2
134.5
143.3
155.9
173.2
195.2
Dupont Analysis
EBIT margin
14.5
13.8
12.4
5.6
10.4
11.4
Tax retention ratio
75.4
75.0
78.1
85.3
75.0
75.0
Asset turnover (x)
0.9
1.0
0.9
0.8
0.9
1.0
ROIC (Post-tax)
10.1
10.3
8.8
4.0
7.4
8.8
Cost of Debt (Post Tax)
9.9
4.3
3.7
2.9
2.9
2.9
Leverage (x)
0.1
0.0
0.0
1.0
2.0
3.0
Operating ROE
10.1
10.3
8.8
5.2
16.3
26.6
Returns (%)
ROCE (Pre-tax)
12.8
12.9
10.5
4.4
9.3
11.0
Angel ROIC (Pre-tax)
15.3
17.8
16.3
7.2
14.3
16.6
ROE
14.6
15.1
13.5
8.4
12.0
13.2
Turnover ratios (x)
Asset Turnover (Gross Block)
1.8
1.8
1.8
1.6
1.6
1.7
Inventory / Sales (days)
95
96
101
87
88
91
Receivables (days)
60
74
58
66
67
69
Payables (days)
41
55
74
49
50
50
WC cycle (ex-cash) (days)
124
116
116
112
103
103
Solvency ratios (x)
Net debt to equity
0.1
0.1
0.4
0.3
0.2
0.2
Net debt to EBITDA
0.6
0.5
2.0
1.6
1.3
0.9
Interest Coverage (EBIT/Int.)
-
-
-
-
-
-
June 13, 2017
10
Cipla | 4QFY2017 Result Update
Research Team Tel: 022 - 39357800
DISCLAIMER
Angel Broking Private Limited (hereinafter referred to as “Angel”) is a registered Member of National Stock Exchange of India Limited,
Bombay Stock Exchange Limited and Metropolitan Stock Exchange Limited. It is also registered as a Depository Participant with CDSL
and Portfolio Manager with SEBI. It also has registration with AMFI as a Mutual Fund Distributor. Angel Broking Private Limited is a
registered entity with SEBI for Research Analyst in terms of SEBI (Research Analyst) Regulations, 2014 vide registration number
INH000000164. Angel or its associates has not been debarred/ suspended by SEBI or any other regulatory authority for accessing
/dealing in securities Market. Angel or its associates/analyst has not received any compensation / managed or co-managed public
offering of securities of the company covered by Analyst during the past twelve months.
This document is solely for the personal information of the recipient, and must not be singularly used as the basis of any investment
decision. Nothing in this document should be construed as investment or financial advice. Each recipient of this document should
make such investigations as they deem necessary to arrive at an independent evaluation of an investment in the securities of the
companies referred to in this document (including the merits and risks involved), and should consult their own advisors to determine
the merits and risks of such an investment.
Reports based on technical and derivative analysis center on studying charts of a stock's price movement, outstanding positions and
trading volume, as opposed to focusing on a company's fundamentals and, as such, may not match with a report on a company's
fundamentals. Investors are advised to refer the Fundamental and Technical Research Reports available on our website to evaluate the
contrary view, if any.
The information in this document has been printed on the basis of publicly available information, internal data and other reliable
sources believed to be true, but we do not represent that it is accurate or complete and it should not be relied on as such, as this
document is for general guidance only. Angel Broking Pvt. Limited or any of its affiliates/ group companies shall not be in any way
responsible for any loss or damage that may arise to any person from any inadvertent error in the information contained in this report.
Angel Broking Pvt. Limited has not independently verified all the information contained within this document. Accordingly, we cannot
testify, nor make any representation or warranty, express or implied, to the accuracy, contents or data contained within this document.
While Angel Broking Pvt. Limited endeavors to update on a reasonable basis the information discussed in this material, there may be
regulatory, compliance, or other reasons that prevent us from doing so.
This document is being supplied to you solely for your information, and its contents, information or data may not be reproduced,
redistributed or passed on, directly or indirectly.
Neither Angel Broking Pvt. Limited, nor its directors, employees or affiliates shall be liable for any loss or damage that may arise from
or in connection with the use of this information.
Disclosure of Interest Statement
Cipla
1. Financial interest of research analyst or Angel or his Associate or his relative
No
2. Ownership of 1% or more of the stock by research analyst or Angel or associates or relatives
No
3. Served as an officer, director or employee of the company covered under Research
No
4. Broking relationship with company covered under Research
No
Ratings (Based on expected returns
Buy (> 15%)
Accumulate (5% to 15%)
Neutral (-5 to 5%)
over 12 months investment period):
Reduce (-5% to -15%)
Sell (< -15)
June 13, 2017
11