1QFY2018 Result Update | Pharmaceutical
August 18, 2017
Cipla
SELL
CMP
`590
Performance Highlights
Target Price
`458
Y/E March (` cr)
1QFY2018
4QFY2017
% chg qoq
1QFY2017
% chg yoy
Investment Period
-
Net sales
3,432
3,487
(1.6)
3,556
(3.5)
Other income
Stock Info
244
118
107.3
119
105.0
Gross profit
Sector
Pharmaceutical
2,256
2,172
3.9
2,186
3.2
Operating profit
Market Cap (` cr)
47,493
554
411
34.7
517
7.1
Adj. Net profit
Net Debt (` cr)
3,488
409
212
93.1
339
20.6
Source: Company, Angel Research
Beta
0.7
52 Week High / Low
622/479
Cipla posted poor set of numbers for 1QFY2018. Sales came in at `3,432cr
Avg. Daily Volume
69,441
(`3,789cr expected) v/s. `3,566cr in 1QFY2017, a yoy de-growth of 3.5%, mainly
Face Value (`)
2
driven by the dip in Indian formulation sales. Indian formulation sales registered
BSE Sensex
31,771
(`1,271cr) a yoy dip of 12.9%, mainly on the back of GST implementation. On
Nifty
9,897
operating front, the EBITDA margins came in at 16.1% (15.5% expected) v/s. 14.8%
Reuters Code
CIPL.BO
in 1QFY2017. Thus, the PAT came in at ` 409cr (`346cr expected) v/s. `339cr in
Bloomberg Code
CIPLA@IN
1QFY2017, a yoy growth of 20.6%. We maintain our SELL.
Results lower than our expectations, driven mainly by other income: Sales came in at
`3,432cr (`3,789cr expected) v/s. `3,566cr in 1QFY2017, a yoy de-growth of 3.5%.
Shareholding Pattern (%)
Indian formulation sales posted (`1,271cr) a yoy dip of 12.9%, mainly on the back of
Promoters
36.7
GST implementation. Its other market USA (US$100mn), posted 2.0% yoy growth.
MF / Banks / Indian Fls
17.9
South Africa (ZAR 998mn), posted a 10.0% yoy growth. On operating front, the
FII / NRIs / OCBs
26.9
EBITDA margins came in at 16.1% (15.5% expected) v/s. 14.8% in 1QFY2017,
Indian Public / Others
18.5
mainly on the back of lower than expected sales during the quarter and 11.2% rise in
the other expenses. Thus, the PAT came in at ` 409cr (`346cr expected) v/s. `339cr
Abs. (%)
3m 1yr
3yr
in 1QFY2017, a yoy growth of 20.6%.
Sensex
8.0
13.2
20.4
Outlook and valuation: We expect the company to post a
16.7% CAGR in
Cipla
2.4
6.6
25.6
net sales to
`19,437cr and EPS to record a
38.7% CAGR to
`24.1 over
FY2017-19E. We re-iterate our SELL stance on the stock.
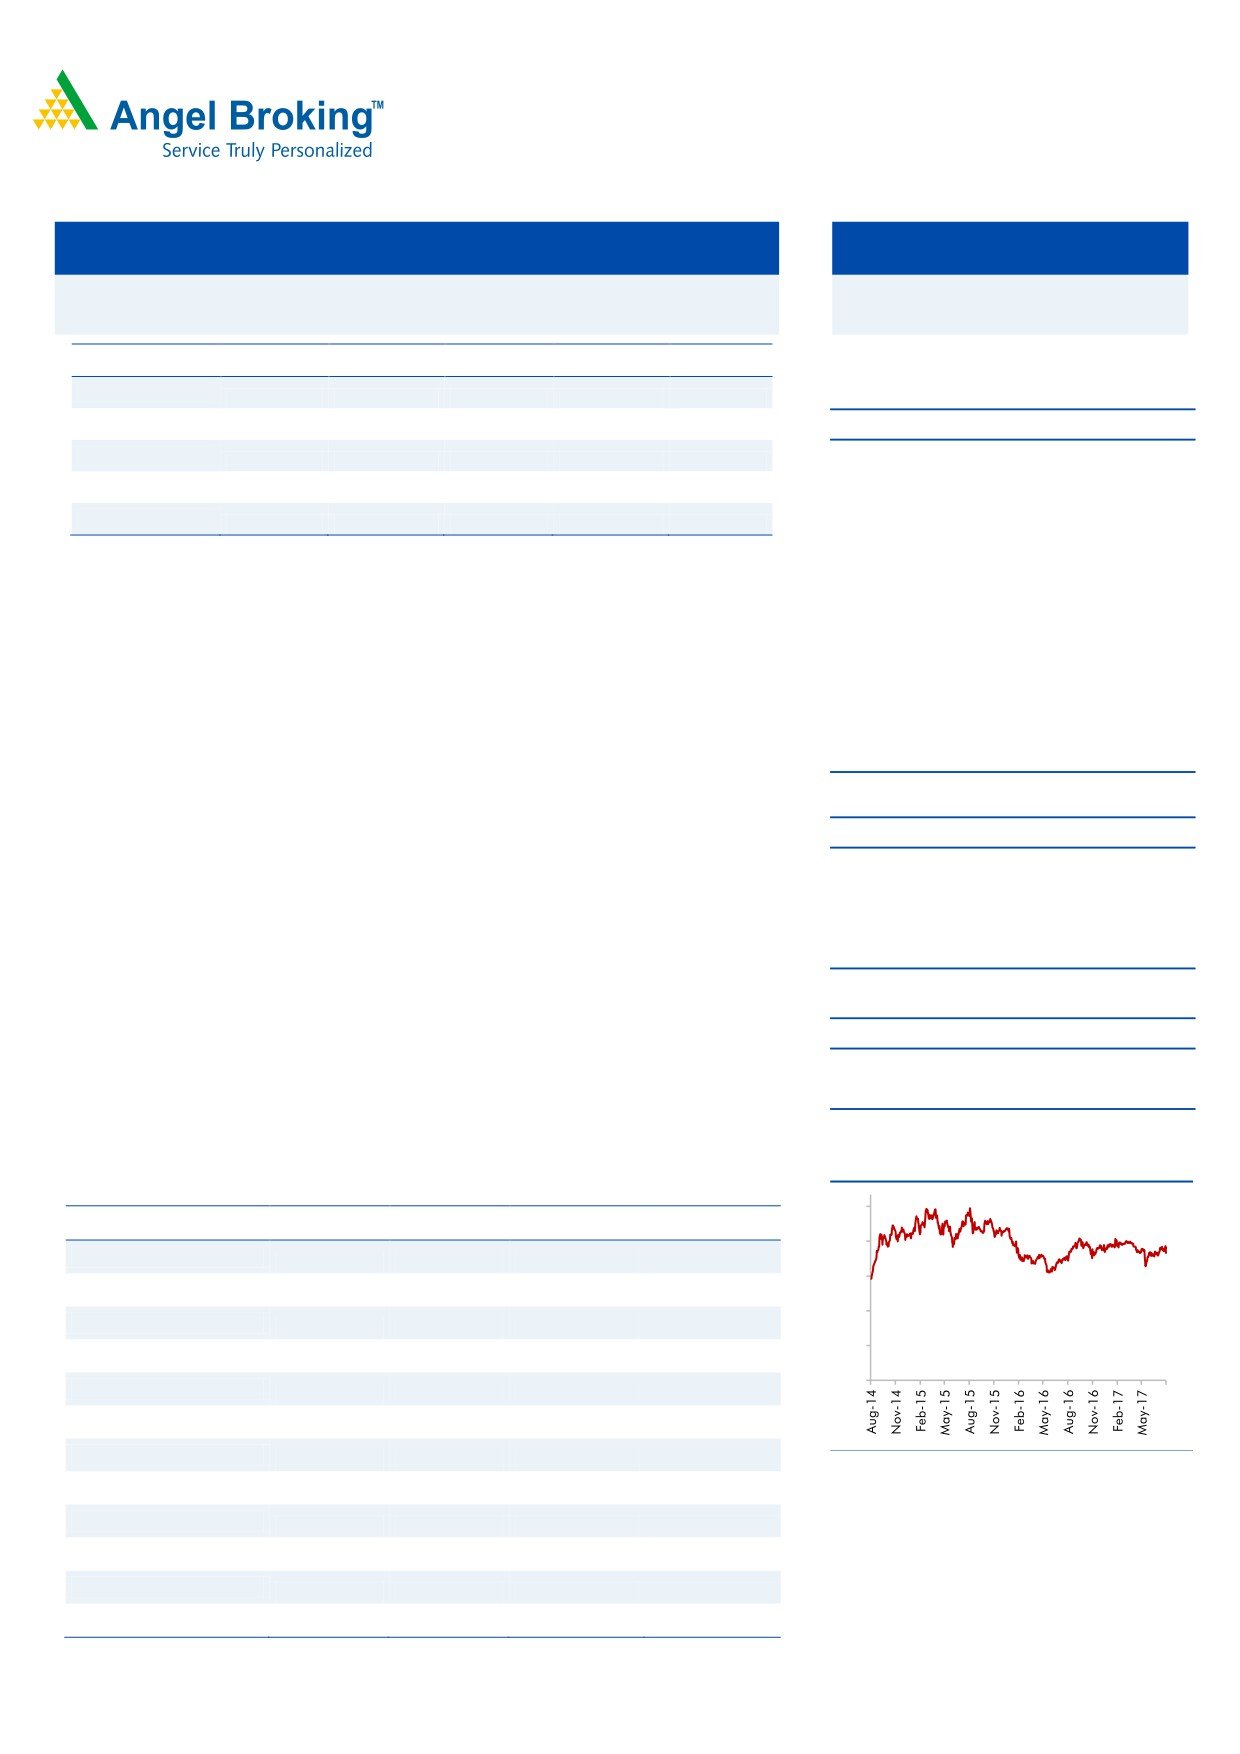
3-Year Daily Price Chart
Key financials (Consolidated)
750
Y/E March (` cr)
FY2016
FY2017
FY2018E
FY2019E
600
Net sales
13,494
14,281
16,619
19,437
450
% chg
15.5
5.8
16.4
17.0
300
Adj. Net profit
1,360
1,006
1,568
1,936
150
% chg
(13.8)
(26.0)
55.8
23.5
0
EPS (`)
16.9
12.5
19.5
24.1
EBITDA margin (%)
16.2
14.9
15.4
16.2
P/E (x)
34.9
47.1
30.2
24.5
Source: Company, Angel Research
RoE (%)
12.2
8.4
11.9
13.1
RoCE (%)
9.1
4.4
9.2
10.9
P/BV (x)
4.1
3.8
3.4
3.0
EV/Sales (x)
3.8
3.5
3.0
2.5
Sarabjit Kour Nangra
EV/EBITDA (x)
+91 22 3935 7600 Ext: 6806
23.5
23.7
19.6
15.7
Source: Company, Angel Research; Note: CMP as of August 16, 2017
Please refer to important disclosures at the end of this report
1
Cipla | 1QFY2018 Result Update
Exhibit 1: 1QFY2018 ( Consolidated) performance
1QFY2018
4QFY2017
% chg qoq
1QFY2017
% chg yoy
FY2017
FY2016
% chg yoy
Y/E March (` cr)
Net sales
3,432
3,487
(1.6)
3,556
(3.5)
14,281
13,494
5.8
Other income
244.1
117.8
107.3
119.1
105.0
578.1
504.1
14.7
Total income
3,676
3,605
2.0
3,675
0.0
14,859
13,998
6.1
Gross profit
2256
2172
3.9
2186
3.2
8964
8404
6.7
Gross margin
65.7
62.3
61.5
62.8
62.3
Operating profit
554
411
34.7
517
7.1
2126
2184
(2.6)
OPM (%)
16.1
11.8
14.5
14.9
16.2
Interest
27.9
33.4
31.5
(11.5)
159
207
(22.9)
Depreciation
213
632
(66.2)
204
4.7
1323
754
75.4
PBT
557
(137)
-
401
-
1222
1727
(29.2)
Provision for taxation
131
(76)
-
55
-
180
332
(45.8)
PAT before extra-ordinary item
426
(61)
-
346
23.2
1042
1395
(25.3)
Share of Profit /( loss ) of asso.
17
1
7
36
35
Extra-ordinary items/(income)
0
0
0
0
PAT after extra-ordinary item
409
(62)
-
339
20.6
1006
1360
(26.0)
Adj. PAT
409
212
93.1
339
20.6
1006
1360
(26.0)
EPS (`)
5.1
2.6
4.2
12.5
16.9
Source: Company, Angel Research
Exhibit 2: 1QFY2018 - Actual vs. Angel estimates
(` cr)
Actual
Estimates
Variance
Net sales
3,432
3,789
(9.4)
Other income
244
119
104.9
Operating profit
554
588
(5.9)
Tax
131
66
97.7
Net profit
409
346
18.1
Source: Company, Angel Research
Top-line growth lower than expectation
Sales came in at `3,432cr (`3,789cr expected) v/s. `3,500cr in 1QFY2017, a yoy
de-growth of 1.9%, mainly driven by the dip in Indian formulation sales. Indian
formulation sales registered (`1,271cr) a yoy dip of 12.9%, mainly on the back of
GST implementation. The company expects domestic business to grow at low-to-
mid-teens in coming quarters. Exports (`2255cr) posted a yoy growth of 9.9%.
USA (US$100mn) posted a yoy growth of 2% in $ terms. Cipla is now one of the
fastest growing generics players in the US, strong DTM performance i.e. 9 of the
48 (19%) in IMS are in the leadership (no 1) position, while 28 of 48 (58%)
products ranked among Top 3 in their segments. 3 ANDAs have been filed, during
the quarter, with 25 expected to be filed in FY2018. In terms of the launches, the
company launched 4 new products, addressing a total market size of US$ 390mn;
10+ launches planned for the remaining 9 months. As on July 30, 2017, the
company had 238 ANDA’s with 142 ANDA’s approved.
South Africa (SA) (ZAR998mn) registered a growth of ~10% over the last year.
Strong growth in private market; As per IMS MAT (Jun’2017), Cipla grew at
August 18, 2017
2
Cipla | 1QFY2018 Result Update
10.3% in the private market v/s. 9.2% market growth. Cipla maintained its
overall ranking in SA as the 4th largest pharmaceutical company; including
the tender business, Cipla is the 3rd largest pharmaceuticals company in SA.
Emerging market sales (US$113mn) posted a flat growth.
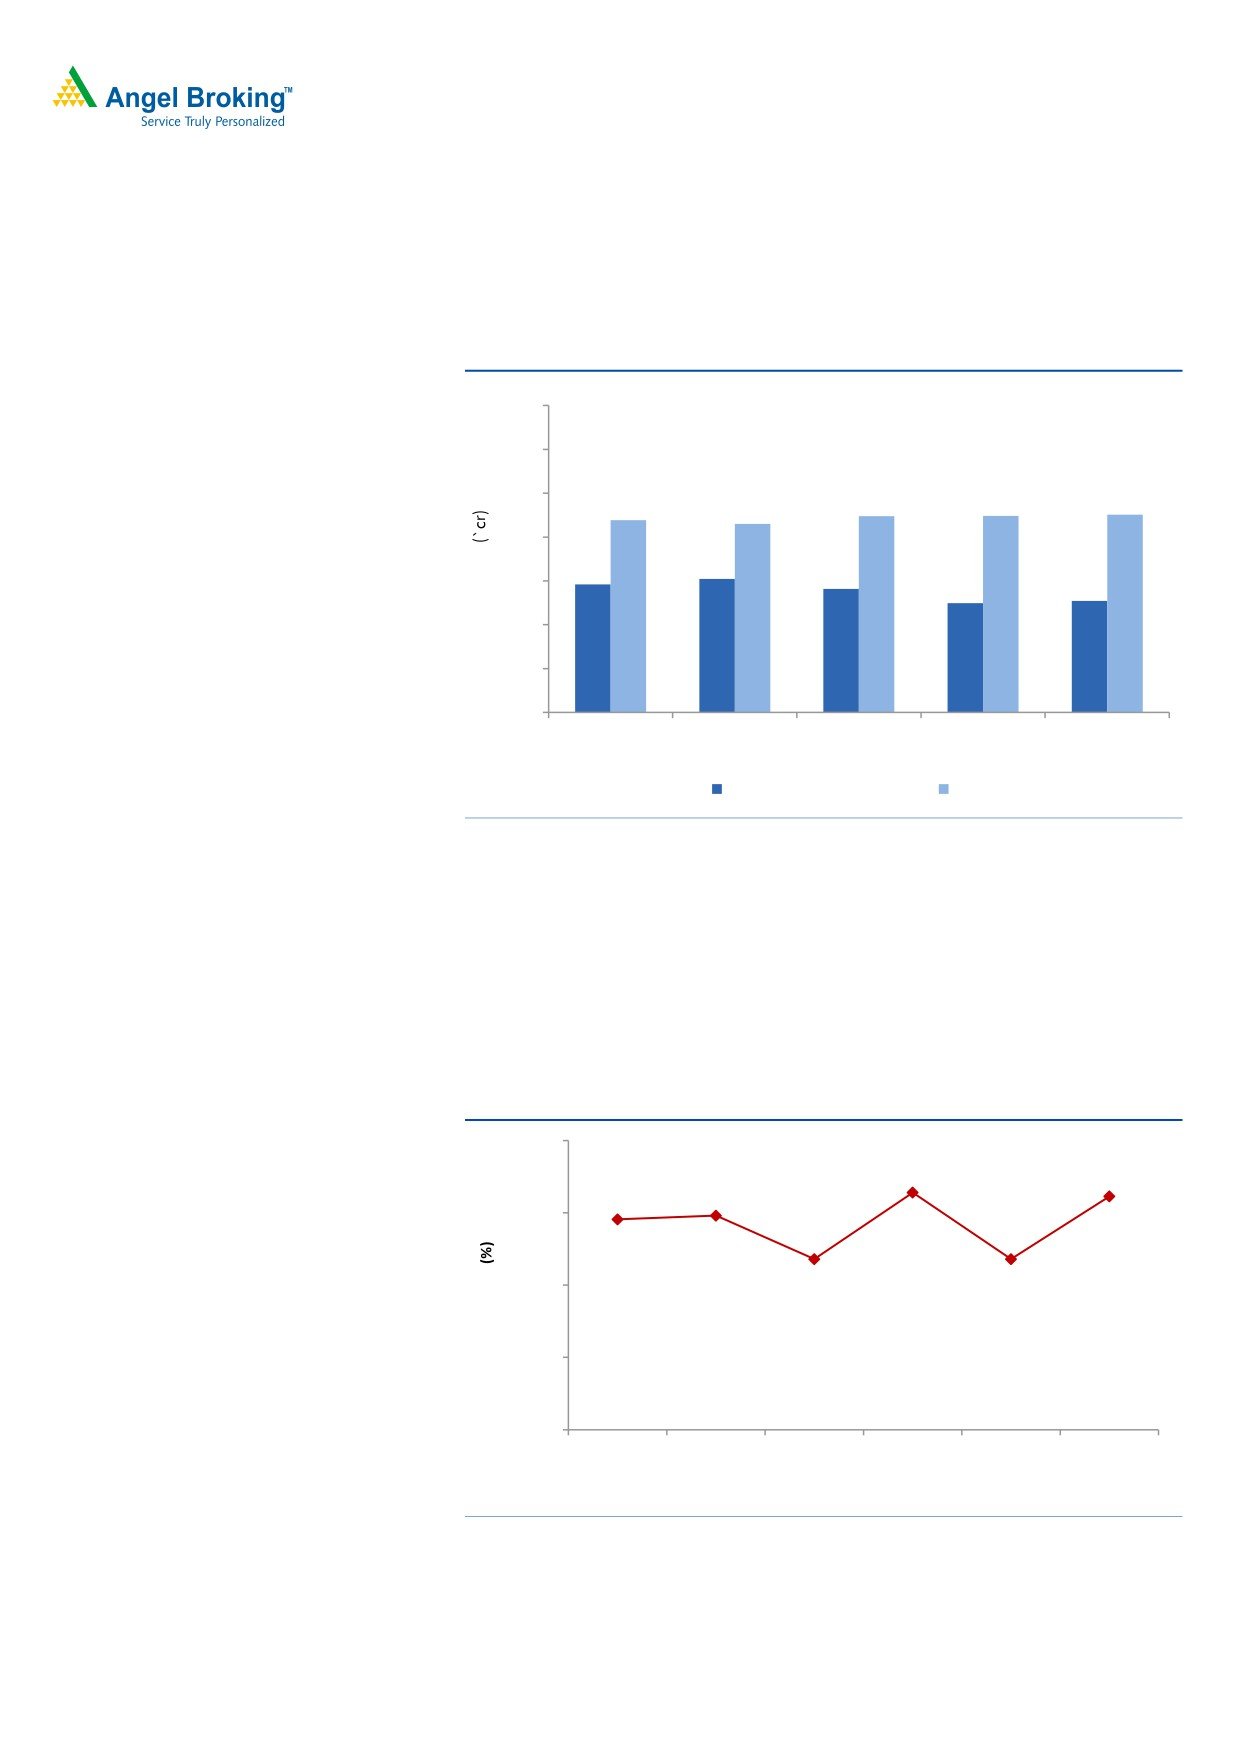
Exhibit 3: Sales Trend
3,500
3,000
2,500
2240
2254
2191
2150
2239
2,000
1459
1522
1408
1,500
1247
1271
1,000
500
0
1QFY2017 2QFY2017 3QFY2017 4QFY2017 1QFY2018
Domestic
Export
Source: Company
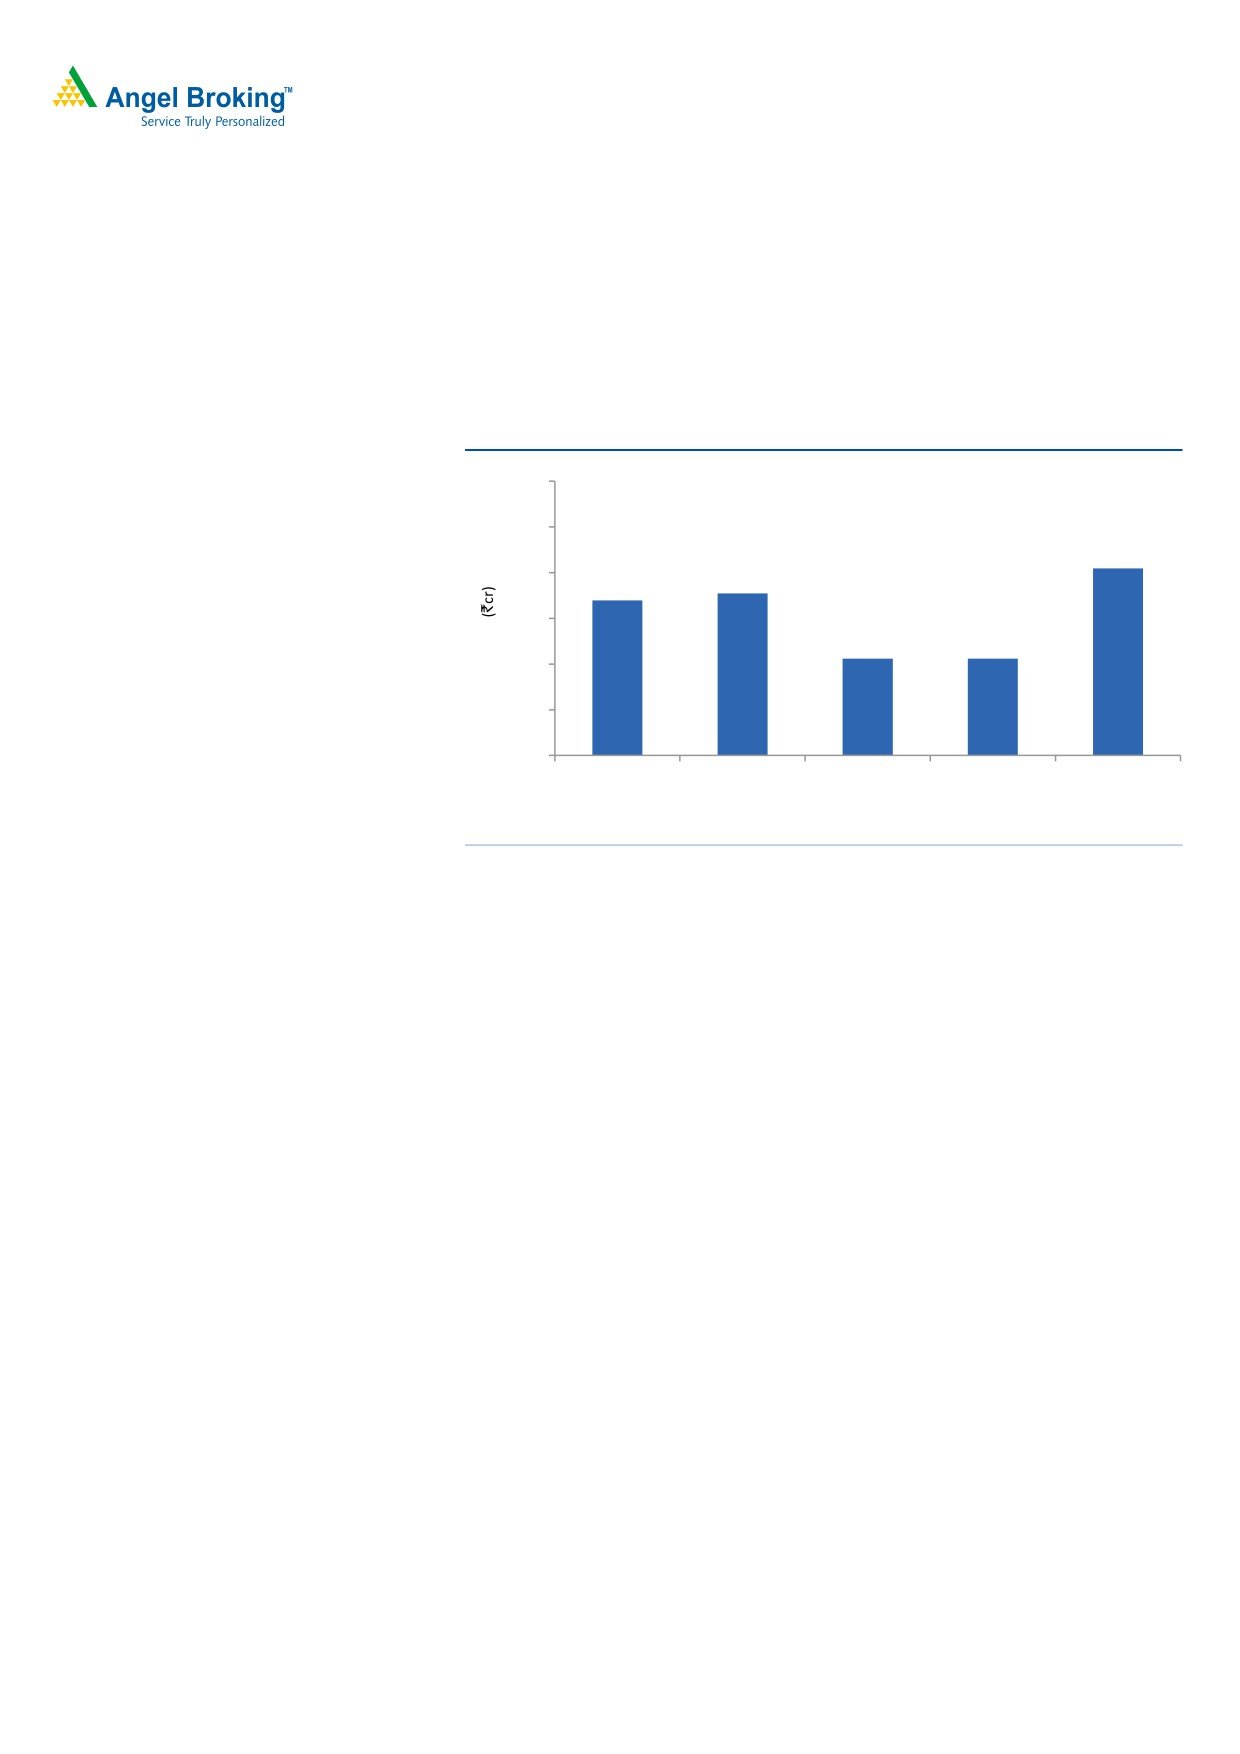
Operating profit margin better than expectation
On operating front, the EBITDA margins came in at 16.1% (15.5% expected) v/s.
14.8% in 1QFY2017, mainly on the back of lower than expected sales during the
quarter and an 11.2% rise in the other expenses. Gross margins came in at 65.7%
v/s. 60.8% in 1QFY2017. Total R&D investments for this quarter were at 6.0% of
revenues.
Exhibit 4: OPM Trend
20.0
16.4
16.1
14.5
15.0
11.8
14.8
10.0
11.8
5.0
0.0
4QFY2016 1QFY2017 2QFY2017 3QFY2017 4QFY2017 1QFY2018
Source: Company
August 18, 2017
3
Cipla | 1QFY2018 Result Update
Net profit better than expectation; aided by other income
Thus, the PAT came in at ` 409cr (`346cr expected) v/s. `339cr in 1QFY2017, a
yoy growth of 20.6%. This was also aided by the other income during the quarter,
which came in at `244.1cr v/s. `119.1cr during the last corresponding period.
Exhibit 5: Net Profit Trend
600
500
409
354
400
339
300
212
212
200
100
0
1QFY2017 2QFY2017 3QFY2017 4QFY2017 1QFY2018
Source: Company
Concall takeaways
R&D is expected to remain at 8% in FY2018E, and not more than 9% in
coming years.
Pricing pressure in US stood at high-single-digit to low-double-digit.
Capex expected to be around `700-800cr in FY2018.
In USA, the company expects to file 20-25 ANDAs in FY2018.
EBITDA margin guidance maintained at mid-to-high teens for FY2018.
Recommendation rationale
Export segment to be the growth driver: Cipla exports to more than 180 countries,
with growth coming through marketing alliances and distribution tie-ups in various
markets. Exports contributed 60% to the total turnover in FY2017, with Africa, US
and Latin America constituting more than ~60% of total exports. In the US, Cipla
has a strong product pipeline of 238 ANDAs, out of which, 142 are approved.
Another long term growth driver for the company is the launch of the CFC-free
inhalers in the regulated markets. CFC-free inhalers in Europe and US address a
potential market size of more than US$3bn. Overall, we expect the company’s
exports to grow at a CAGR of 18.7% during FY2017-19E.
Increasing penetration in the domestic market: Cipla is one of the largest players
in the domestic formulation market with a market share of around 5.3%. Domestic
formulations contributed 40% to the company’s total turnover in FY2017. The
company is the market leader in key therapeutic areas such as respiratory care,
August 18, 2017
4
Cipla | 1QFY2018 Result Update
anti-viral and urological. Cipla’s distribution network in India consists of a field
force of around 7,000-8,000 employees. The company plans to increase its focus
on domestic markets with new therapies such as oncology and neuro-psychiatry in
the offing. The company plans to focus on growing its market share and sales by
increasing penetration in the Indian market, especially in rural areas, and plans to
expand its product portfolio by launching biosimilars, particularly related to
the oncology, anti-asthmatic and anti-arthritis categories. Overall, we expect
the company’s domestic formulation business to post a CAGR of 13.5% over
FY2017-19E.
Valuation: We expect the company to post a 16.7% CAGR in net sales to
`19,437cr and EPS to record a 38.7% CAGR to `24.1 over FY2017-19E. The
growth in the top-line would be driven by domestic formulation sales and exports.
We maintain our SELL stance on the stock.
Exhibit 6: Key assumptions
Key assumptions
FY2018E
FY2019E
Domestic growth (%)
13.0
15.0
Exports growth (%)
18.6
18.8
Growth in employee expenses (%)
15.0
15.0
Operating margins (excl tech. know-how fees) (%)
15.4
16.2
Source: Company, Angel Research
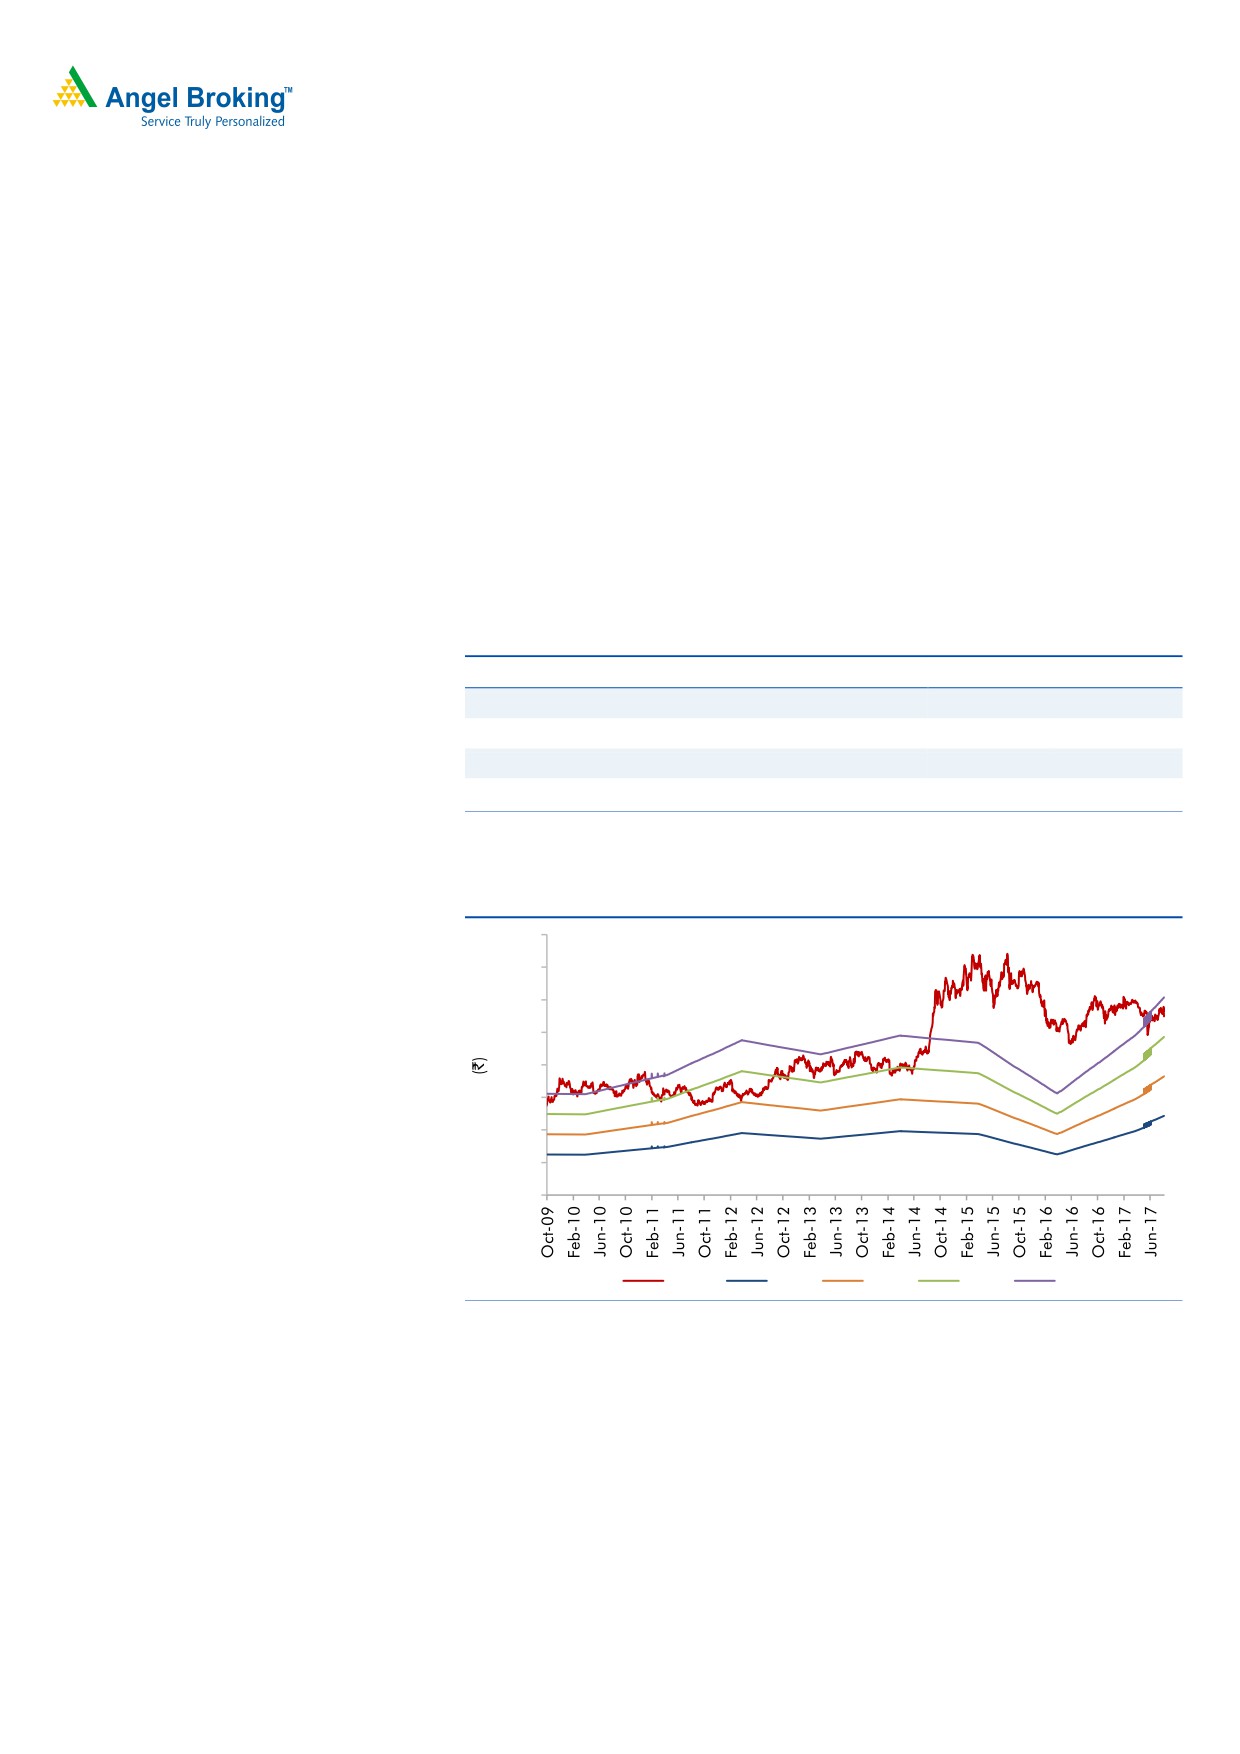
Exhibit 7: One-year forward PE band
800
700
600
500
400
300
200
100
-
Price
10x
15x
20x
25x
Source: Company, Angel Research
August 18, 2017
5
Cipla | 1QFY2018 Result Update
Exhibit 8: Recommendation Summary
Company
Reco
CMP
Tgt. price
Upside
FY2019E
FY17-19E
FY2019E
(`)
(`)
% PE (x) EV/Sales (x) EV/EBITDA (x) CAGR in EPS (%) RoCE (%) RoE (%)
Alembic Pharma
Buy
515
600
16.5
18.9
2.1
11.0
12.8
24.3
20.6
Aurobindo Pharma
Buy
714
823
15.3
13.9
2.1
9.7
14.2
25.3
22.7
Cadila Healthcare
Reduce
484
426
(11.9)
22.7
3.7
18.0
21.0
17.3
22.9
Cipla
Sell
590
458
(22.4)
24.5
2.5
15.7
38.7
10.9
13.1
Dr Reddy's
Accumulate
1,999
2,219
11.0
18.0
2.0
11.2
23.6
11.2
13.0
Dishman Pharma
Under Review
293
-
-
18.9
1.3
10.1
(7.2)
2.9
2.5
GSK Pharma
Neutral
2,365
-
-
40.4
5.4
30.3
30.6
28.9
26.5
Indoco Remedies
Sell
193
153
(20.9)
15.2
1.5
10.1
23.0
11.3
15.6
Ipca labs
Buy
420
620
47.6
16.7
1.3
8.5
27.9
12.8
11.2
Lupin
Buy
962
1,467
52.5
14.4
2.0
8.4
8.2
20.5
17.5
Sanofi India*
Reduce
4,127
3,845
(6.8)
26.8
2.8
16.5
9.2
23.9
25.8
Sun Pharma
Buy
485
558
15.0
19.6
3.2
14.4
8.0
12.3
15.2
Source: Company, Angel Research; Note: * December year ending
Company Background
Cipla is a leading pharmaceutical company in India with a strong presence in
both, the export and domestic markets. On the exports front, where it follows the
partnership model, it has 5,700 product registrations in around 180 countries.
Cipla is a market leader in the domestic formulation market with ~5.3% market
share. The company is likely to continue on the growth trajectory owing to its entry
into the inhalers market in the EU and potential new long-term manufacturing
contracts with Global Innovators.
August 18, 2017
6
Cipla | 1QFY2018 Result Update
Profit & loss statement (Consolidated)
Y/E March (` cr)
FY2014
FY2015
FY2016
FY2017
FY2018E
FY2019E
Gross sales
9,902
11,861
13,709
14,497
16,871
19,732
Less: Excise duty
149.3
179.7
215.0
216.4
251.8
294.5
Net sales
9,753
11,681
13,494
14,281
16,619
19,437
Other operating income
348
348
296
349
349
349
Total operating income
10,100
12,029
13,790
14,630
16,968
19,786
% chg
22.0
19.1
14.6
6.1
16.0
16.6
Total expenditure
7,967
9,612
11,310
12,154
14,062
16,292
Net raw materials
3,875
4,556
5,090
5,317
6,199
7,250
Other mfg costs
827
993
1,142
1,313
1,510
1,736
Personnel
1,543
2,083
2,434
2,634
3,029
3,483
Other
1,722
1,981
2,645
2,891
3,324
3,823
EBITDA
1,786
2,069
2,184
2,126
2,557
3,145
% chg
(11.0)
15.9
5.5
(2.6)
20.3
23.0
(% of Net Sales)
18.3
17.7
16.2
14.9
15.4
16.2
Depreciation & amort.
373
457
754
1,323
848
944
EBIT
1,413
1,613
1,430
803
1,709
2,201
% chg
(15.6)
14.1
(11.4)
(43.8)
112.7
28.8
(% of Net Sales)
14.5
13.8
10.6
5.6
10.3
11.3
Interest & other charges
146
85
207
159
159
159
Other Income
266
266
209
229
229
229
(% of PBT)
14.1
12.4
12.1
18.7
10.7
8.7
Recurring PBT
1,881
2,141
1,728
1,222
2,128
2,619
% chg
(9.1)
13.8
(19.3)
(29.3)
74.1
23.1
Extraordinary exp./(Inc.)
-
-
-
-
-
-
PBT (reported)
1,881
2,141
1,728
1,222
2,128
2,619
Tax
463.4
535.3
331.6
179.8
532.0
654.9
(% of PBT)
24.6
25.0
19.2
14.7
25.0
25.0
PAT (reported)
1,417
1,606
1,396
1,042
1,596
1,965
Add: Share of earnings of asso.
(12)
(12)
(12)
(7)
(10)
(9)
Less: Minority interest (MI)
16
16
23
29
18
19
Prior period items
-
-
-
-
-
-
PAT after MI (reported)
1,388
1,578
1,360
1,006
1,568
1,936
ADJ. PAT
1,388
1,578
1,360
1,006
1,568
1,936
% chg
(8.9)
13.6
(13.8)
(26.0)
55.8
23.5
(% of Net Sales)
14.2
13.5
10.1
7.0
9.4
10.0
Basic EPS (`)
17.3
19.6
16.9
12.5
19.5
24.1
Fully Diluted EPS (`)
17.3
19.6
16.9
12.5
19.5
24.1
% chg
(8.9)
13.6
(13.8)
(26.0)
55.8
23.5
August 18, 2017
7
Cipla | 1QFY2018 Result Update
Balance sheet (Consolidated)
Y/E March (` cr)
FY2014
FY2015
FY2016
FY2017
FY2018E
FY2019E
SOURCES OF FUNDS
Equity share capital
161
161
161
161
161
161
Preference Capital
-
-
-
-
-
-
Reserves & surplus
9,890
10,629
11,356
12,365
13,744
15,493
Shareholders funds
10,050
10,801
11,516
12,525
13,905
15,653
Minority interest
50
180
350
438
438
438
Total loans
1,247.9
1,701.8
5,191.4
4,112.6
4,112.6
4,112.6
Other long term liabilities
32.6
32.6
32.6
32.6
32.6
32.6
Long Term Provisions
77.4
168.4
255.6
263.5
263.5
263.5
Deferred tax liability
309.0
284.6
897.0
588.8
588.8
588.8
Total liabilities
11,767
13,169
18,243
17,961
19,341
21,089
APPLICATION OF FUNDS
Gross block
6,183
6,868
8,293
9,999
11,199
12,399
Less: acc. depreciation
2,180
2,634
3,388
4,711
5,559
6,503
Net block
4,003
4,234
4,905
5,288
5,640
5,896
Capital work-in-progress
442
442
442
442
442
442
Goodwill
2,493
2,735
6,084
5,427
5,427
5,427
Investments
709
640
757
973
973
973
Long Term Loans and Adv.
301
419
603
773
899
1,052
Current assets
5,340
7,201
8,259
7,900
9,284
11,187
Cash
175
564
871
624
808
1,274
Loans & advances
596
701
958
857
997
1,166
Others
4,569
5,936
6,429
6,419
7,479
8,747
Current liabilities
1,634
2,501
2,806
2,841
3,324
3,887
Net current assets
3,706
4,700
5,453
5,059
5,960
7,299
Mis. Exp. not written off
112
-
-
-
-
-
Total assets
11,767
13,169
18,243
17,961
19,341
21,089
August 18, 2017
8
Cipla | 1QFY2018 Result Update
Cash flow statement (Consolidated)
Y/E March (` cr)
FY2014
FY2015
FY2016
FY2017
FY2018E FY2019E
Profit before tax
1,881
2,141
2,007
1,222
2,145
2,636
Depreciation
373
457
542
1,323
831
927
(Inc)/Dec in Working Capital
(149)
(722)
(629)
(23)
(844)
(1,026)
Direct taxes paid
431
537
632
-
-
-
Cash Flow from Operations
1,673
1,339
1,287
2,522
2,132
2,537
(Inc.)/Dec.in Fixed Assets
(930)
(684)
(1,213)
(1,706)
(1,200)
(1,200)
(Inc.)/Dec. in Investments
1,824
69
(117)
(216)
-
-
Other income
-
-
-
-
-
-
Cash Flow from Investing
894
(616)
(1,330)
(1,922)
(1,200)
(1,200)
Issue of Equity
-
-
-
-
-
-
Inc./(Dec.) in loans
311
545
3,577
(1,071)
-
-
Dividend Paid (Incl. Tax)
(188)
(188)
(188)
(188)
(188)
(188)
Others
(2,658)
(692)
(3,039)
412
(564)
(687)
Cash Flow from Financing
(2,535)
(335)
350
(847)
(752)
(875)
Inc./(Dec.) in Cash
32
389
307
(247)
180
462
Opening Cash balances
143
175
564
871
624
804
Closing Cash balances
175
564
871
624
804
1,266
August 18, 2017
9
Cipla | 1QFY2018 Result Update
Key Ratio
Y/E March
FY2014
FY2015
FY2016
FY2017
FY2018E
FY2019E
Valuation Ratio (x)
P/E (on FDEPS)
34.1
30.0
34.9
47.1
30.2
24.5
P/CEPS
26.9
23.3
22.4
20.3
19.6
16.5
P/BV
4.7
4.4
4.1
3.8
3.4
3.0
Dividend yield (%)
0.3
0.3
0.3
0.3
0.3
0.3
EV/Sales
4.9
4.1
3.8
3.5
3.0
2.5
EV/EBITDA
27.0
23.3
23.5
23.7
19.6
15.7
EV / Total Assets
4.1
3.7
2.8
2.8
2.6
2.3
Per Share Data (`)
EPS (Basic)
17.3
19.6
16.9
12.5
19.5
24.1
EPS (fully diluted)
17.3
19.6
16.9
12.5
19.5
24.1
Cash EPS
21.9
25.3
26.3
29.0
30.1
35.9
DPS
2.0
2.0
2.0
2.0
2.0
2.0
Book Value
125.2
134.5
143.3
155.9
173.1
194.8
Dupont Analysis
EBIT margin
14.5
13.8
10.6
5.6
10.3
11.3
Tax retention ratio
75.4
75.0
80.8
85.3
75.0
75.0
Asset turnover (x)
0.9
1.0
0.9
0.8
0.9
1.0
ROIC (Post-tax)
10.1
10.3
7.9
4.0
7.3
8.8
Cost of Debt (Post Tax)
9.9
4.3
4.8
2.9
2.9
2.9
Leverage (x)
0.1
0.0
0.0
1.0
2.0
3.0
Operating ROE
10.1
10.3
7.9
5.2
16.1
26.3
Returns (%)
ROCE (Pre-tax)
12.8
12.9
9.1
4.4
9.2
10.9
Angel ROIC (Pre-tax)
15.3
17.8
14.1
7.2
14.2
16.5
ROE
14.6
15.1
12.2
8.4
11.9
13.1
Turnover ratios (x)
Asset Turnover (Gross Block)
1.8
1.8
1.8
1.6
1.6
1.7
Inventory / Sales (days)
95
96
100
87
88
91
Receivables (days)
60
74
58
66
67
70
Payables (days)
41
55
73
49
50
50
WC cycle (ex-cash) (days)
124
116
115
112
103
103
Solvency ratios (x)
Net debt to equity
0.1
0.1
0.4
0.3
0.2
0.2
Net debt to EBITDA
0.6
0.5
2.0
1.6
1.3
0.9
Interest Coverage (EBIT/Int.)
-
-
-
-
-
-
August 18, 2017
10
Cipla | 1QFY2018 Result Update
Research Team Tel: 022 - 39357800
DISCLAIMER
Angel Broking Private Limited (hereinafter referred to as “Angel”) is a registered Member of National Stock Exchange of India Limited,
Bombay Stock Exchange Limited and Metropolitan Stock Exchange Limited. It is also registered as a Depository Participant with CDSL
and Portfolio Manager with SEBI. It also has registration with AMFI as a Mutual Fund Distributor. Angel Broking Private Limited is a
registered entity with SEBI for Research Analyst in terms of SEBI (Research Analyst) Regulations, 2014 vide registration number
INH000000164. Angel or its associates has not been debarred/ suspended by SEBI or any other regulatory authority for accessing
/dealing in securities Market. Angel or its associates/analyst has not received any compensation / managed or co-managed public
offering of securities of the company covered by Analyst during the past twelve months.
This document is solely for the personal information of the recipient, and must not be singularly used as the basis of any investment
decision. Nothing in this document should be construed as investment or financial advice. Each recipient of this document should
make such investigations as they deem necessary to arrive at an independent evaluation of an investment in the securities of the
companies referred to in this document (including the merits and risks involved), and should consult their own advisors to determine
the merits and risks of such an investment.
Reports based on technical and derivative analysis center on studying charts of a stock's price movement, outstanding positions and
trading volume, as opposed to focusing on a company's fundamentals and, as such, may not match with a report on a company's
fundamentals. Investors are advised to refer the Fundamental and Technical Research Reports available on our website to evaluate the
contrary view, if any.
The information in this document has been printed on the basis of publicly available information, internal data and other reliable
sources believed to be true, but we do not represent that it is accurate or complete and it should not be relied on as such, as this
document is for general guidance only. Angel Broking Pvt. Limited or any of its affiliates/ group companies shall not be in any way
responsible for any loss or damage that may arise to any person from any inadvertent error in the information contained in this report.
Angel Broking Pvt. Limited has not independently verified all the information contained within this document. Accordingly, we cannot
testify, nor make any representation or warranty, express or implied, to the accuracy, contents or data contained within this document.
While Angel Broking Pvt. Limited endeavors to update on a reasonable basis the information discussed in this material, there may be
regulatory, compliance, or other reasons that prevent us from doing so.
This document is being supplied to you solely for your information, and its contents, information or data may not be reproduced,
redistributed or passed on, directly or indirectly.
Neither Angel Broking Pvt. Limited, nor its directors, employees or affiliates shall be liable for any loss or damage that may arise from
or in connection with the use of this information.
Disclosure of Interest Statement
Cipla
1. Financial interest of research analyst or Angel or his Associate or his relative
No
2. Ownership of 1% or more of the stock by research analyst or Angel or associates or relatives
No
3. Served as an officer, director or employee of the company covered under Research
No
4. Broking relationship with company covered under Research
No
Ratings (Based on expected returns
Buy (> 15%)
Accumulate (5% to 15%)
Neutral (-5 to 5%)
over 12 months investment period):
Reduce (-5% to -15%)
Sell (< -15)
August 18, 2017
11