4QFY2017 Result Update | Pharmaceutical
June 2, 2017
Aurobindo Pharma
BUY
CMP
`580
Performance Highlights
Target Price
`823
Y/E march (` cr)
4QFY17
3QFY17
% chg (QoQ)
4QFY16
% chg (yoy)
Investment Period
12 months
Net sales
3582
3844
(6.8)
3674
(2.5)
Other income
102
70
46.4
108
(6.0)
Stock Info
Operating profit
662
833
(20.6)
794
(16.7)
Sector
Pharmaceutical
Interest
14
(2)
-
25
-
Market Cap (` cr)
33,981
Adj. Net profit
532
579
(8.0)
555
(4.0)
Net debt (` cr)
2,593
Source: Company, Angel Research
Beta
1.1
For 4QFY2017, Aurobindo Pharma (APL) posted numbers which were lower than
52 Week High / Low
895/504
expectations on sales, OPM & net profit fronts. On sales front, the company
Avg. Daily Volume
1,01,877
posted sales of `3,582cr (v/s. `4,460cr expected) v/s. `3,674cr in 4QFY2016,
Face Value (`)
1
posting a yoy de-growth of 2.5%. On the operating front, the EBITDA margin
BSE Sensex
31,138
came in at 18.5% (v/s. 23.4% expected) v/s. 21.6% in 4QFY2016. Consequently,
Nifty
9,616
the Adj. PAT came in at `532cr (v/s. `754cr expected) v/s. `555cr in 4QFY2016,
Reuters Code
ARBN.BO
a yoy de-growth of 4.0%. We maintain our Buy rating on the stock, on the back
Bloomberg Code
ARBP@IN
of attractive valuations.
Results much lower than expectation: On sales front, the company posted sales
Shareholding Pattern (%)
of `3,582cr (v/s. `4,460cr expected) v/s. `3,674cr in 4QFY2016, posting a yoy
Promoters
51.9
de-growth of 2.5%. The formulation sales (`2,879cr) posted a yoy de-growth of
MF / Banks / Indian Fls
16.0
2.9%, while API (`762.8cr) posted a yoy de-growth of 1.5%. On the operating
FII / NRIs / OCBs
24.7
front, the EBITDA margin came in at 18.5% (v/s. 23.4% expected) v/s. 21.6% in
Indian Public / Others
10.7
4QFY2016. While the gross margins came in at 58.0% v/s 55.7% in 4QFY2016,
but a 13.9% and 12.6% rise in the employee and other expenses respectively,
lead to the margin contraction. Consequently, the Adj. PAT came in at `532cr
Abs. (%)
3m 1yr
3yr
(v/s. `754cr expected) v/s. `555cr in 4QFY2016, a yoy de-growth of 4.0%.
Sensex
7.4
16.6
26.1
Outlook and valuation: We estimate the company’s net sales to log a CAGR of
Aurobindo
(14.6)
(26.5)
81.4
14.5% over FY2017-19E to `19,478cr on the back of US formulations, which
will be supplemented through its acquisitions of the Western European
formulation businesses of Actavis and US’ Natrol. We recommend a Buy rating
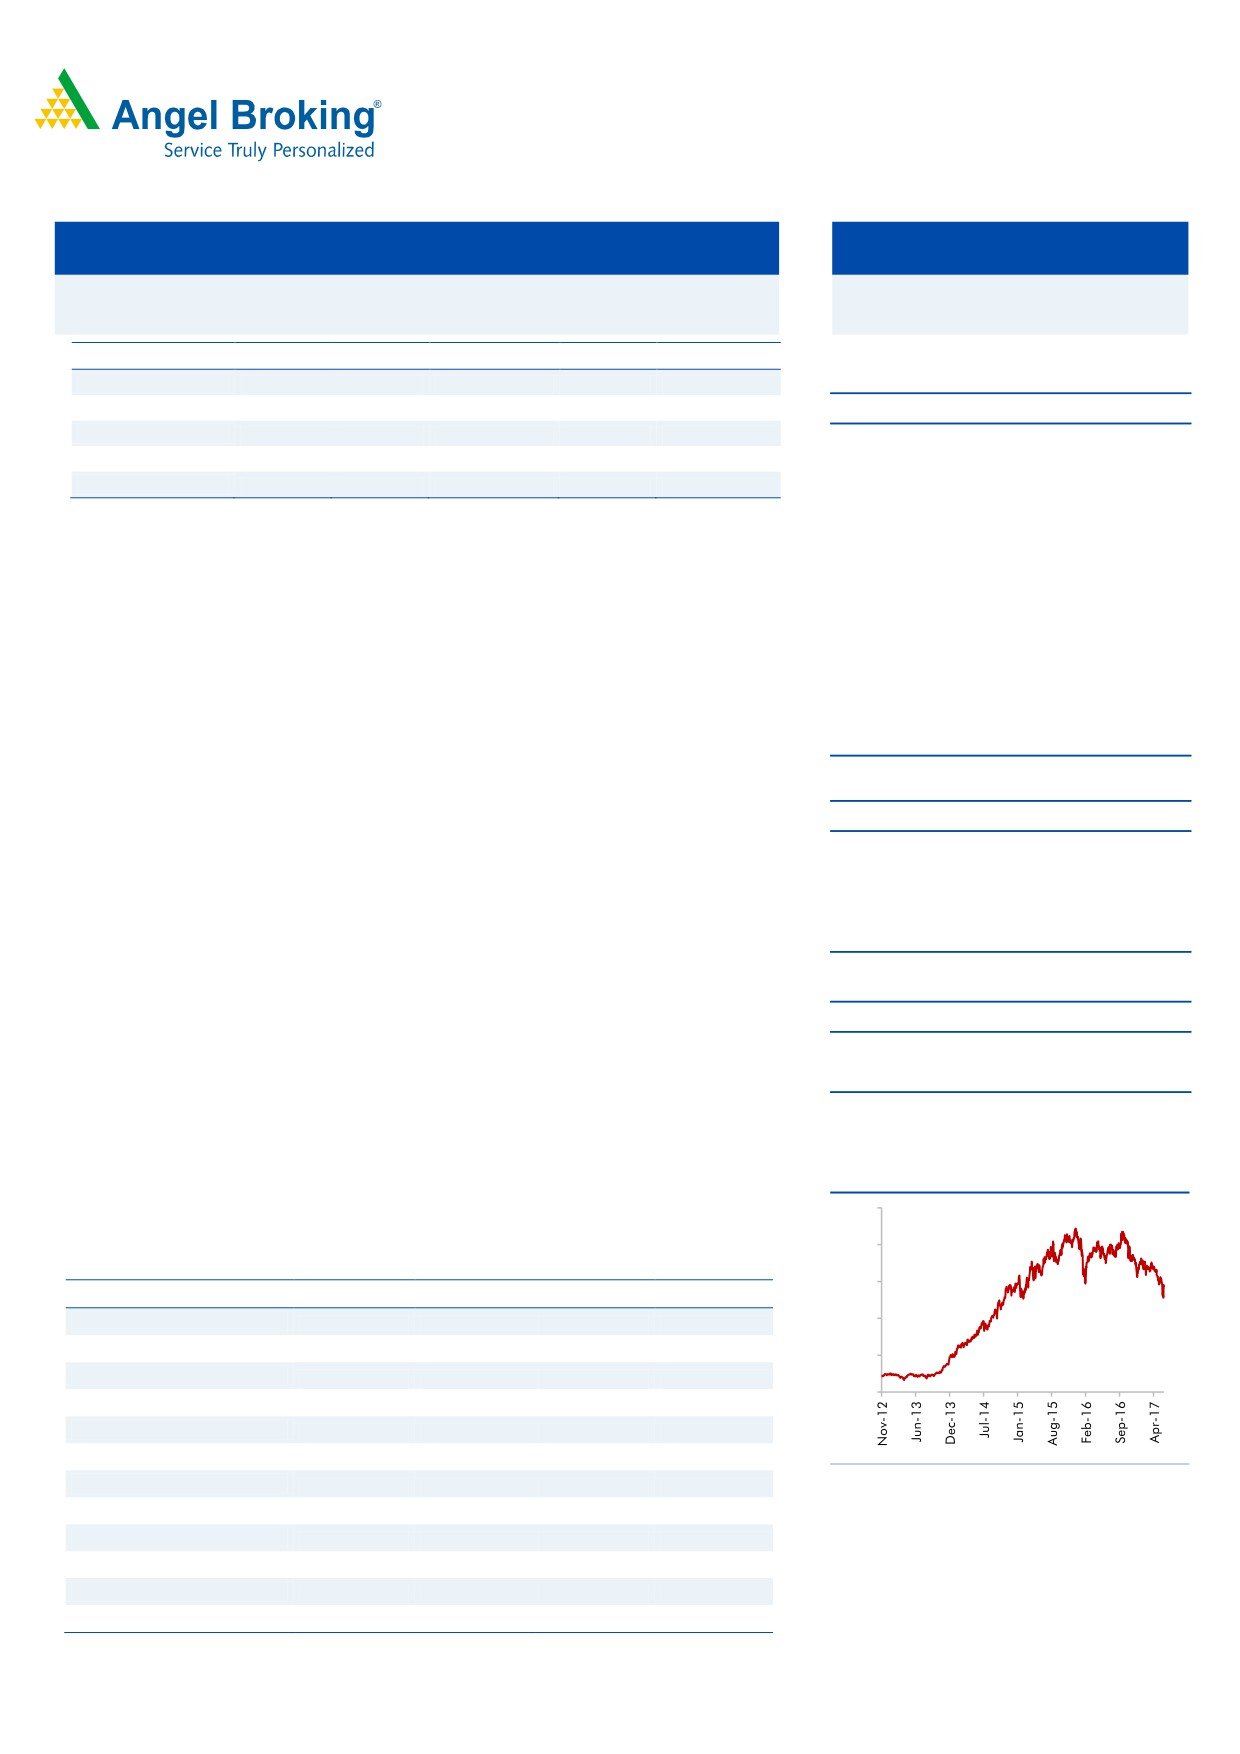
3-year daily price chart
with a target price of `823.
1,000
800
Key financials (Consolidated)
600
Y/E March (` cr)
FY2016
FY2017
FY2018E
FY2019E
400
Net sales
13,651
14,845
17,086
19,478
% chg
13.3
8.7
15.1
14.0
200
Adj. Net profit
1,982
2,302
2,611
3,004
0
% chg
22.4
16.1
13.5
15.0
EPS (`)
33.9
39.4
44.7
51.4
EBITDA margin (%)
21.7
21.5
22.1
22.0
Source: Company, Angel Research
P/E (x)
16.9
14.6
12.8
11.2
RoE (%)
31.9
27.6
24.7
22.7
RoCE (%)
24.7
23.1
24.3
25.3
P/BV (x)
4.6
3.6
2.8
2.3
EV/Sales (x)
Sarabjit Kour Nangra
2.7
2.4
2.1
1.7
EV/EBITDA (x)
+91 22 3935 7800 Ext: 6806
12.6
11.3
9.4
7.8
Source: Company, Angel Research; Note: CMP as of June 2, 2017
Please refer to important disclosures at the end of this report
1
Aurobindo Pharma | 4QFY2017 Result Update
Exhibit 1: 4QFY2017 performance (Consolidated)
% chg
Y/E March (` cr)
4QFY2017
3QFY2017
4QFY2016
% chg (YoY)
FY2017
FY2016
% chg (YoY)
(QoQ)
Net sales
3,582
3,844
(6.8)
3,674
(2.5)
14,845
13,710
8.3
Other income
102
70
46.4
108
(6.0)
366
451
(18.8)
Total income
3,684
3,914
(5.9)
3,782
(2.6)
15,211
14,160
7.4
Gross profit
2,079
2,135
(2.6)
2,048
1.5
8,411
7,548
11.4
Gross margins
58.0
55.5
55.7
56.7
55.1
Operating profit
662
833
(20.6)
794
(16.7)
3,189
2,779
14.8
OPM (%)
18.5
21.7
(14.8)
21.6
21.5
20.3
Interest
14
(2)
-
25
(43.1)
67
93
(28.0)
Dep & amortisation
100
111
(10.0)
111
(10.1)
428
392
9.0
PBT
649
793
(18.1)
766
(15.2)
3,061
2,744
11.5
Provision for taxation
117
218
(46.2)
206
(43.2)
760
721
5.4
Net profit
532
575
(7.5)
555
(4.0)
2,301
2,024
13.7
Less : Exceptional items (gains)/loss
-
-
-
-
-
-
MI & share in associates
(0)
3
0
(0)
(2)
-
PAT after Exceptional items
532
579
(8.0)
555
(4.0)
2,301
2,025
13.7
Adjusted PAT
532
579
(8.0)
555
(4.0)
2,301
2,025
13.7
EPS (`)
9.1
9.9
9.5
39.3
34.7
Source: Company, Angel Research
Exhibit 2: Actual v/s Estimate
(` cr)
Actual
Estimate
Variation %
Net sales
3582
4460
(19.7)
Other operating income
102
93
10.1
Operating profit
662
1045
(36.7)
Tax
117
256
(54.3)
Adj. Net profit
532
754
(29.4)
Source: Company, Angel Research
Revenue down 2.5% yoy; lower than our expectation: On sales front, the company
posted sales of `3,582cr (v/s. `4,460cr expected) v/s. `3,674cr in 4QFY2016, a
yoy de-growth of 2.5%. The formulation sales (`2,879.4cr) posted a yoy de-growth
of 2.9%, while API (`762.8cr) posted a yoy de-growth of 1.5%. The US business,
which contributed 45% to the gross sales, witnessed a flat growth.
In the formulation segment, the US (`1,643cr) posted a yoy flat growth of 0.6%,
while Europe (`777cr) & ROW (`197cr) posted a yoy de-growth of 7.6% and
growth of 20.9% respectively. ARV (`262cr) posted a yoy de-growth of 20.2%.
Overall, formulations now contribute around 80% of sales, while the balance is
accounted by APIs. The company has 314 approved ANDAs including 38 tentative
approvals.
During 4QFY2017, the company filed 8 ANDAs with the USFDA, i.e. 5 in the oral
category and 3 in the injectable category. The company received 16 ANDA
approvals from the USFDA including 14 final approvals and 2 tentative approvals
during the quarter.
June 2, 2017
2
Aurobindo Pharma | 4QFY2017 Result Update
As on 31st March, 2017, on a cumulative basis, the company filed 429 ANDAs
with USFDA and received approvals for 314 ANDAs including 38 tentative
approvals.
Exhibit 3: Sales break-up (Consolidated)
(` cr)
4QFY2017
3QFY2017
% chg (qoq)
4QFY2016
% chg (yoy)
FY2017
FY2016
% chg
Formulations
2,879
3,130
(8.0)
2,966
(2.9)
12,045
11,064
8.9
US
1643
1745
(5.8)
1634
0.6
6827
6079
12.3
Europe & ROW
974
1043
(6.6)
1004
(2.9)
4033
3777
6.8
ARV
262
342
(23.4)
328
(20.2)
1185
1209
(2.0)
API
763
776
(1.7)
775
(1.5)
3,042
2,893
5.2
SSP
512
525
(2.5)
502
2.0
2043
1866
9.5
Cephs
251
251
(0.1)
273
(8.1)
999
1027
(2.8)
Total
3,642
3,906
(6.8)
3,741
(2.6)
15,087
13,957
8.1
Source: Company, Angel Research
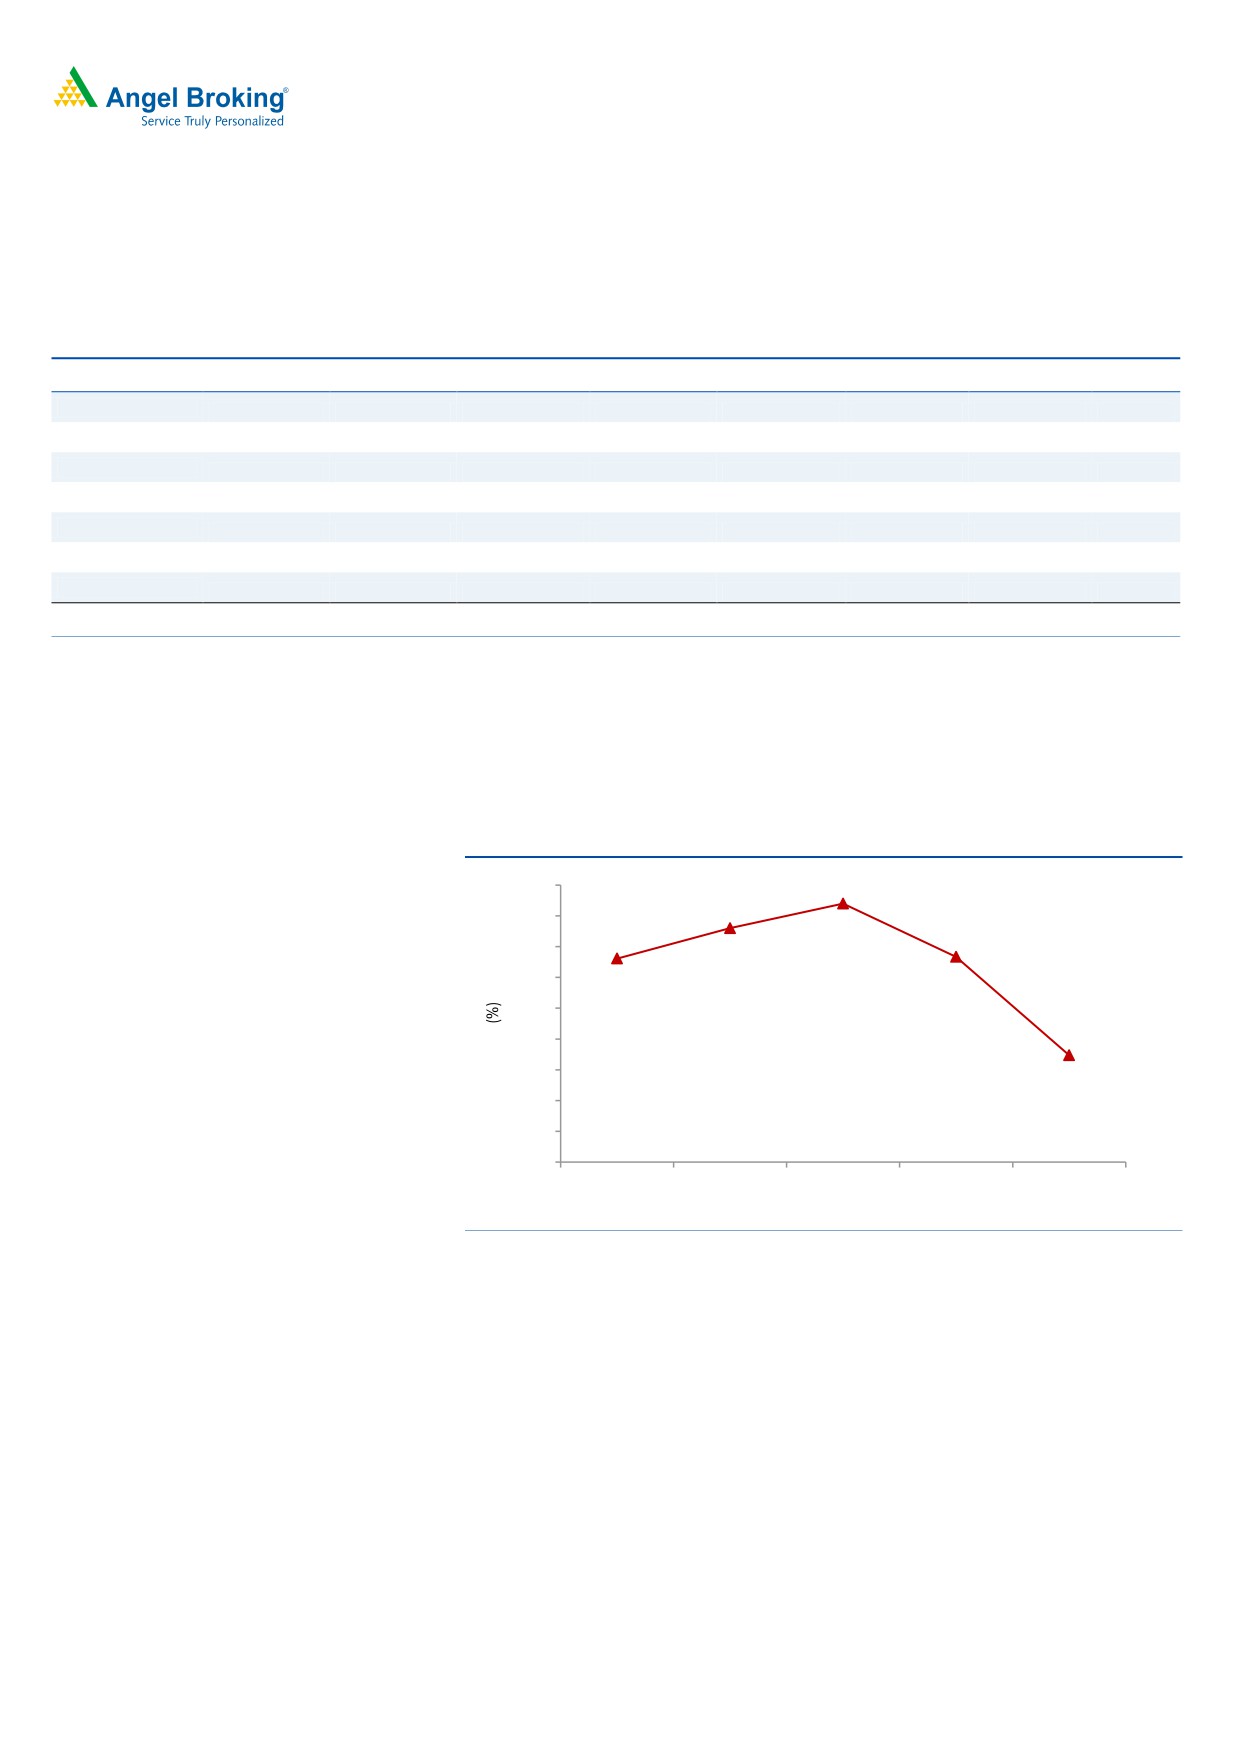
OPM comes in at 18.5%: On the operating front, the EBITDA margin came in at
18.5% (v/s. 23.4% expected) v/s. 21.6% in 4QFY2016. While the gross margins
came in at 58.0% v/s. 55.7% in 4QFY2016, but a 13.9% and 12.6% rise in the
employee and other expenses respectively, lead to the margin contraction.
Exhibit 4: OPM Trend
24.0
23.0
23.4
21.7
22.0
21.6
22.6
21.0
20.0
19.0
18.5
18.0
17.0
16.0
15.0
4QFY2016 1QFY2017 2QFY2017 3QFY2017 4QFY2017
Source: Company, Angel Research
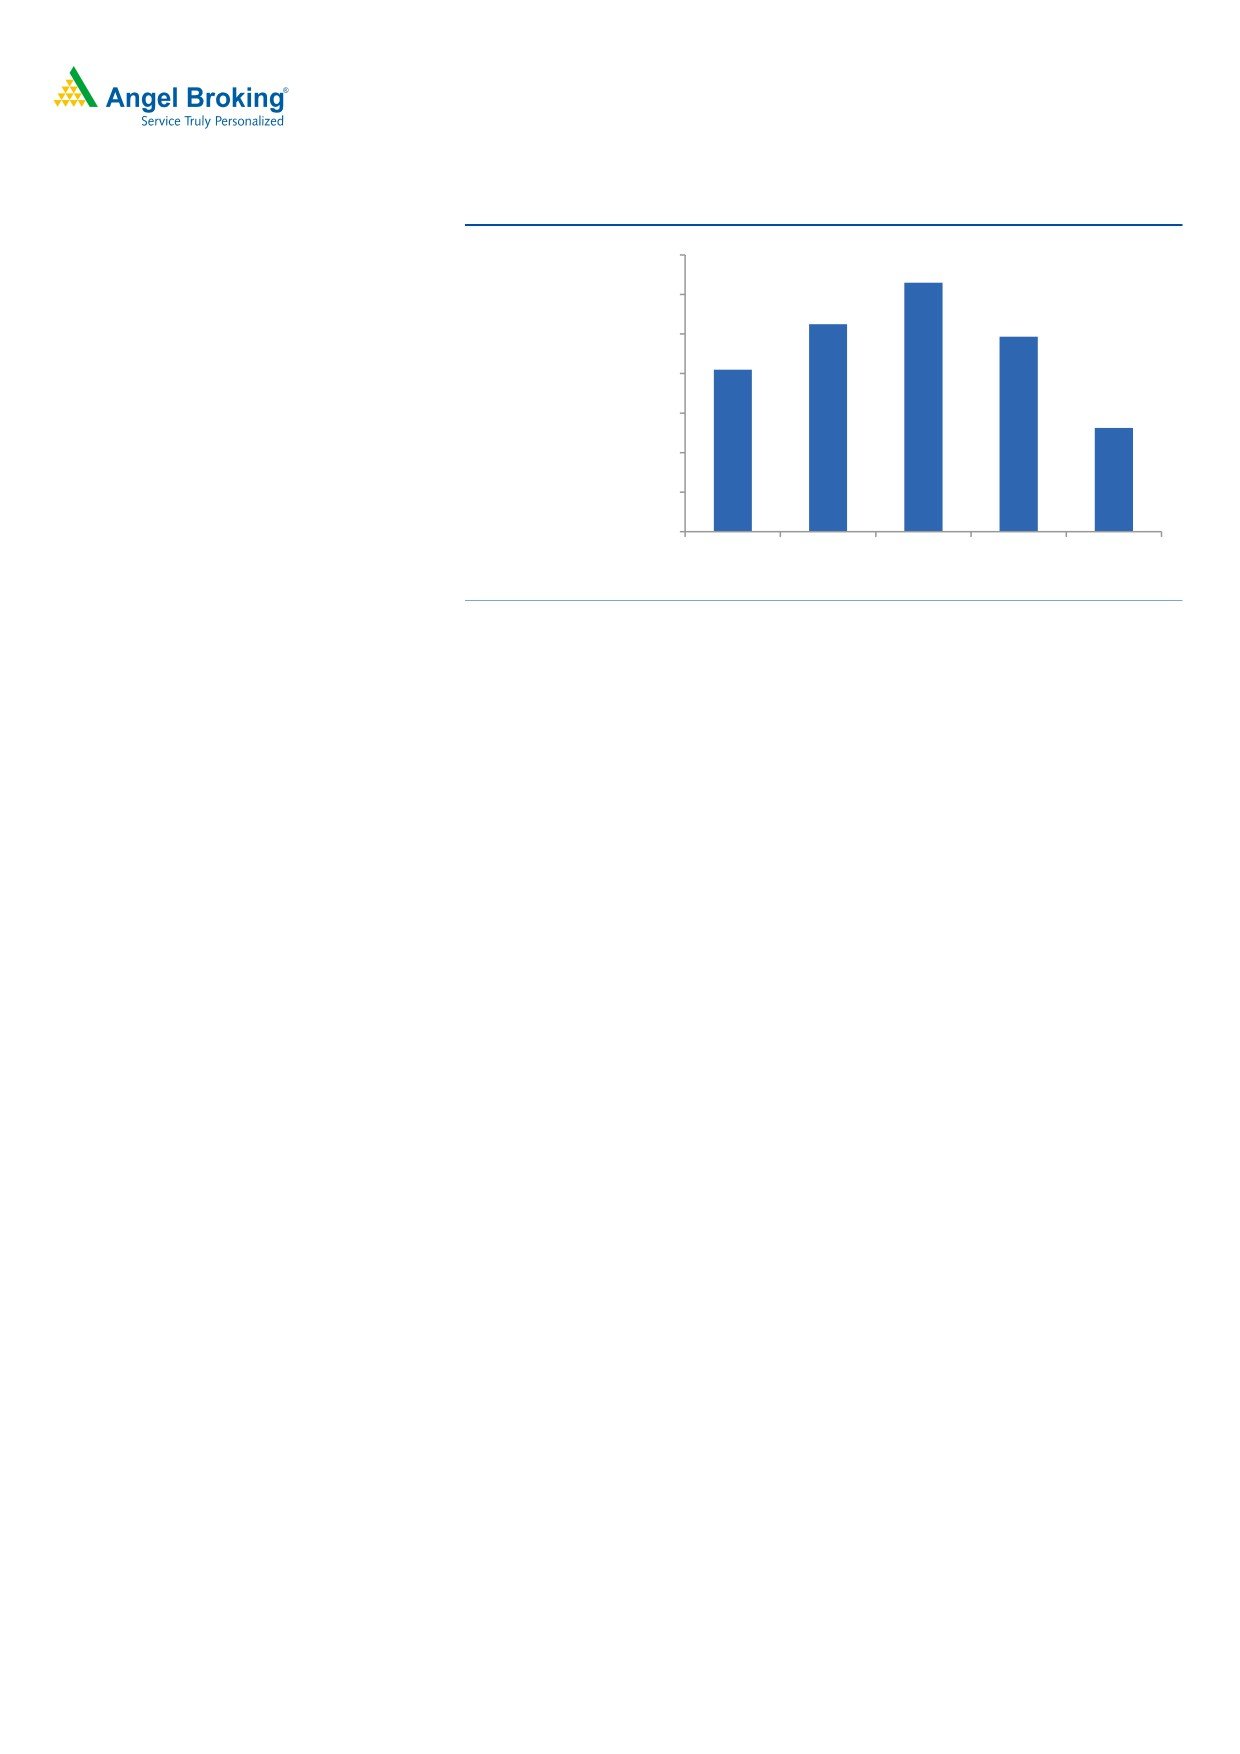
Net profit lower than estimate: Consequently, the Adj. PAT came in at `532cr (v/s.
`754cr expected) v/s. `560cr in 4QFY2016, a yoy de-growth of 4.9%. The lower
than estimated net profit growth was aided by lower than expected OPM.
June 2, 2017
3
Aurobindo Pharma | 4QFY2017 Result Update
Exhibit 5: Adj. net profit
620
606
600
585
579
580
562
560
(`cr)
540
532
520
500
480
4QFY2016 1QFY2017 2QFY2017 3QFY2017 4QFY2017
Source: Company, Angel Research
Management takeaways
At the end of 4QFY2017, the company had filed 429 ANDAs, with 314 final
approvals, and 38 tentative approvals.
Single-digit price erosion expected in the US in FY2018.
R&D as % of sales to be 4-5% in FY2018/FY2019.
Naidupet plant inspection over with zero 483s.
Capex guidance of US$120mn in FY2018.
Guided for improvement in EBITDA margin in FY2018.
Recommendation rationale
US and ARV formulation segments - the key drivers for base business: APL’s
business will primarily be driven by the US and ARV segments on the
formulation front. The company has been an aggressive filer in the US market
with 429 ANDAs filed until 4QFY2017. Amongst peers, APL has emerged as
one of the top ANDA filers. The company has aggressively filed ANDAs in the
last few years and is now geared to reap benefits, even though most of the
filings are for highly competitive products. Going ahead, with US$70bn going
off-patent in the US over the next three years, we believe APL is well placed to
tap this opportunity and is one of the largest generic suppliers. The company
enjoys high market share, as it is fully integrated in all its products apart from
having a larger product basket. Also, the company plans to launch
18
injectables in the next 2 years, which would drive its growth and profitability.
Going forward, the US business of the company is expected to post a CAGR of
14% over FY2017-19E.
Acquisitions to augment growth and improve sales mix: APL announced the
signing of a binding offer to acquire commercial operations in seven Western
European countries from Actavis. The net sales from the acquired businesses
were around EUR320mn in 2013 with a growth rate of over 10% yoy. With
this, the European sales of the company would now be ~EUR400mn.
Although these businesses are currently loss-making (by around EUR20mn),
June 2, 2017
4
Aurobindo Pharma | 4QFY2017 Result Update
APL expects them to return to profitability in combination with its vertically
integrated platform and existing commercial infrastructure.
The acquisition will make APL one of the leading Indian pharmaceutical
companies in Europe with a position in the top 10 in several key markets,
which it plans to leverage to supply or widen its product portfolio through
introduction of its own products, especially high margin products like
injectiables.
Also, in December 2014, Aurobindo USA, spent US$132.5mn to acquire the
assets of Natrol with an agreement to take on certain liabilities. With this
acquisition, the company gets an entry into the nutraceutical markets.
Aurobindo USA believes that Natrol is an excellent strategic fit and provides
the right platform for creating a fully-integrated OTC platform in the USA and
in other international markets. Natrol, which manufactures and sells nutritional
supplements in USA and other international markets, provides Aurobindo
with-strong brand reputation and presence in a variety of attractive
supplement markets. Natrol has a proven performance in the mass market,
health food and specialty channels, and has existing long term relationships
with key distribution and retail partners. It addresses a broad range of
consumers and has an effective growth strategy to expand market penetration.
Outlook and valuation
We estimate the company’s net sales to log a CAGR of 15.1% over FY2016-18E to
`19,478cr on the back of US, which accounts for the largest portion of its product
pipeline. This, along with the recent acquisitions of the Western European
formulation businesses of Actavis and US’ Natrol, has lead APL to become a
~ 80% of sales being accounted by formulations. We maintain our Buy rating on
the stock.
Exhibit 6: Key assumptions
FY2018E
FY2019E
Sales Growth (%)
15.1
14.0
Operating Margins (%)
22.1
22.0
Capex (`cr)
500
500
Source: Company, Angel Research
June 2, 2017
5
Aurobindo Pharma | 4QFY2017 Result Update
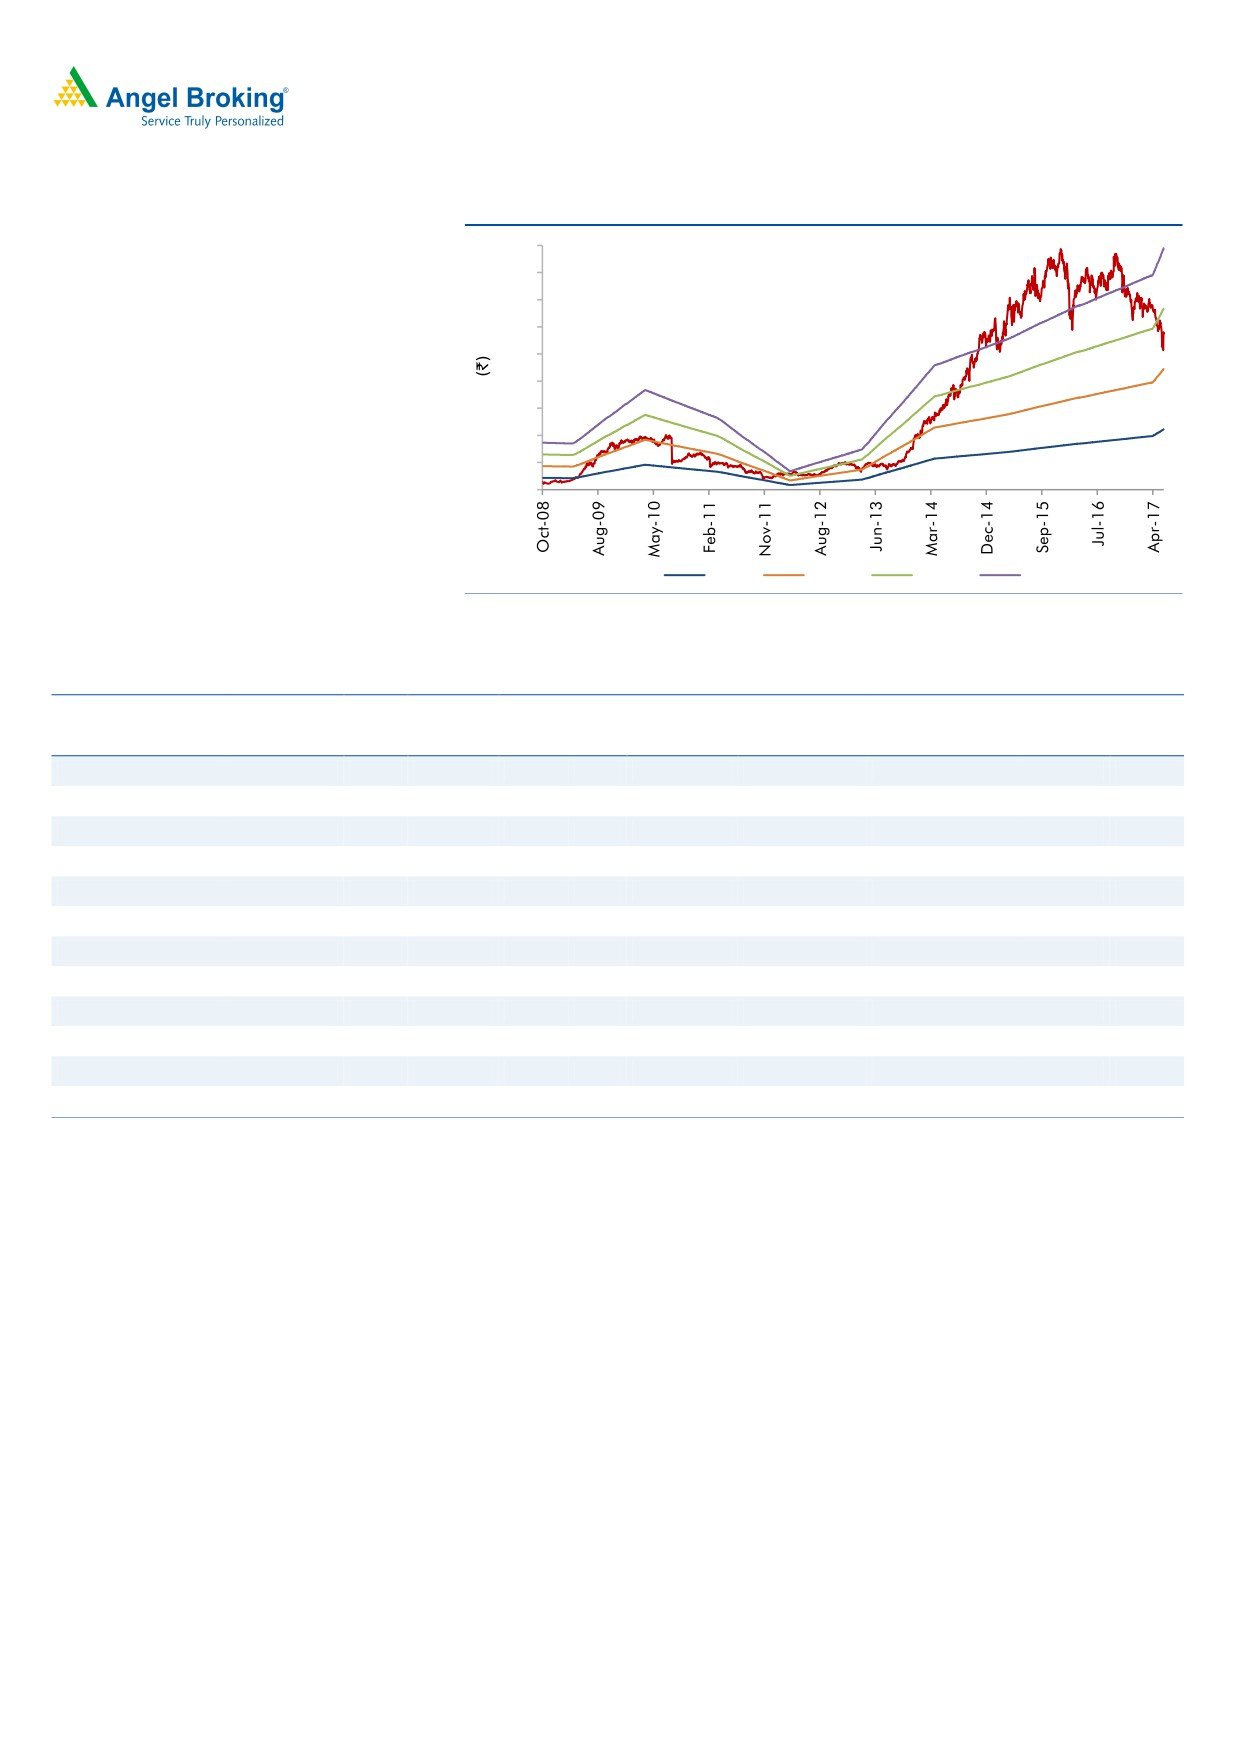
Exhibit 7: One-year forward PE
900
800
700
600
500
400
300
200
100
0
5x
10x
15x
20x
Source: Company, Angel Research
Exhibit 8: Recommendation summary
Company
Reco
CMP
Tgt. price
Upside
FY2018E
FY16-18E
FY2018E
(`)
(`)
% PE (x) EV/Sales (x) EV/EBITDA (x) CAGR in EPS (%) RoCE (%) RoE (%)
Alembic Pharma
Neutral
532
648
21.7
20.9
2.4
11.5
(10.8)
27.5
25.3
Aurobindo Pharma
Buy
580
823
41.9
13.0
2.1
9.5
14.8
24.3
24.7
Cadila Healthcare
Neutral
471
-
-
24.5
3.8
17.8
13.5
23.6
27.1
Cipla
Reduce
515
465
(9.7)
21.0
2.4
14.2
14.2
12.2
13.9
Dr Reddy's
Neutral
2,520
-
-
23.8
2.8
15.2
(13.7)
10.8
13.6
Dishman Pharma
Under Review
301
-
-
26.6
2.8
12.7
16.3
13.0
13.5
GSK Pharma*
Neutral
2,460
-
-
49.6
6.2
38.4
6.0
22.3
21.3
Indoco Remedies
Buy
193
240
24.4
12.0
1.4
7.8
33.2
19.1
20.1
Ipca labs
Buy
510
613
20.2
26.6
1.8
11.9
34.8
8.6
9.5
Lupin
Buy
1,150
1,809
57.3
16.6
2.7
10.2
17.2
24.4
20.9
Sanofi India
Neutral
4,111
-
-
29.4
3.4
20.1
16.8
22.5
26.4
Sun Pharma
Buy
509
847
66.6
14.4
2.9
8.8
26.5
18.9
20.1
Source: Company, Angel Research; Note: *December year ending
June 2, 2017
6
Aurobindo Pharma | 4QFY2017 Result Update
Company background
Aurobindo Pharma manufactures generic pharmaceuticals and APIs. The
company’s manufacturing facilities are approved by several leading regulatory
agencies like the USFDA, UK MHRA, WHO, Health Canada, MCC South Africa
and ANVISA Brazil among others. The company’s robust product portfolio is
spread over six major therapeutic/product areas encompassing antibiotics,
antiretrovirals, CVS, CNS, gastroenterological, and anti-allergics. The company
has acquired the generic business of Actavis, which has made it a US$2bn
company and a leading company in Europe. With this acquisition, formulations
now contribute around 80% to the company’s sales (as in FY2017).
June 2, 2017
7
Aurobindo Pharma | 4QFY2017 Result Update
Profit & loss statement (Consolidated)
Y/E March (` cr)
FY2014
FY2015
FY2016
FY2017
FY2018E FY2019E
Gross sales
8,198
12,221
13,878
15,084
17,346
19,775
Less: Excise duty
159
178
227
239
260
297
Net Sales
8,038
12,043
13,651
14,845
17,086
19,478
Other operating income
61
77
245
245
245
245
Total operating income
8,100
12,121
13,896
15,090
17,331
19,723
% chg
38.3
49.6
14.6
8.6
14.9
13.8
Total Expenditure
5,968
9,557
10,691
11,656
13,310
15,193
Net Raw Materials
3,606
5,506
6,158
6,434
7,005
7,986
Other Mfg costs
804
1,204
1,365
1,484
1,709
1,948
Personnel
832
1,302
1,551
1,768
2,033
2,338
Other
726
1,545
1,617
1,969
2,563
2,922
EBITDA
2,071
2,486
2,960
3,189
3,776
4,285
% chg
153.5
20.1
19.1
7.7
18.4
13.5
(% of Net Sales)
25.8
20.6
21.7
21.5
22.1
22.0
Depreciation& Amort.
313
333
393
428
551
586
EBIT
1,758
2,154
2,567
2,762
3,225
3,698
% chg
209.5
22.5
19.2
7.6
16.8
14.7
(% of Net Sales)
21.9
17.9
18.8
18.6
18.9
19.0
Interest & other Charges
108
84
159
67
112
60
Other Income
23
81
68
121
121
121
(% of PBT)
1.3
3.6
2.5
4.0
3.5
3.0
Share in profit of Asso.
-
-
-
-
-
-
Recurring PBT
1,735
2,227
2,722
3,061
3,479
4,004
% chg
222.7
28.4
22.2
12.4
13.7
15.1
Extraordinary Exp./(Inc.)
203.1
59.6
-
-
-
-
PBT (reported)
1,532
2,168
2,722
3,061
3,479
4,004
Tax
363.5
596.6
744.4
759.6
869.9
1,001.1
(% of PBT)
23.7
27.5
27.3
24.8
25.0
25.0
PAT (reported)
1,168
1,571
1,978
2,301
2,610
3,003
Less: Minority int. (MI)
(4)
(5)
(4)
(0)
(2)
(1)
PAT after MI (reported)
1,172
1,576
1,982
2,302
2,611
3,004
ADJ. PAT
1,333
1,619
1,982
2,302
2,611
3,004
% chg
208.6
21.5
22.4
16.1
13.5
15.0
(% of Net Sales)
14.6
13.1
14.5
15.5
15.3
15.4
Basic EPS (`)
22.8
27.7
33.9
39.3
44.6
51.3
% chg
208.6
21.5
22.4
16.1
13.5
15.0
June 2, 2017
8
Aurobindo Pharma | 4QFY2017 Result Update
Balance sheet (Consolidated)
Y/E March (` cr)
FY2014
FY2015
FY2016
FY2017
FY2018E FY2019E
SOURCES OF FUNDS
Equity Share Capital
29
29
59
59
59
59
Share Application Money
-
-
-
-
-
-
Reserves & Surplus
3,721
5,127
7,229
9,313
11,754
14,587
Shareholders Funds
3,750
5,156
7,287
9,372
11,812
14,646
Minority Interest
26
26
3
2
0
(0)
Long-term provisions
9
24
23
22
22
22
Total Loans
3,769
3,864
4,415
3,084
2,500
500
Deferred Tax Liability
205
211
(182)
(118)
(118)
(118)
Total Liabilities
7,760
9,280
11,546
12,362
14,194
15,027
APPLICATION OF FUNDS
Gross Block
4,107
6,095
6,093
7,625
8,125
8,625
Less: Acc. Depreciation
1,461
1,794
2,187
2,614
3,165
3,752
Net Block
2,645
3,752
3,907
5,011
4,959
4,873
Capital Work-in-Progress
310
310
310
310
310
310
Goodwill
76
64
812
971
971
971
Investments
20
20
123
246
246
246
Long-term loans and adv.
789
486
269
338
338
338
Current Assets
5,631
8,279
10,294
9,206
11,651
13,169
Cash
179
469
834
513
492
674
Loans & Advances
789
692
831
409
1,625
1,626
Other
4,664
7,118
8,629
8,284
9,534
10,869
Current liabilities
1,730
3,634
4,168
3,720
4,281
4,881
Net Current Assets
3,901
4,645
6,127
5,487
7,370
8,289
Mis. Exp. not written off
18
5
-
-
-
-
Total Assets
7,760
9,280
11,546
12,362
14,194
15,027
June 2, 2017
9
Aurobindo Pharma | 4QFY2017 Result Update
Cash flow statement (Consolidated)
Y/E March (` cr)
FY2014
FY2015
FY2016
FY2017
FY2018E FY2019E
Profit before tax
1,532
2,168
2,722
3,061
3,479
4,004
Depreciation
313
333
393
428
551
586
(Inc)/Dec in Working Capital
(457)
(757)
(1,333)
388
(1,905)
(736)
Less: Other income
23
81
68
121
121
121
Direct taxes paid
(363)
(597)
(744)
(760)
(870)
(1,001)
Cash Flow from Operations
1,001
1,066
969
2,996
1,135
2,732
(Inc.)/Dec.in Fixed Assets
(455)
(1,989)
2
(1,532)
(500)
(500)
(Inc.)/Dec. in Investments
(2)
-
103
123
-
-
Other income
23
81
68
121
121
121
Cash Flow from Investing
(435)
(1,908)
174
(1,288)
(379)
(379)
Issue of Equity
-
-
-
-
-
-
Inc./(Dec.) in loans
385
94
552
(1,331)
(584)
(2,000)
Dividend Paid (Incl. Tax)
(102)
(171)
(171)
(171)
(171)
(171)
Others
(879)
1,209
(1,159)
(527)
(22)
-
Cash Flow from Financing
(596)
1,133
(778)
(2,029)
(777)
(2,171)
Inc./(Dec.) in Cash
(30)
291
365
(321)
(21)
182
Opening Cash balances
208
179
469
834
513
492
Closing Cash balances
179
469
834
513
492
674
June 2, 2017
10
Aurobindo Pharma | 4QFY2017 Result Update
Key ratios
Y/E March
FY2014
FY2015
FY2016
FY2017
FY2018E
FY2019E
Valuation Ratio (x)
P/E (on FDEPS)
25.5
21.0
17.1
14.7
13.0
11.3
P/CEPS
11.4
8.9
14.3
12.4
10.7
9.5
P/BV
4.5
3.3
4.7
3.6
2.9
2.3
Dividend yield (%)
0.1
0.1
0.1
0.1
0.1
0.1
EV/Sales
2.5
1.7
2.8
2.5
2.1
1.7
EV/EBITDA
9.9
8.2
12.7
11.5
9.5
7.9
EV / Total Assets
2.6
2.2
3.3
3.0
2.5
2.2
Per Share Data (`)
EPS (Basic)
22.8
27.7
33.9
39.3
44.6
51.3
EPS (fully diluted)
22.8
27.7
33.9
39.3
44.6
51.3
Cash EPS
51.0
65.4
40.6
46.6
54.0
61.4
DPS
0.5
0.5
0.5
0.5
0.5
0.5
Book Value
128.8
176.6
124.5
160.1
201.9
250.3
Dupont Analysis
EBIT margin
21.9
17.9
18.8
18.6
18.9
19.0
Tax retention ratio
76.3
72.5
72.7
75.2
75.0
75.0
Asset turnover (x)
1.2
1.5
1.4
1.3
1.4
1.4
ROIC (Post-tax)
20.1
19.2
19.5
18.7
19.2
20.0
Cost of Debt (Post Tax)
2.3
1.6
2.8
1.3
3.0
3.0
Leverage (x)
1.1
0.8
0.6
0.4
0.2
0.1
Operating ROE
39.5
33.4
29.0
25.4
22.8
21.4
Returns (%)
ROCE (Pre-tax)
25.4
25.3
24.7
23.1
24.3
25.3
Angel ROIC (Pre-tax)
28.5
27.6
28.5
27.4
28.1
29.0
ROE
41.9
36.4
31.9
27.6
24.7
22.7
Turnover ratios (x)
Asset Turnover (Gross Block)
2.2
2.4
2.3
2.2
2.2
2.4
Inventory / Sales (days)
49
90
97
80
88
88
Receivables (days)
95
93
93
76
77
77
Payables (days)
73
114
117
96
96
96
WC cycle (ex-cash) (days)
145
119
124
124
125
134
Solvency ratios (x)
Net debt to equity
1.0
0.7
0.5
0.3
0.2
(0.0)
Net debt to EBITDA
1.7
1.4
1.2
0.8
0.5
(0.0)
Interest Coverage (EBIT / Int.)
16.3
25.5
16.2
41.4
28.9
61.6
June 2, 2017
11
Aurobindo Pharma | 4QFY2017 Result Update
Research Team Tel: 022 - 39357800
DISCLAIMER
Angel Broking Private Limited (hereinafter referred to as “Angel”) is a registered Member of National Stock Exchange of India Limited,
Bombay Stock Exchange Limited and Metropolitan Stock Exchange Limited. It is also registered as a Depository Participant with CDSL
and Portfolio Manager with SEBI. It also has registration with AMFI as a Mutual Fund Distributor. Angel Broking Private Limited is a
registered entity with SEBI for Research Analyst in terms of SEBI (Research Analyst) Regulations, 2014 vide registration number
INH000000164. Angel or its associates has not been debarred/ suspended by SEBI or any other regulatory authority for accessing
/dealing in securities Market. Angel or its associates/analyst has not received any compensation / managed or co-managed public
offering of securities of the company covered by Analyst during the past twelve months.
This document is solely for the personal information of the recipient, and must not be singularly used as the basis of any investment
decision. Nothing in this document should be construed as investment or financial advice. Each recipient of this document should
make such investigations as they deem necessary to arrive at an independent evaluation of an investment in the securities of the
companies referred to in this document (including the merits and risks involved), and should consult their own advisors to determine
the merits and risks of such an investment.
Reports based on technical and derivative analysis center on studying charts of a stock's price movement, outstanding positions and
trading volume, as opposed to focusing on a company's fundamentals and, as such, may not match with a report on a company's
fundamentals. Investors are advised to refer the Fundamental and Technical Research Reports available on our website to evaluate the
contrary view, if any.
The information in this document has been printed on the basis of publicly available information, internal data and other reliable
sources believed to be true, but we do not represent that it is accurate or complete and it should not be relied on as such, as this
document is for general guidance only. Angel Broking Pvt. Limited or any of its affiliates/ group companies shall not be in any way
responsible for any loss or damage that may arise to any person from any inadvertent error in the information contained in this report.
Angel Broking Pvt. Limited has not independently verified all the information contained within this document. Accordingly, we cannot
testify, nor make any representation or warranty, express or implied, to the accuracy, contents or data contained within this document.
While Angel Broking Pvt. Limited endeavors to update on a reasonable basis the information discussed in this material, there may be
regulatory, compliance, or other reasons that prevent us from doing so.
This document is being supplied to you solely for your information, and its contents, information or data may not be reproduced,
redistributed or passed on, directly or indirectly.
Neither Angel Broking Pvt. Limited, nor its directors, employees or affiliates shall be liable for any loss or damage that may arise from
or in connection with the use of this information.
Disclosure of Interest Statement
Aurobindo Pharma
1. Financial interest of research analyst or Angel or his Associate or his relative
No
2. Ownership of 1% or more of the stock by research analyst or Angel or associates or relatives
No
3. Served as an officer, director or employee of the company covered under Research
No
4. Broking relationship with company covered under Research
No
Ratings (Based on expected returns
Buy (> 15%)
Accumulate (5% to 15%)
Neutral (-5 to 5%)
over 12 months investment period):
Reduce (-5% to -15%)
Sell (< -15)
June 2, 2017
12