2QFY2018 Result Update | Pharmaceutical
November 21, 2017
Alembic Pharmaceuticals
BUY
CMP
`514
Performance Highlights
Target Price
‘600
Y/E March (` cr)
2QFY2018 1QFY2018
% chg (qoq) 2QFY2017
% chg (yoy)
Investment Period
12months
Net Sales
789
648
21.8
879
(10.2)
Other Income
8
0
0.0
0
19075.0
Operating Profit
178
101
75.8
177
0.7
Stock Info
Interest
0
1
(60.7)
1
(63.5)
Sector
Pharmaceutical
Adj. Net Profit
122
67
82.2
120
1.4
Market Cap (` cr)
9,681
Source: Company, Angel Research
Net Debt (` cr)
-9
Alembic Pharma posted marginally lower than expected sales for 2QFY2018. In
Beta
0.3
Rupee terms, revenues de-grew by 10.2% yoy to `789cr (`980cr expected) v/s.
52 Week High / Low
709/470
`879cr in 2QFY2017. International formulation came in at `262cr v/s. `352cr in
Avg. Daily Volume
19,513
2QFY2017, a yoy dip of 26.0%. Indian formulation sales came in at `385cr v/s. `363cr
2
Face Value (`)
in 2QFY2017, a yoy growth of 6.0%. On the operating front, EBITDA margin came
BSE Sensex
33,343
in at 22.6% (15.4% expected) v/s. 20.3% in 2QFY2017, an expansion of 230bps yoy.
Nifty
10,284
Thus, PAT came in at `122cr (`108cr expected) v/s. `120cr in 2QFY2017, up 1.4%
ALEM.BO
Reuters Code
yoy. We recommend a Buy rating.
Bloomberg Code
ALPM@IN
Results Highlights: In Rupee terms, revenues de-grew by 10.2% yoy to `789cr
(`980cr expected) v/s. `879cr in 2QFY2017. International formulation came in at
Shareholding Pattern (%)
`262cr v/s. `352cr in 2QFY2017, a yoy dip of 26.0%. Indian formulation sales came
Promoters
72.7
in at `385cr v/s. `363cr in 2QFY2017, a yoy growth of 6.0%. On the operating front,
MF / Banks / Indian Fls
4.9
EBITDA margin came in at 22.6% (15.4% expected) v/s. 20.3% in 2QFY2017, an
FII / NRIs / OCBs
10.7
expansion of 230bps yoy. R&D expense was 16.3% of sales v/s. 12.5% of sales in
Indian Public / Others
11.7
2QFY2017. Apart from lower sales, a 34.5% yoy rise in the employee expenses
impacted the OPM dip, although the dip was restricted by a 52.0% decline in the
other expenses. Thus, PAT came in at `122cr (`108cr expected) v/s. `120cr in
Abs. (%)
3m 1yr
3yr
2QFY2017, up 1.4% yoy.
Sensex
6.7
27.1
18.3
Outlook and valuation: Over FY2017-19E, we expect the company to post a CAGR
Alembic Pharma
-0.1
-15.7
13.1
of 12.4% in sales, while profitability will witness a CAGR of 5.7% yoy. We maintain
our Buy rating on the stock.
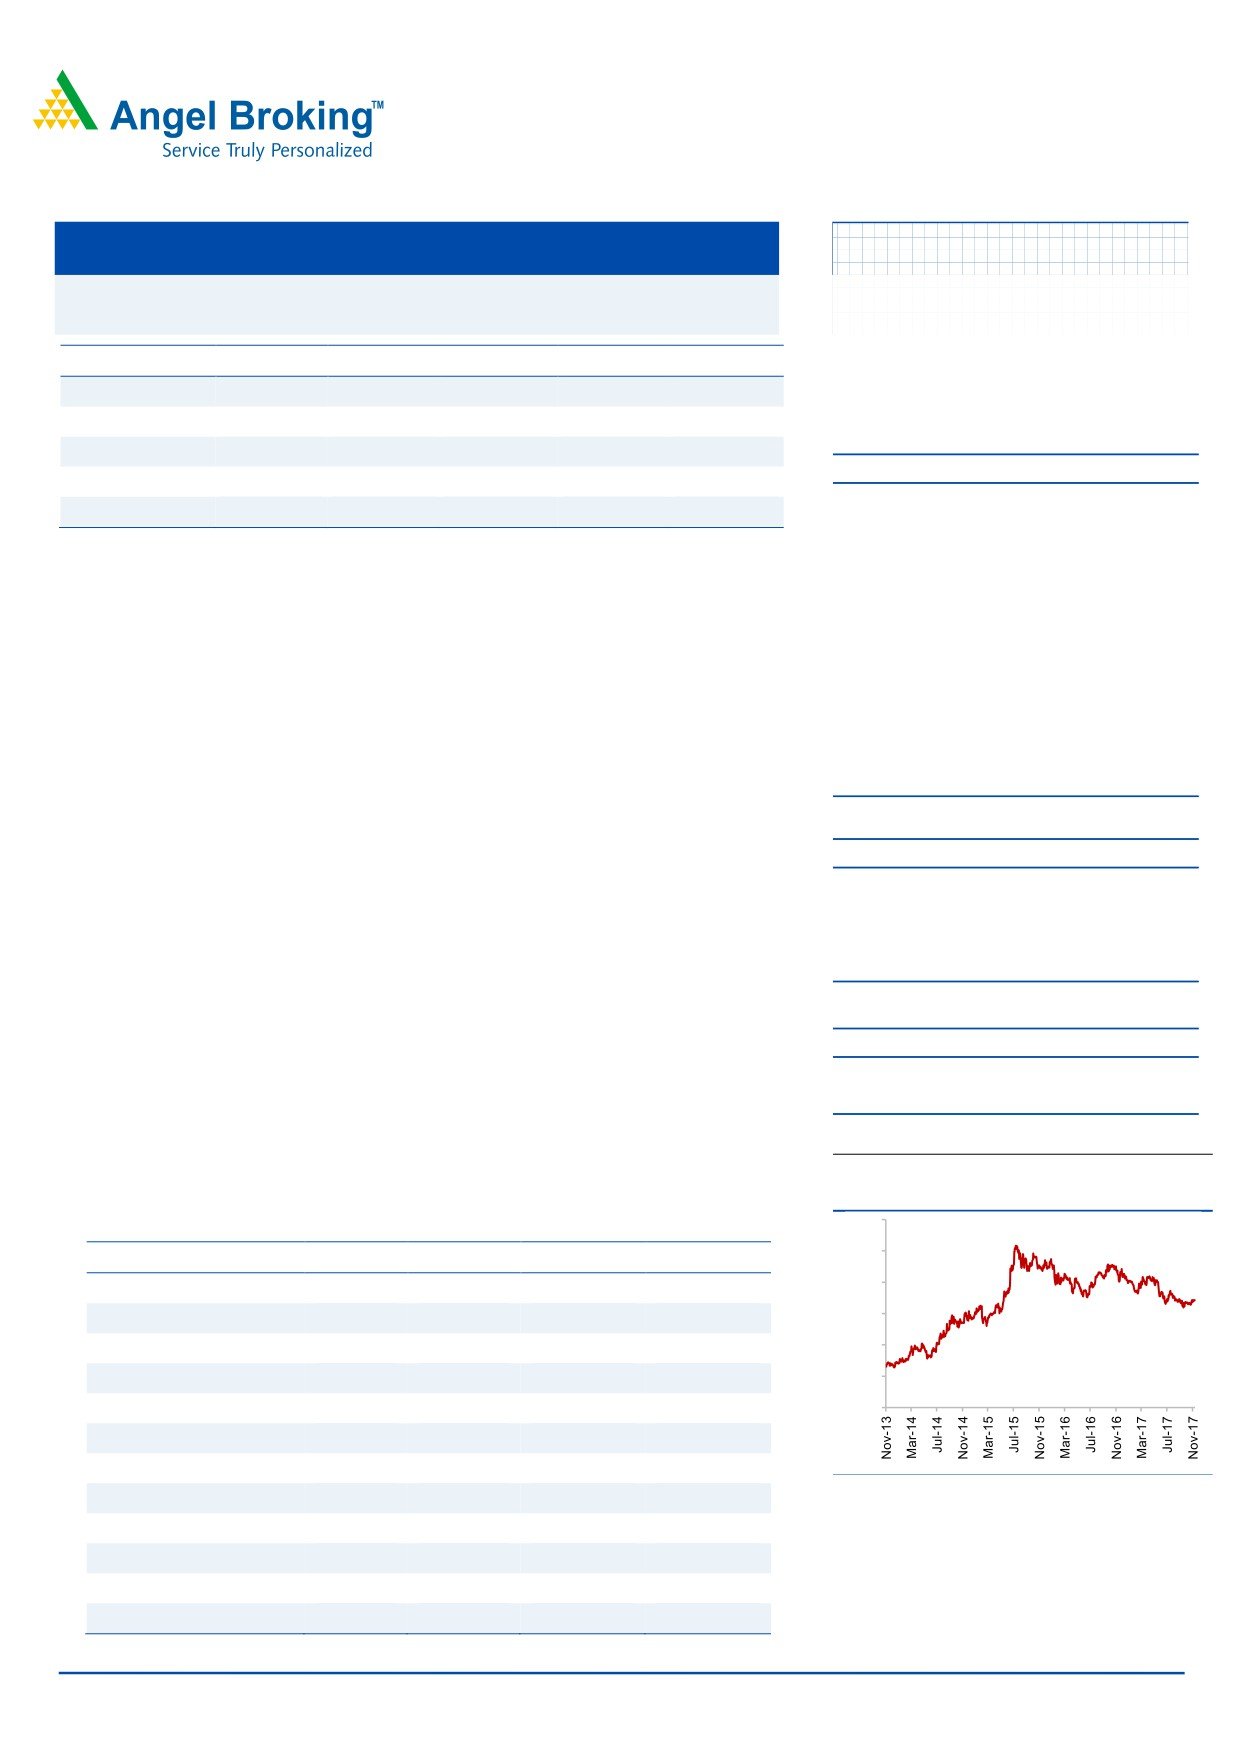
3-year price chart
900
Key Financials (Consolidated)
750
Y/E March (` cr)
FY2016
FY2017
FY2018E
FY2019E
3,145
3,101
3,346
3,915
600
Net Sales
53.2
(1.4)
7.9
17.0
450
% chg
720
403
396
450
300
Net Profit
% chg
154.1
(44.0)
(1.8)
13.7
150
EPS (`)
38.2
21.4
21.0
23.9
0
EBITDA Margin (%)
31.9
19.7
19.6
19.2
P/E (x)
13.5
24.0
24.5
21.5
Source: Company, Angel Research
RoE (%)
57.9
23.0
19.1
18.4
RoCE (%)
51.0
25.3
20.5
20.6
Sarabjit Kour Nangra
P/BV (x)
6.1
5.1
4.3
3.7
+91- 22- 36357600 - 6806
EV/Sales (x)
3.0
3.1
2.9
2.5
EV/EBITDA (x)
9.3
15.6
14.6
12.9
Source: Company, Angel Research; Note: CMP as of November 17, 2017
Please refer to important disclosures at the end of this report
1
Alembic Pharma |2QFY2018 Result Update
Exhibit 1: 2QFY2018 performance (Consolidated)
% chg
% chg
% chg
Y/E March (` cr)
2QFY2018 1QFY2018
2QFY2017
1HFY2018
1HFY2017
(qoq)
(yoy)
(yoy)
789
648
21.8
879
(10.2)
1,437
1,616
(11.1)
Net sales
8
0
0
19,075.0
8
1
537.4
Other income
797
648
22.9
872
(9.4)
1,445
1,617
Total income
576
466
23.5
632
(8.9)
1042
1166
(10.7)
Gross profit
72.9
71.9
72.5
72.5
72.2
Gross margin
178
101
75.8
177
0.7
280
335
(16.4)
Operating profit
22.6
15.6
20.3
19.5
20.7
Operating margin (%)
0
1
(60.7)
1
1
2
(47.5)
Interest
26
22
17.4
21
24.4
47
40
18.7
Depreciation
160
79
102.8
156
2.8
239
294
(18.6)
PBT
37
15
136.2
33
10.3
52
66
(21.6)
Provision for taxation
123
63
94.7
122
0.8
187
227
(17.8)
PAT before Extra-ordinary item
3
(3)
4
-1
4
(Profit)/Loss of Associate Company
122
67
82.2
120
1.4
188
224
(15.8)
PAT after Extra-ordinary item & MI
6.4
3.5
6.4
10.0
12.2
EPS (`)
Source: Company, Angel Research
Exhibit 2: 2QFY2018 - Actual vs Angel estimates
(` cr)
Actual
Estimates
Variation (%)
Net Sales
789
980
(19.5)
Other Income
8
0
19,075.0
Operating Profit
178
151
18.3
Interest
0
1
(61.1)
Tax
37
16
126.7
Net Profit
122
108
12.4
Source: Company, Angel Research
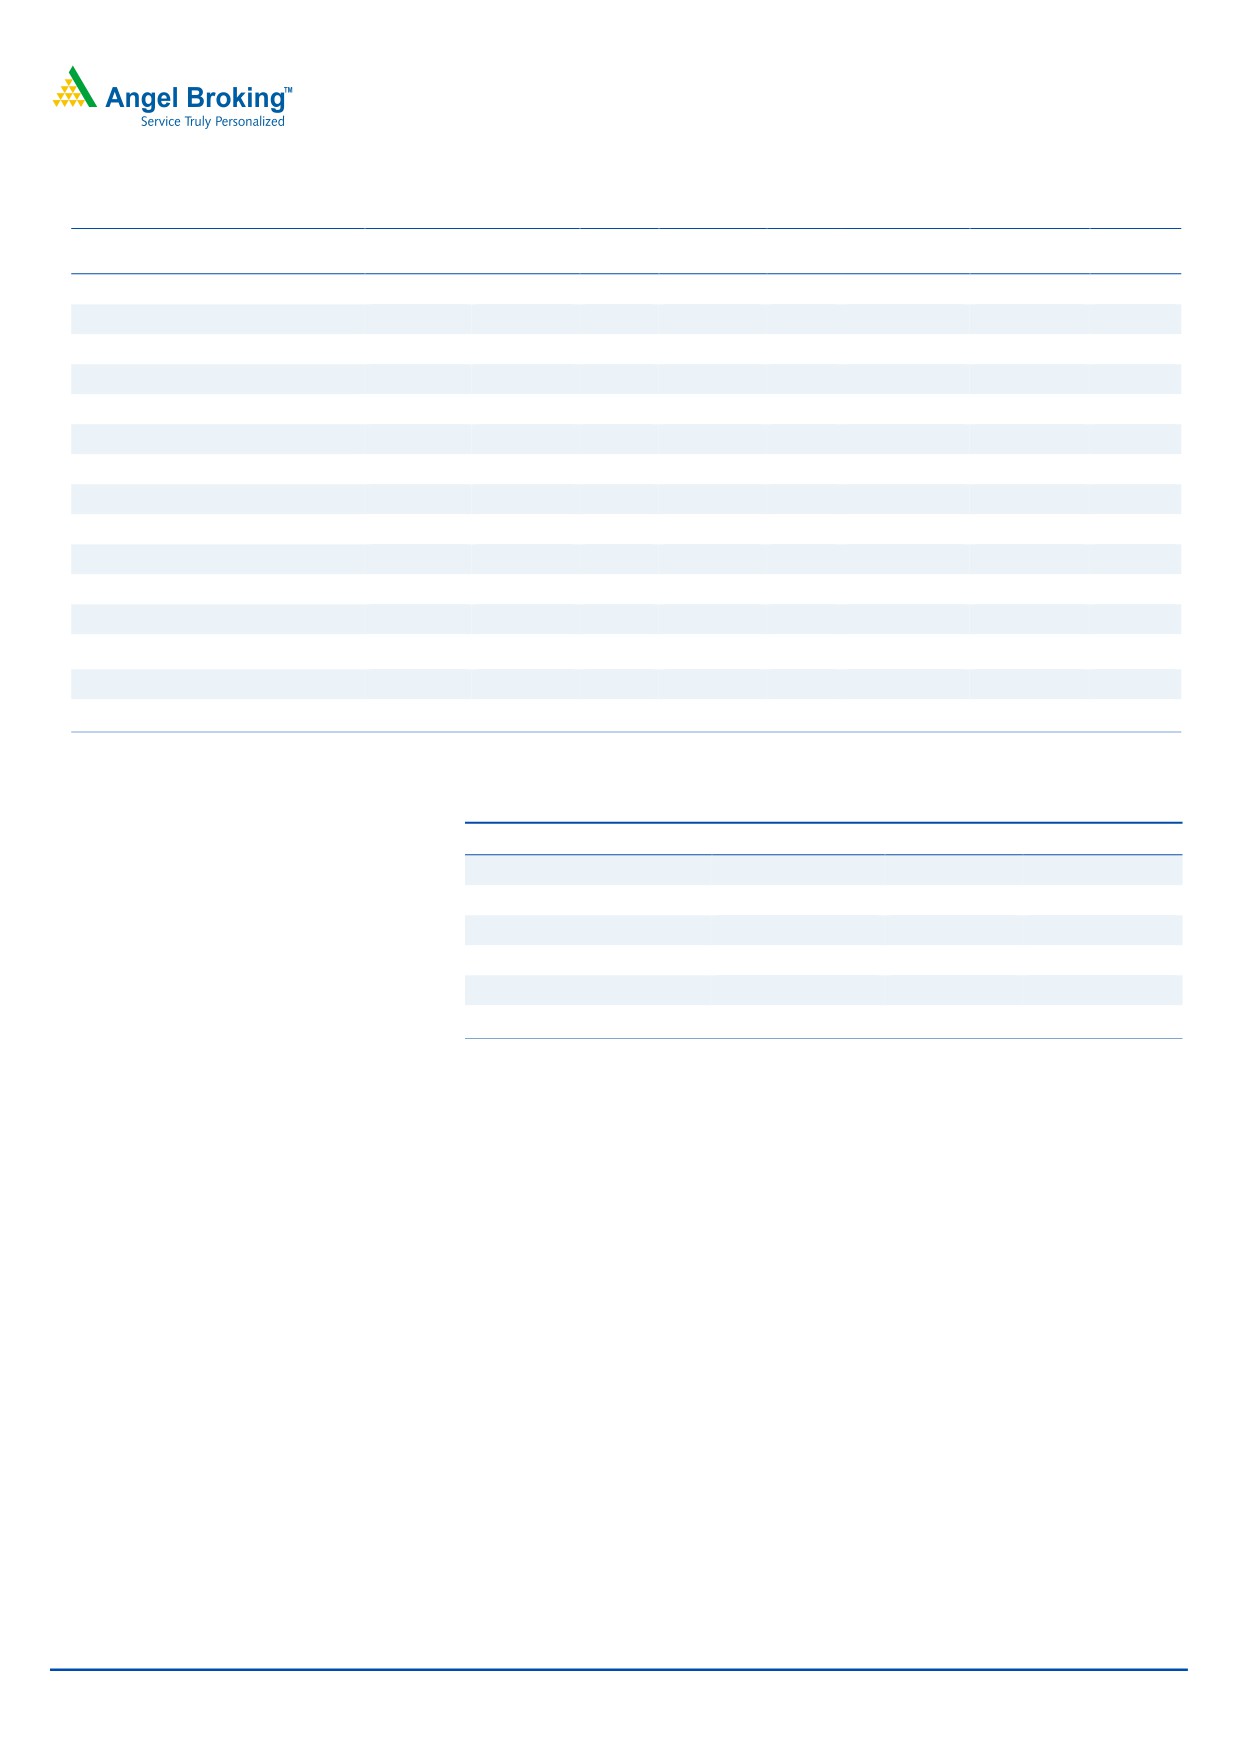
Sales below expectations: Alembic Pharma posted lower than expected results
for 2QFY2018. In Rupee terms, revenues de-grew by 10.2% yoy to `789cr (`980cr
expected) v/s. `879cr in 2QFY2017. International formulation came in at `262cr v/s.
`352cr in 2QFY2017, a yoy dip of 26.0%. Indian formulation sales came in at `385cr
v/s. `363cr in 2QFY2017, a yoy growth of 6.0%. API sales were down by 13.4% yoy
to end the period at `142cr v/s. `164cr in 2QFY2017.
In domestic formulation (‘385cr), specialty business, which constituted ~56% of the
domestic sales grew by 10.0% yoy, while acute segment, which constituted ~34%
of domestic formulations, grew by 1%. The Veterinary segment, which constituted
~10% of domestic formulations, posted a yoy growth of 4.0%. In International
formulation business (‘262cr), US formulation business (73% of international
formulation sales) de-grew by 29% yoy. The non-US international formulation sales
during the quarter also dipped by 14.0%.
International sales during the quarter contributed ~33.2% of sales, while Indian
branded formulation sales contributed ~48.8% of sales in 2QFY2018. In terms, of
November 21, 2017
2
Alembic Pharma |2QFY2018 Result Update
filling, the company has filed 3 products in US, while 4 products were approved in
2QFY2018.
Exhibit 3: Sales trend
1080
872
880
737
770
737
648
680
480
280
1QFY2017
2QFY2017
3QFY2017
4QFY2017
1QFY2018
Source: Company, Angel Research
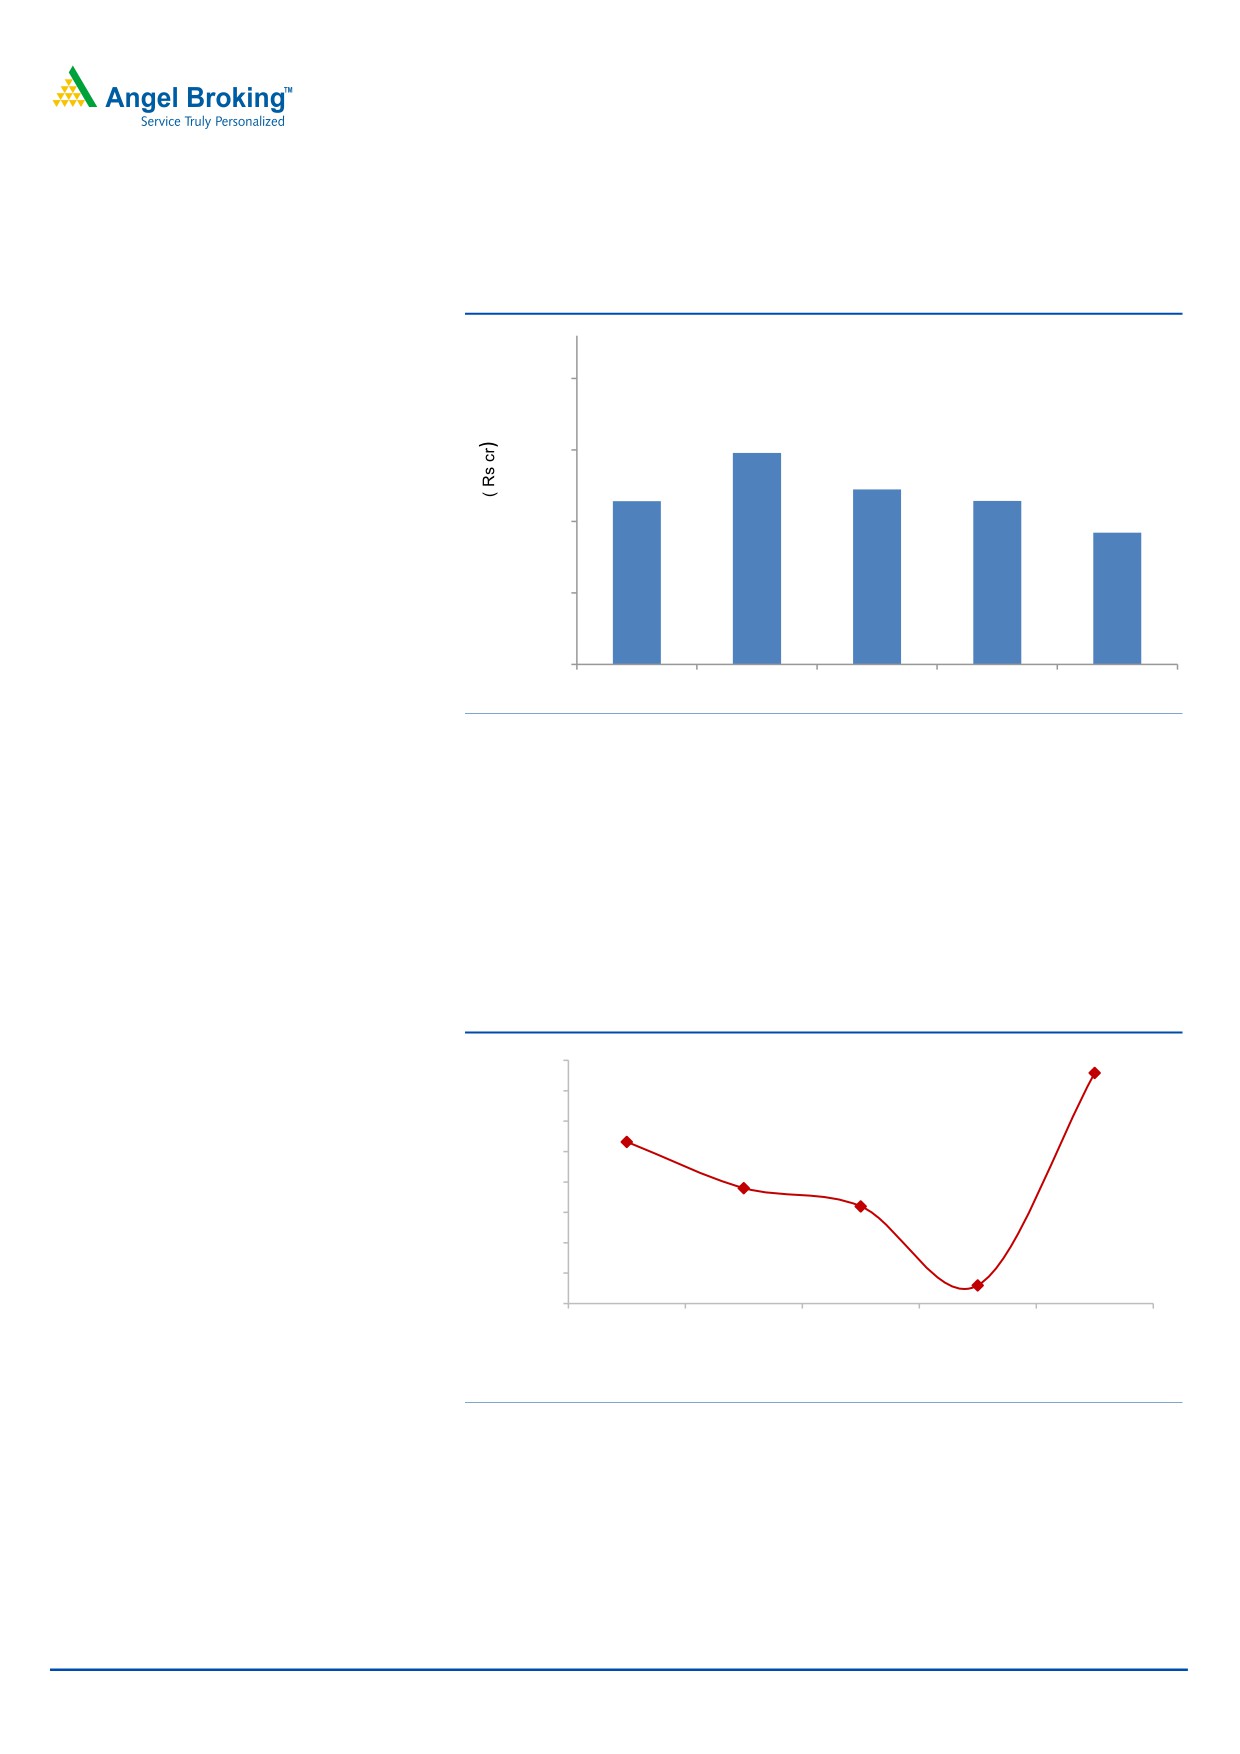
OPM better than expectation: On the operating front, EBITDA margin came in at
22.6% (15.4% expected) v/s. 20.3% in 2QFY2017, an expansion of 230bps yoy. The
dip was mainly on the back of lower gross margins, which came in at 72.9% v/s.
72.5% in 2QFY2017. R&D expense during the quarter was 16.3% of sales v/s. 12.5%
of sales in 2QFY2017. Apart from lower sales, a 34.5% yoy rise in the employee
expenses impacted the OPM dip, although the dip was restricted by a 52.0% decline
in the other expenses.
Exhibit 4: OPM Trend (%)
23.0
22.6
22.0
20.3
21.0
20.0
19.0
18.8
18.0
18.2
17.0
16.0
15.6
15.0
2QFY2017
3QFY2017
4QFY2017
1QFY2018
2QFY2018
Source: Company, Angel Research
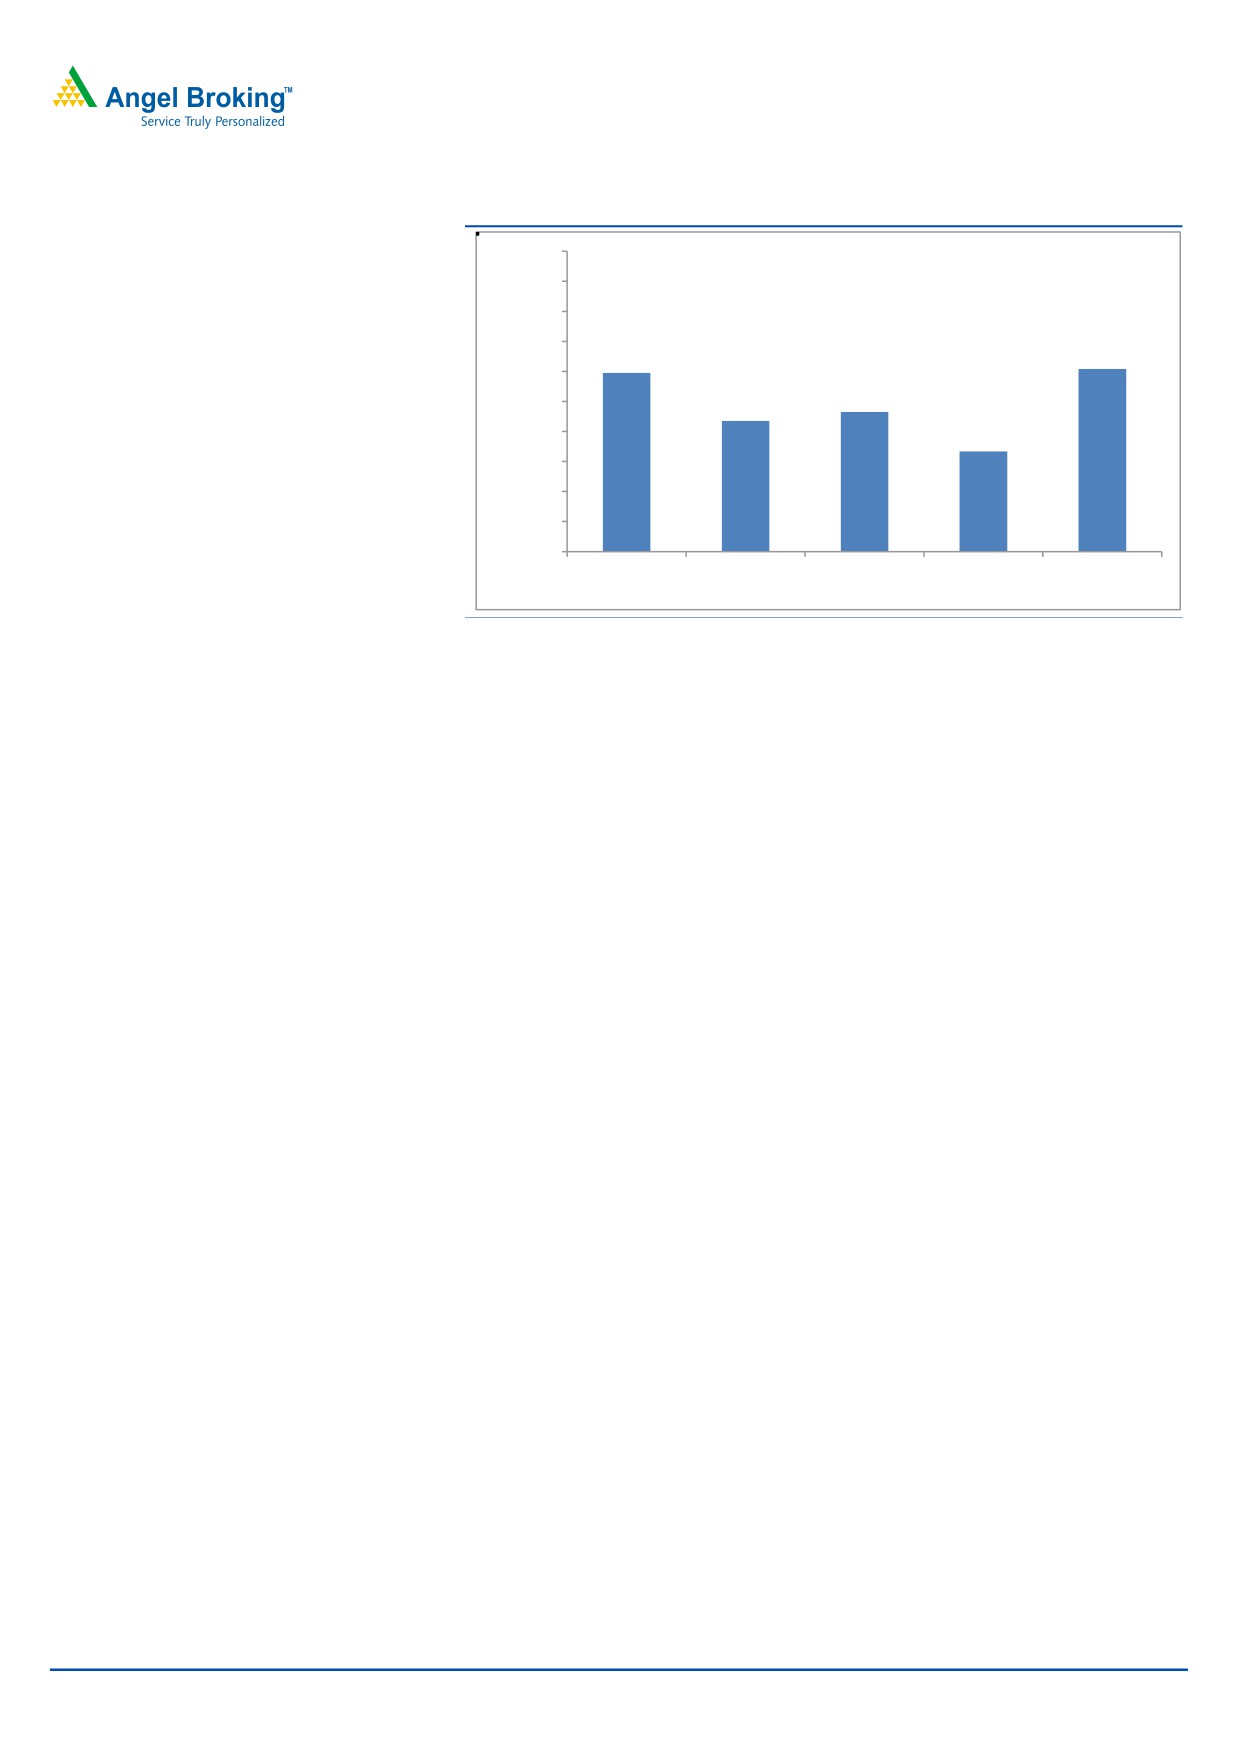
Net profit higher than expectations: PAT came in at `122cr (`108cr expected)
v/s. `120cr in 2QFY2017, up 1.4% yoy. The other income of `8cr V/s `1.2cr aided the
net profit to come in higher than expected.
November 21, 2017
3
Alembic Pharma |2QFY2018 Result Update
Exhibit 5: Net profit trend
200
180
160
119
140
122
120
93
87
100
80
67
60
40
20
0
2QFY2017
3QFY2017
4QFY2017
1QFY2018
2QFY2018
Source: Company, Angel Research
Concall highlights
Company filed 3 ANDA’s in 2QFY2018 (overall 9 filed in 1HFY2018), taking
cumulative ANDA filings to 104. Cumulatively, 50 ANDA’s are awaiting
approval.
Indian business is expected to grow in line with the industry growth in FY2018.
R&D expenses to be high, as company plans to file 100 ANDA’s over the next
three years.
EBDITA Margins expected to be 20% in FY2018E.
Capex for 2HFY2018 to be `280cr.
Investment arguments
Focus on chronic segment to drive domestic formulation growth: Alembic
Pharmaceuticals has been restructuring its business portfolio, which would aid in
improving its growth and operating performance. The company’s domestic
formulation business contributed 38% to its total sales in FY2017. The company has
a strong field force of ~3,600 medical representatives. Going forward, the company
expects its domestic formulation business to at least grow in-line with the industry
growth rate, before it sees an improvement in the share of the high growth chronic
segment. For FY2017-19E, we expect the domestic formulation business to grow at
a CAGR of 11.0%.
Exports - US the key growth driver: On the exports front, the formulation
business contributed 30% to the total turnover, with majority of the contribution
coming from Europe and the US. In the US, the company has filed for ~104 ANDAs
till date and received 50 approvals. The company, going forward, expects to keep
its momentum high in terms of number of filings, by filing around 100 ANDAs over
the next three years. For FY2017-19E, we expect exports to register a CAGR of 5.1%.
Outlook and valuation: Over FY2017-19E, we expect the company to post a CAGR
of 12.4% in sales, while profitability will be under pressure on the back of higher
November 21, 2017
4
Alembic Pharma |2QFY2018 Result Update
R&D spend. The Net profit is expected to grow by CAGR of 5.7% yoy during
FY2017-19E. We recommend a Buy rating on the stock.
Exhibit 6: Key assumptions
FY2018E
FY2019E
Domestic formulation sales growth (%)
8.0
14.0
Exports sales growth (%)
15.0
20.0
Operating margins (%)
18.6
19.7
Capex (` cr)
500
200
Net Debt/Equity (x)
0.0
0.0
Source: Company, Angel Research
Exhibit 7: Recommendation summary
Reco.
CMP Tgt Price Upside
FY2019E
FY17-19E
FY2019E
(`)
(`)
(%) PE (x) EV/Sales (x) EV/EBITDA (x)
CAGR in EPS (%) RoCE (%) RoE (%)
Alembic Pharma
Buy
514
600
16.8
21.5
2.5
12.9
5.7
20.6
18.4
Aurobindo Pharma
Buy
708
823
16.3
13.8
2.1
9.6
14.2
25.3
22.7
Cadila Healthcare
Reduce
446
411
(7.9)
21.7
3.5
17.3
18.9
16.5
22.2
Cipla
Sell
609
426
(24.1)
25.0
2.7
16.0
39.3
10.9
13.1
Dr Reddy's
Reduce
2,325
2,040
(12.3)
22.8
2.8
13.7
18.5
10.8
12.4
Dishman Pharma
Under Review
301
-
-
19.3
2.7
11.5
23.3
4.5
4.4
GSK Pharma
Sell
2,511
2000
(20.4)
51.4
6.4
37.7
19.3
25.8
23.5
Indoco Remedies
Sell
267
153
(42.8)
16.7
2.1
14.9
16.2
10.1
14.5
Ipca labs
Neutral
529
-
-
22.1
1.7
11.2
24.7
12.4
11.0
Lupin
Buy
829
1,091
31.6
16.7
2.1
9.7
(6.6)
13.7
13.7
Sanofi India*
Neutral
4,485
-
-
27.4
3.2
17.1
12.8
25.8
27.5
Sun Pharma
Accumulate
517
558
7.9
20.9
3.5
15.4
(12.9)
12.3
15.2
Source: Company, Angel Research; Note: *December year end
Company Background
Alembic Pharmaceuticals is a leading pharmaceutical company in India. The
company is vertically integrated to develop pharmaceutical substances and
intermediates. The company is a market leader in the Macrolides segment of
anti-infective drugs in India. Its manufacturing facilities are located in Vadodara and
in Baddi (Himachal Pradesh; for the domestic and non-regulated export market).
The Panelav facility houses the API and formulation manufacturing (both USFDA
approved) plants.
November 21, 2017
5
Alembic Pharma |2QFY2018 Result Update
Profit & Loss Statement (Consolidated)
Y/E March (` cr)
FY2015 FY2016 FY2017 FY2018E FY2019E
Gross sales
2,064
3,181
3,131
3,383
3,958
Less: Excise duty
11
36
29
37
44
Net sales
2,053
3,145
3,101
3,346
3,915
Other operating income
5.7
3.6
3.7
3.7
3.7
Total operating income
2,058
3,149
3,105
3,349
3,919
% chg
10.3
53.0
(1.4)
7.9
17.0
Total expenditure
1,653
2,143
2,490
2,690
3,162
Net raw materials
715
769
858
925
1,122
Other mfg costs
90
138
136
185
172
Personnel
307
421
559
643
771
Other
542
814
937
937
1,096
EBITDA
400
1,002
611
656
753
% chg
11.7
150.9
(39.0)
7.3
14.9
(% of Net Sales)
19.5
31.9
19.7
19.6
19.2
Depreciation& amortisation
44
72
83
132
157
Interest & other charges
2
4
5
10
12
Other income
0
6
2
2
2
(% of PBT)
0
-
-
-
-
Share in profit of Associates
-
-
-
-
-
Recurring PBT
360
936
525
516
587
% chg
16.8
160.2
(43.8)
(1.7)
13.7
Extraordinary expense/(Inc.)
-
-
-
-
-
PBT (reported)
360
936
525
516
587
Tax
76
216
122
120
137
(% of PBT)
21.2
23.1
23.3
23.3
23.3
PAT (reported)
283
720
403
396
450
Add: Share of earnings of asso.
-
(0)
-
-
-
Less: Minority interest (MI)
-
-
-
-
-
Prior period items
-
-
-
-
-
PAT after MI (reported)
283
720
403
396
450
ADJ. PAT
283
720
403
396
450
% chg
20.0
154.1
(44.0)
(1.8)
13.7
(% of Net Sales)
13.8
22.9
13.0
11.8
11.5
Basic EPS (`)
15.0
38.2
21.4
21.0
23.9
Fully Diluted EPS (`)
15.0
38.2
21.4
21.0
23.9
% chg
20.0
154.1
(44.0)
(1.8)
13.7
November 21, 2017
6
Alembic Pharma |2QFY2018 Result Update
Balance Sheet (Consolidated)
Y/E March (` cr)
FY2015
FY2016
FY2017
FY2018E
FY2019E
SOURCES OF FUNDS
Equity share capital
37.7
37.7
37.7
37.7
37.7
Preference Capital
-
-
-
-
-
Reserves & surplus
847
1,563
1,863
2,205
2,600
Shareholders funds
885
1,601
1,901
2,243
2,638
Minority Interest
Other Long Term Liabilities
15.8
33.9
69.8
69.8
69.8
Long Term Provisions
6.4
7.4
-
-
-
Total loans
239
133
80
200
150
Deferred tax liability
31
50
37
37
37
Total liabilities
1,177
1,824
2,088
2,549
2,895
APPLICATION OF FUNDS
Gross block
907
1,208
1,636
2,136
2,336
Less: acc. depreciation
313
385
468
600
756
Net block
595
824
1,169
1,537
1,580
Capital work-in-progress
-
-
-
-
-
Goodwill
35
44
27
27
27
Long Term Loans and Adv.
118
83
120
120
120
Investments
2.3
2.1
50.2
50.2
50.2
Current assets
891
1,507
1,321
1,488
2,201
Cash
55
451
160
235
52
Loans & advances
120
409
191
206
908
Other
716
647
970
1,047
1,241
Current liabilities
464
635
599
646
1,057
Net current assets
426
872
723
842
1,144
Mis. Exp. not written off
-
-
-
-
1.0
Total assets
1,177
1,824
2,088
2,549
2,895
November 21, 2017
7
Alembic Pharma |2QFY2018 Result Update
Cash Flow Statement (Consolidated)
Y/E March (` cr)
FY2015
FY2016
FY2017 FY2018E FY2019E
Profit before tax
360
936
525
516
587
Depreciation
44
72
83
132
157
(Inc)/Dec in Working Capital
66
191
(218)
28
(594)
Less: Other income
-
-
-
-
-
Direct taxes paid
76
216
122
120
137
Cash Flow from Operations
393
982
268
556
12
(Inc.)/Dec.in Fixed Assets
(222)
(301)
(428)
(500)
(200)
(Inc.)/Dec. in Investments
-
-
-
-
-
Other income
-
-
-
-
-
Cash Flow from Investing
(222)
(301)
(428)
(500)
(200)
Issue of Equity
-
-
-
-
-
Inc./(Dec.) in loans
164
(87)
(24)
120
(50)
Dividend Paid (Incl. Tax)
(55)
(55)
(55)
(55)
(55)
Others
(250)
(144)
(53)
29
(74)
Cash Flow from Financing
(141)
(286)
(131)
94
(179)
Inc./(Dec.) in Cash
31
396
(291)
75
(183)
Opening Cash balances
24
55
451
160
235
Closing Cash balances
55
451
160
235
52
November 21, 2017
8
Alembic Pharma |2QFY2018 Result Update
Key Ratios
Y/E March
FY2015
FY2016
FY2017
FY2018E
FY2019E
Valuation Ratio (x)
P/E (on FDEPS)
34.2
13.5
24.0
24.5
21.5
P/CEPS
29.6
12.2
19.9
18.3
16.0
P/BV
11.0
6.1
5.1
4.3
3.7
Dividend yield (%)
0.5
0.5
0.5
0.5
0.5
EV/Sales
4.8
3.0
3.1
2.9
2.5
EV/EBITDA
24.5
9.3
15.6
14.6
12.9
EV / Total Assets
8.3
5.1
4.6
3.8
3.4
Per Share Data (`)
EPS (Basic)
15.0
38.2
21.4
21.0
23.9
EPS (fully diluted)
15.0
38.2
21.4
21.0
23.9
Cash EPS
17.4
42.0
25.8
28.0
32.2
DPS
2.5
2.5
2.5
2.5
2.5
Book Value
46.9
84.9
100.9
119.0
140.0
Dupont Analysis
EBIT margin
17.3
29.6
17.0
15.7
15.2
Tax retention ratio
78.8
76.9
76.7
76.7
76.7
Asset turnover (x)
2.2
2.5
1.9
1.6
1.5
ROIC (Post-tax)
29.6
57.4
24.6
19.0
17.8
Cost of Debt (Post Tax)
0.9
1.5
3.7
5.4
0.0
Leverage (x)
0.1
0.0
0.0
(0.0)
0.0
Operating ROE
33.8
57.6
24.6
18.6
18.0
Returns (%)
ROCE (Pre-tax)
30.2
51.0
25.3
20.5
20.6
Angel ROIC (Pre-tax)
38.7
77.0
32.7
25.0
23.4
ROE
36.3
57.9
23.0
19.1
18.4
Turnover ratios (x)
Asset Turnover (Gross Block)
2.6
3.0
2.2
1.8
1.8
Inventory / Sales (days)
61.5
55.2
70.7
69.7
78.2
Receivables (days)
56.3
41.2
40.4
17.7
20.6
Payables (days)
79.3
84.8
88.9
38.7
45.1
WC cycle (ex-cash) (days)
60.3
45.9
57.8
63.8
79.1
Solvency ratios (x)
Net debt to equity
0.2
(0.2)
(0.0)
(0.0)
0.0
Net debt to EBITDA
0.5
(0.3)
(0.1)
(0.1)
0.1
Interest Coverage (EBIT / Int.)
199.5
252.8
103.1
53.4
48.7
November 21, 2017
9
Alembic Pharma |2QFY2018 Result Update
November 21, 2017
10
Alembic Pharma |2QFY2018 Result Update
Research Team Tel: 022 - 39357800
DISCLAIMER
Angel Broking Private Limited (hereinafter referred to as “Angel”) is a registered Member of National Stock Exchange of India Limited,
Bombay Stock Exchange Limited and Metropolitan Stock Exchange of India Limited. It is also registered as a Depository Participant with
CDSL and Portfolio Manager with SEBI. It also has registration with AMFI as a Mutual Fund Distributor. Angel Broking Private Limited is
a registered entity with SEBI for Research Analyst in terms of SEBI (Research Analyst) Regulations, 2014 vide registration number
INH000000164. Angel or its associates has not been debarred/ suspended by SEBI or any other regulatory authority for accessing
/dealing in securities Market. Angel or its associates including its relatives/analyst do not hold any financial interest/beneficial ownership
of more than 1% in the company covered by Analyst. Angel or its associates/analyst has not received any compensation / managed or
co-managed public offering of securities of the company covered by Analyst during the past twelve months. Angel/analyst has not
served as an officer, director or employee of company covered by Analyst and has not been engaged in market making activity of the
company covered by Analyst.
This document is solely for the personal information of the recipient, and must not be singularly used as the basis of any investment
decision. Nothing in this document should be construed as investment or financial advice. Each recipient of this document should make
such investigations as they deem necessary to arrive at an independent evaluation of an investment in the securities of the companies
referred to in this document (including the merits and risks involved), and should consult their own advisors to determine the merits
and risks of such an investment.
Reports based on technical and derivative analysis center on studying charts of a stock's price movement, outstanding positions and
trading volume, as opposed to focusing on a company's fundamentals and, as such, may not match with a report on a company's
fundamentals.
The information in this document has been printed on the basis of publicly available information, internal data and other reliable
sources believed to be true, but we do not represent that it is accurate or complete and it should not be relied on as such, as this
document is for general guidance only. Angel Broking Pvt. Limited or any of its affiliates/ group companies shall not be in any way
responsible for any loss or damage that may arise to any person from any inadvertent error in the information contained in this report.
Angel Broking Pvt. Limited has not independently verified all the information contained within this document. Accordingly, we cannot
testify, nor make any representation or warranty, express or implied, to the accuracy, contents or data contained within this document.
While Angel Broking Pvt. Limited endeavors to update on a reasonable basis the information discussed in this material, there may be
regulatory, compliance, or other reasons that prevent us from doing so.
This document is being supplied to you solely for your information, and its contents, information or data may not be reproduced,
redistributed or passed on, directly or indirectly.
Neither Angel Broking Pvt. Limited, nor its directors, employees or affiliates shall be liable for any loss or damage that may arise from
or in connection with the use of this information.
Note: Please refer to the important ‘Stock Holding Disclosure' report on the Angel website (Research Section). Also, please
refer to the latest update on respective stocks for the disclosure status in respect of those stocks. Angel Broking Pvt. Limited
and its affiliates may have investment positions in the stocks recommended in this report.
Disclosure of Interest Statement
Alembic Pharma
1. Analyst ownership of the stock
No
2. Angel and its Group companies ownership of the stock
No
3. Angel and its Group companies' Directors ownership of the stock
No
4. Broking relationship with company covered
No
Note: We have not considered any Exposure below ` 1 lakh for Angel, its Group companies and Directors
Ratings (Based on expected returns
Buy (> 15%)
Accumulate (5% to 15%)
Neutral (-5 to 5%)
over 12 months investment period):
Reduce (-5% to -15%)
Sell (< -15)
November 21, 2017
11