3QFY2018 Result Update | IT
January 16, 2018
Infosys
NEUTRALMULATE
CMP
`1,080
Performance highlights
Target Price
-
(` cr)
3QFY18
2QFY18
% chg (qoq)
3QFY17
% chg (yoy)
Investment Period
12 Months
Net revenue
17,794
17,567
1.3
17,273
3.0
EBITDA
4,817
4,702
2.4
4,767
1.0
EBITDA margin (%)
27.1
26.8
30bps
27.6
(53)bps
Stock Info
Adj. PAT
3,697
3,727
(0.8)
3,708
(0.3)
Sector
IT
Source: Company, Angel Research
Market Cap (` cr)
235,954
For 3QFY2018, on sales front Infosys posted 1.0% sequential growth in USD
Net Debt (` cr)
(32,666)
revenues to US$2,755mn in line with expectations. In Constant Currency terms
Beta
0.7
(CC), the company posted a 0.8% qoq growth. Volume growth during the quarter
52 Week High / Low
1,092/862
was 1.6% qoq. EBIT margin came in at 24.3% v/s. 24.2% expected, mainly driven
Avg. Daily Volume
352,628
by improved utilization levels (which came in at 84.9% v/s. 84.7% in 2QFY2018).
Face Value (`)
5
Consequently, PAT came in at `3,697cr v/s. `3,587cr expected, a dip of 0.8% qoq.
BSE Sensex
34,844
FY2018 revenue guidance has been kept at 5.5-6.5% in Constant Currency.
Nifty
10,742
Operating margin guidance unchanged at 23-25%. We maintain Neutral rating.
Reuters Code
INFY.BO
Bloomberg Code
INFY@IN
Quarterly highlights: On sales front, the company posted 1.0% sequential
growth in USD revenues to US$2,755mn in line with the expectations. In Constant
Currency terms (CC), the company posted a 0.8% qoq growth. Volume growth
Shareholding Pattern (%)
during the quarter was 1.6% qoq. In terms of geography, North America posted
Promoters
12.9
0.7% CC growth, Europe 4.7% qoq CC, India 5.9% qoq CC and ROW posted 4.0%
MF / Banks / Indian Fls
21.8
qoq CC growth. In terms of Industry, FSI posted 0.1% qoq CC growth, MFG
FII / NRIs / OCBs
52.2
declined 0.1% qoq CC, RCL 1.2% qoq CC and ECS posted 2.5% qoq CC growth.
Indian Public / Others
13.1
EBIT margin came in at 24.3% v/s. 24.2% expected, mainly driven by improved
utilization levels (which came in at 84.9% v/s. 84.7% in 2QFY2018). Consequently,
PAT came in at `3,697cr v/s. `3,587cr expected, a dip of 0.8% qoq.
Abs.(%)
3m 1yr
3yr
Sensex
6.8
27.7
24.1
Outlook and valuation: For FY2018, Infosys has maintained its revenue growth
Infosys
15.0
13.0
1.2
guidance to 5.5-6.6% v/s. 6.5-8.5% earlier in CC terms, while EBIT is expected to
be around 23-25%. We maintain our Neutral rating on the stock.
Key financials (Consolidated, IFRS)
3-year price chart
Y/E March (` cr)
FY2016
FY2017
FY2018E
FY2019E
1,400
Net sales
62,441
68,484
70,665
76,318
% chg
17.1
9.7
3.2
8.0
1,200
Adj. net profit
13,491
14,353
14,479
15,460
1,000
% chg
9.4
6.4
0.9
6.8
800
EBITDA margin (%)
27.4
27.2
26.5
26.5
EPS (`)
59.0
62.5
63.1
67.3
600
P/E (x)
18.3
17.3
17.1
16.0
400
P/BV (x)
4.0
3.6
3.3
3.1
RoE (%)
21.8
20.8
19.3
19.1
RoCE (%)
20.7
20.3
19.6
19.8
Source: Company, Angel Research
EV/Sales (x)
3.4
3.1
2.9
2.6
EV/EBITDA (x)
12.5
11.5
10.9
9.8
Sarabjit kour Nangra
Source: Company, Angel Research; Note: CMP as of January 15, 2018
+91 22-39357800 Ext: 6806
Please refer to important disclosures at the end of this report
1
Infosys | 3QFY2018 Result Update
Exhibit 1: 3QFY2018 performance (IFRS, consolidated)
(` cr)
3QFY18
2QFY18
% chg (qoq)
3QFY17
% chg (yoy) 9MFY18 9MFY17
% chg (yoy)
Net revenue
17,794
17,567
1.3
17,273
3.0
52,439
51,365
2.1
Cost of revenue
10,952
10,771
1.7
10,407
5.2
32,172
31,230
3.0
Gross profit
6,842
6,796
0.7
6,866
(0.3)
20,267
20,135
0.7
SG&A expenses
2,025
2,094
(3.3)
2,099
(3.5)
6,187
6,192
(0.1)
EBITDA
4,817
4,702
2.4
4,767
1.0
14,080
13,943
1.0
Depreciation
498
456
9.2
433
15.0
1,404
1,253
12.1
EBIT
4,319
4,246
1.7
4,334
(0.3)
12,676
12,690
(0.1)
Other income
962
883
8.9
820
17.3
2,659
2,333
14.0
PBT
5,281
5,129
3.0
5,154
2.5
15,335
15,023
2.1
Income tax
152
1,403
(89.2)
1,446
(89.5)
2,925
4,268
(31.5)
Exceptional item
-
-
-
71
(5)
Reported PAT
5,129
3,727
37.6
3,708
38.3
12,339
10,749
14.8
Adjusted PAT
3,697
3,727
(0.8)
3,708
(0.3)
10,907
10,749
1.5
EPS
16.2
16.3
(0.8)
16.2
(0.3)
47.7
47.0
1.5
Gross margin (%)
38.5
38.7
(24)bps
39.7
(130)bps
38.6
39.2
(55)bps
EBITDA margin (%)
27.1
26.8
30bps
27.6
(53)bps
26.9
27.1
(29)bp
EBIT margin (%)
24.3
24.2
10bps
25.1
(82)bps
24.2
24.7
(53)bp
PAT margin (%)
20.8
21.2
(44)bps
21.5
(69)bps
20.8
20.9
(13)bp
Source: Company, Angel Research
Exhibit 2: 3QFY2018 - Actual Vs Angel estimates
(` cr)
Actual
Estimate
% Var.
Net revenue
17,794
17,770
0.1
EBITDA margin (%)
27.1
26.7
37bps
PAT
3,697
3,587
3.1
Source: Company, Angel Research
Revenues just in-line with expectation
On sales front, the company posted 1.0% sequential growth in USD revenues to
US$2,755mn in line with the expectations. In Constant Currency terms (CC), the
company posted a 0.8% qoq growth. Volume growth during the quarter was 1.6%
qoq.
In terms of geography, North America posted 0.7% CC growth, Europe 4.7% qoq
CC India 5.9% qoq CC and ROW posted 4.0% qoq CC growth.
In terms of Industry, FSI posted 0.1% qoq CC growth, MFG declined 0.1% qoq CC,
RCL 1.2% qoq CC and ECS posted 2.5% qoq CC growth.
January 16, 2018
2
Infosys | 3QFY2018 Result Update
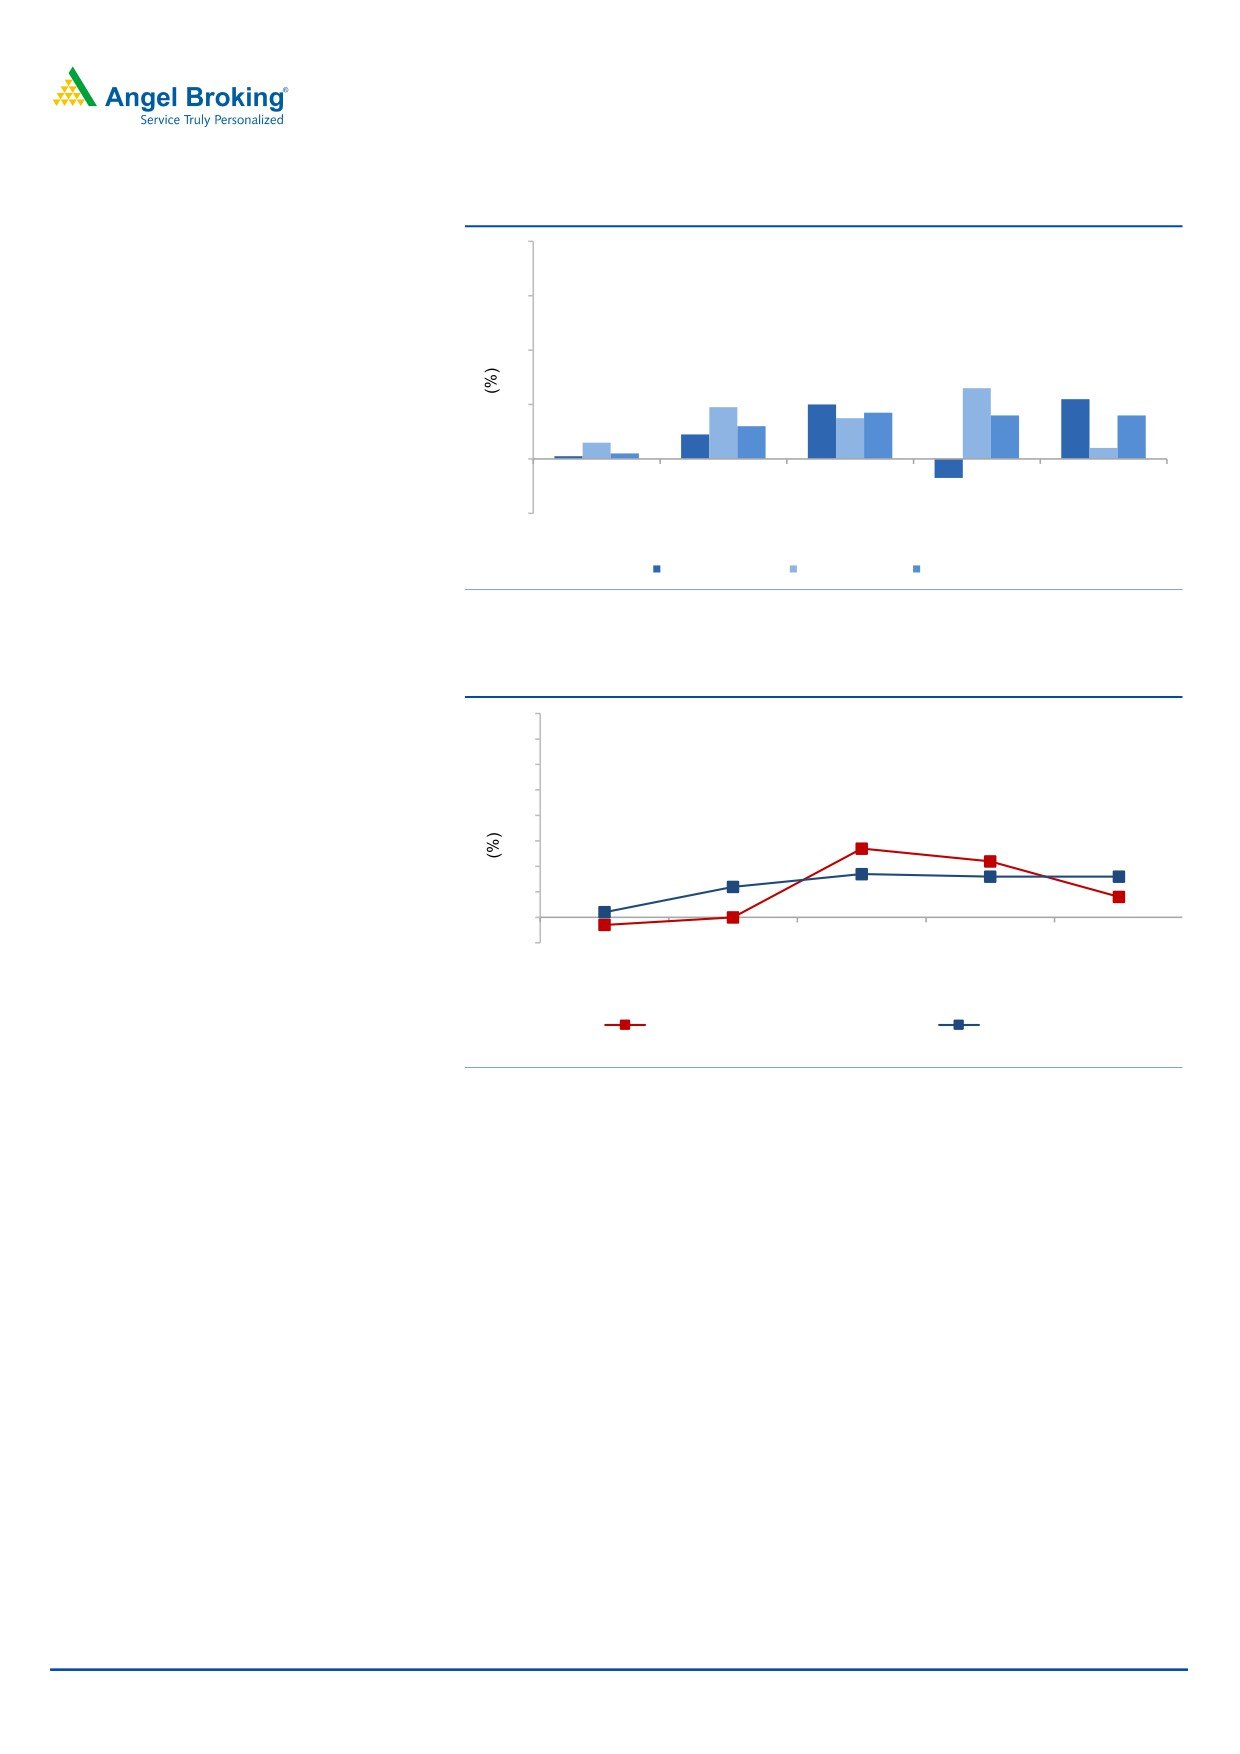
Exhibit 3: Trend in volume growth qoq (Effort wise)
8
6
4
2.6
1.9
2.2
2.0
1.5
1.7
1.6
1.6
2
1.2
0.6
0.9
0.4
0.1
0.2
0
(0.7)
(2)
3QFY17
4QFY17
1QFY18
2QFY18
3QFY18
Offshore
Onsite
Total volume growth
Source: Company, Angel Research
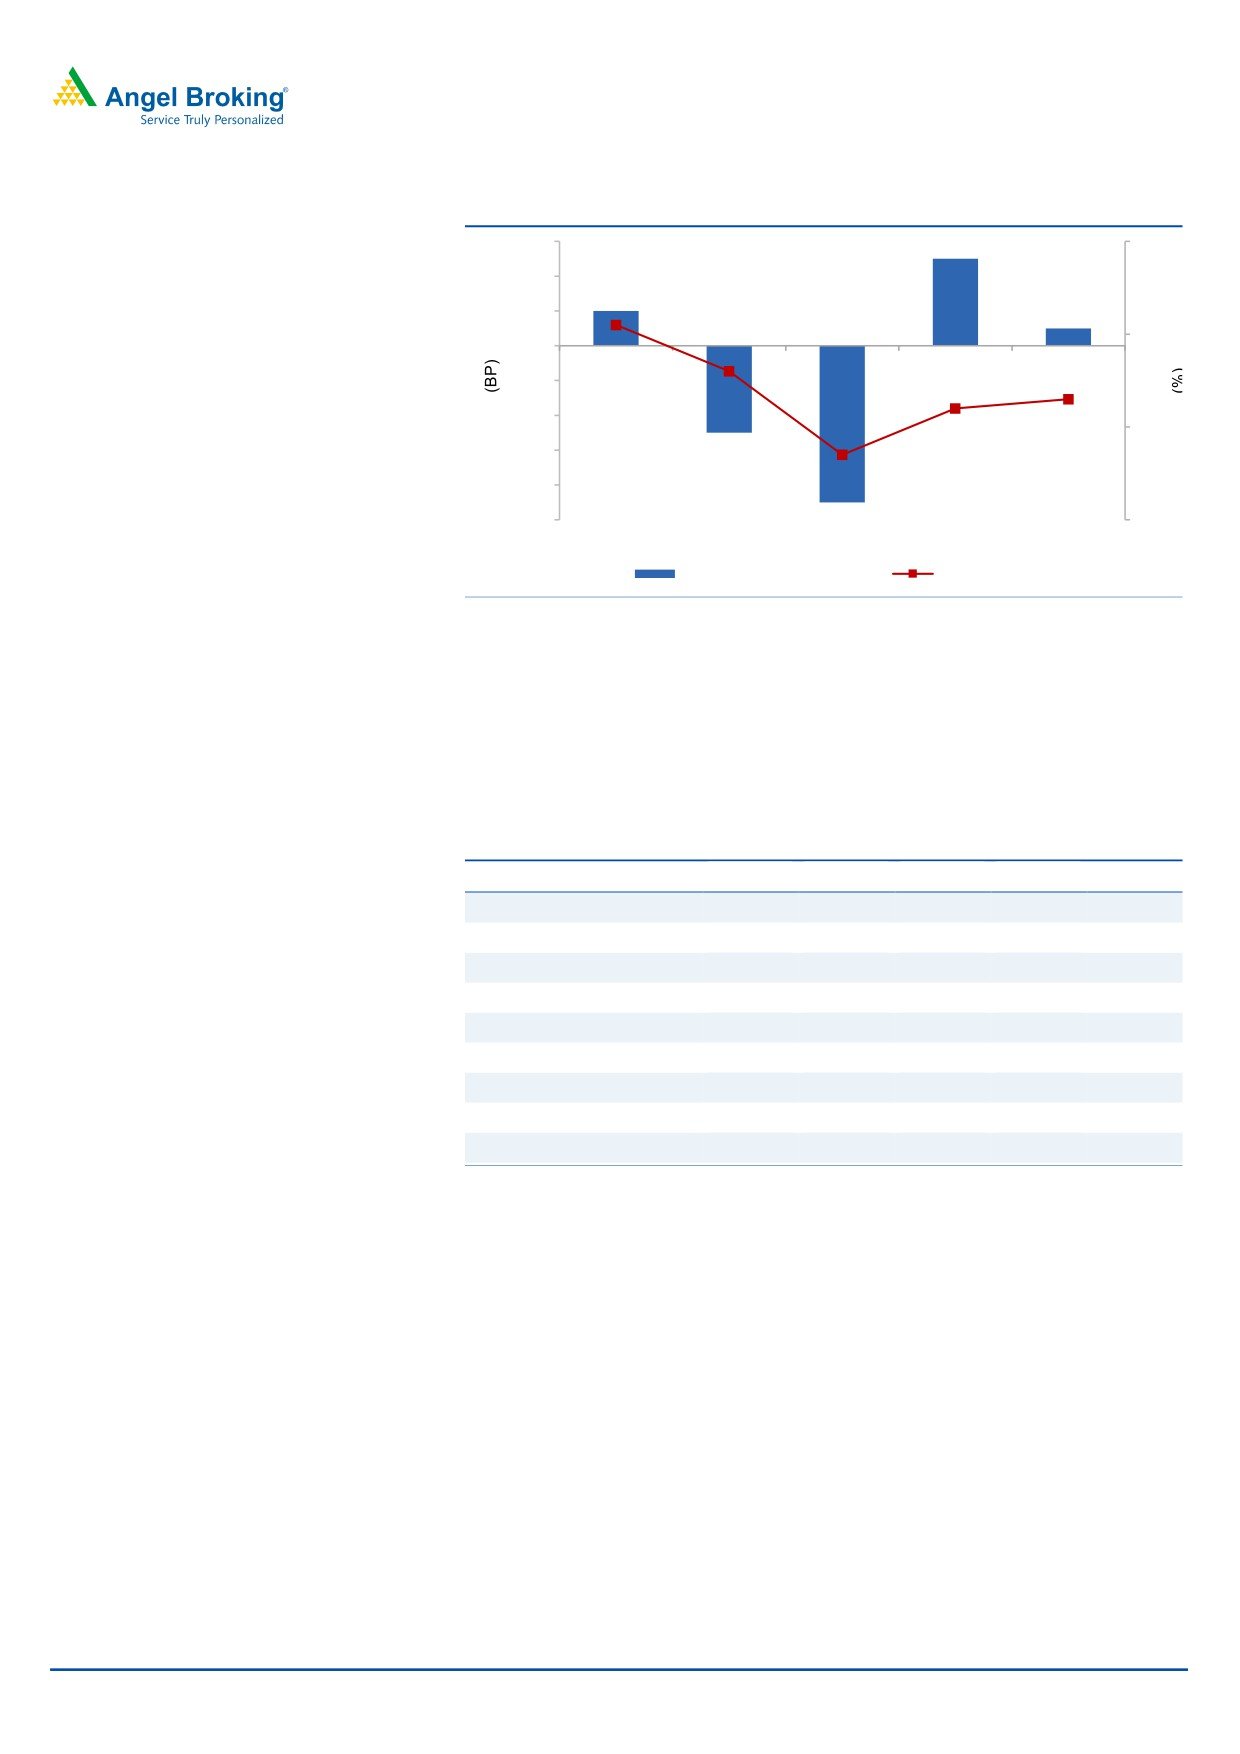
Exhibit 4: Trend in volume and USD revenue growth (qoq)
8
7
6
2.7
5
4
3
1.6
1.6
2
2.2
1
0.0
1.2
0
1.7
0.8
(1)
0.2
(0.3)
3QFY17
4QFY17
1QFY18
2QFY18
3QFY18
Revenue growth (constant currency)
Volume growth
Source: Company, Angel Research
Industry wise, revenues from FSI, the company’s anchor vertical contributing 33.1%
to revenues, grew by 0.1% qoq in CC terms and 0.3% qoq. The Manufacturing
industry vertical, which contributed 21.8% to revenues, grew by 0.1% qoq. In CC
terms, the revenue from this vertical posted a qoq de-growth of 0.1%.
The Retail, CPG and Logistics segment (or RCL that contributed 22.7% to revenues)
reported a 1.4% qoq growth. In CC terms, the revenues from RCL grew by 1.2%
qoq. The Energy Utilities and Communications & Services segment contributed
22.4% to revenue, reporting a growth of 2.6% qoq in revenue and 2.5% qoq on CC
basis.
January 16, 2018
3
Infosys | 3QFY2018 Result Update
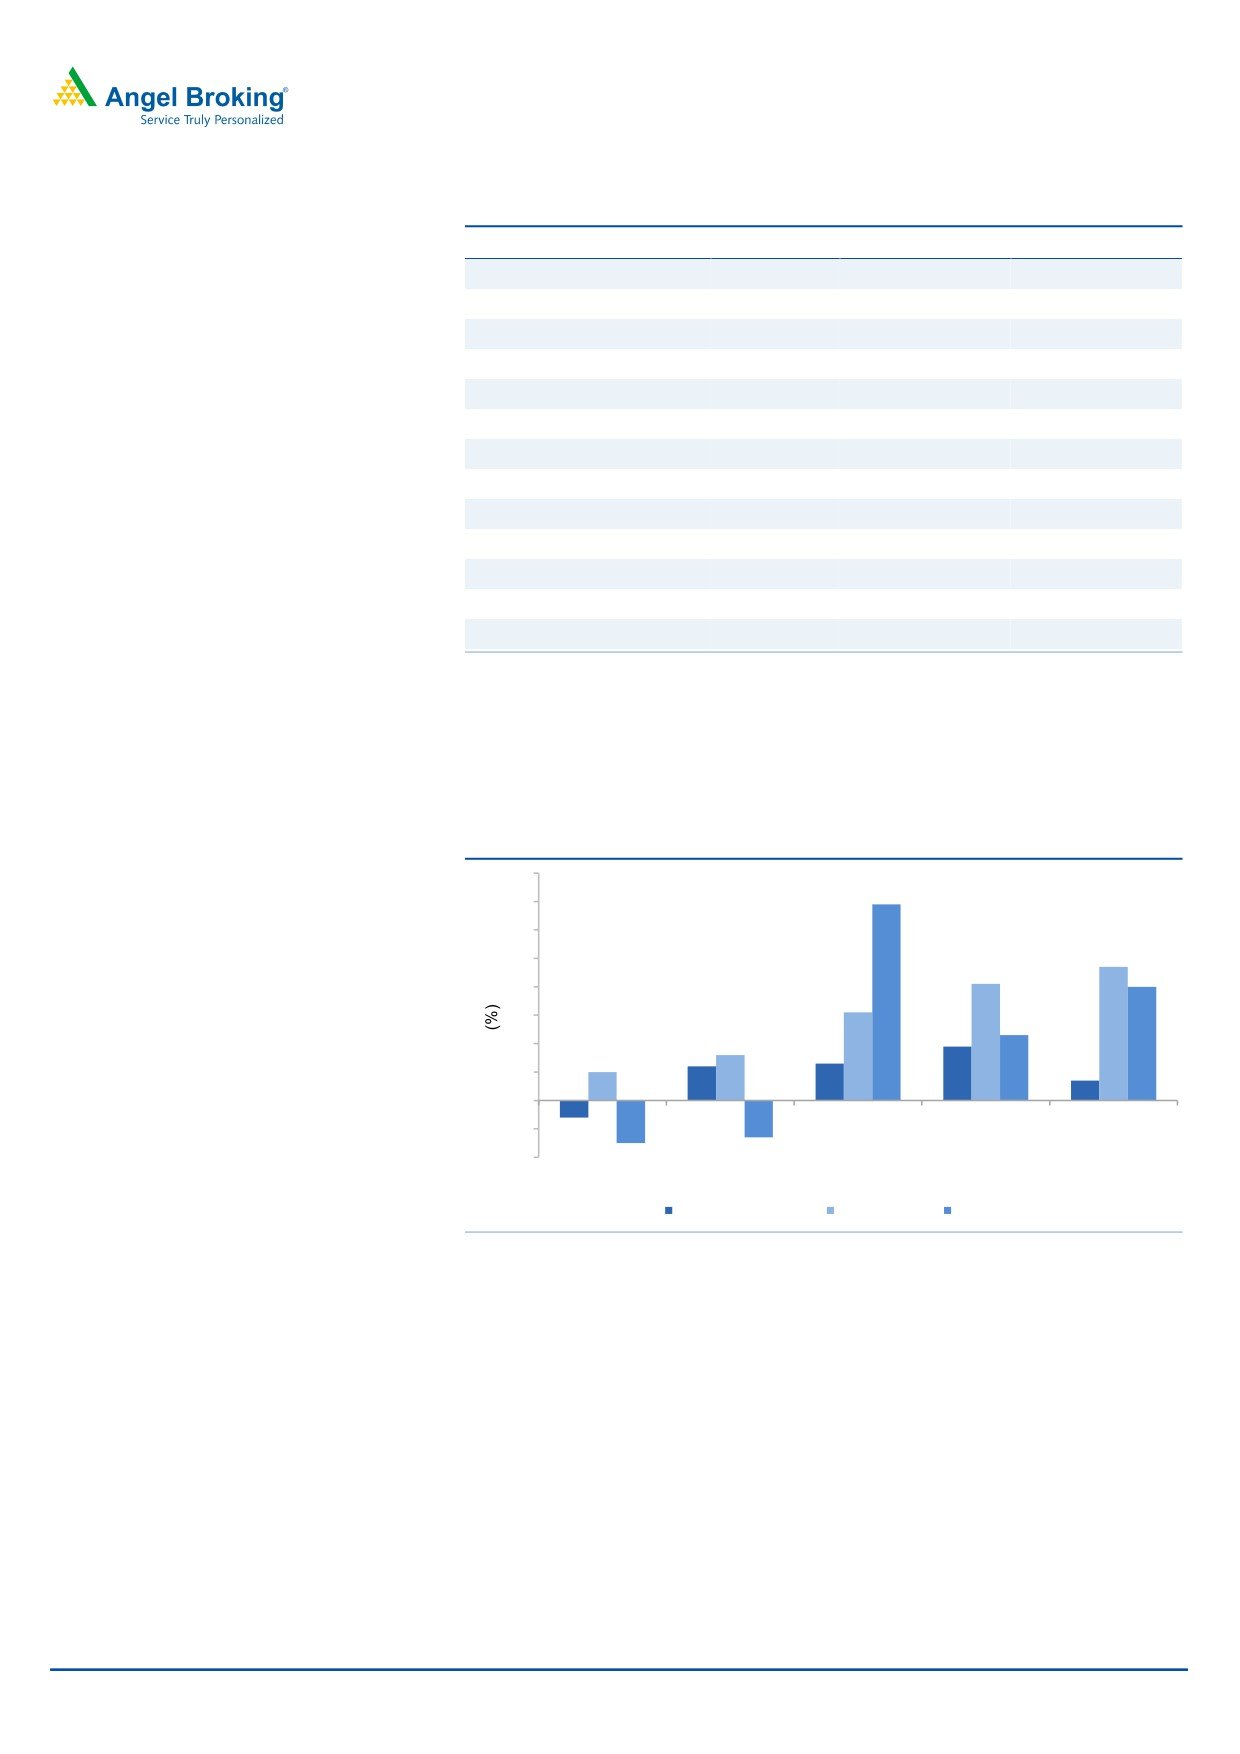
Exhibit 5: Growth trend in industry segments (Reported basis)
Particulars
% to revenue
% growth QoQ
% growth YoY
FSI
33.1
0.1
7.3
Banking and financial services
26.3
(1.6)
4.4
Insurance
6.8
7.3
20.4
Manufacturing
21.8
0.1
4.6
RCL
22.7
1.4
4.3
Retail and CPG
14.1
3.2
4.3
Transport and logistics
2.1
6.0
13.4
Life Sciences
4.6
(3.2)
8.0
Healthcare
1.9
(4.1)
(10.8)
ECS
22.4
2.8
16.9
Energy and utilities
5.8
6.5
25.3
Communication and services
10.5
2.0
24.6
Others
6.1
1.0
(0.2)
Source: Company, Angel Research
In terms of geographies, revenue from North America grew by 0.7% qoq in CC
terms, while other geographies such as Europe and RoW grew by 4.7% and 4.0%
qoq respectively (both in CC terms). India posted 5.9% qoq de-growth in CC terms.
Exhibit 6: USD growth trend in geographies qoq (CC basis)
8
6.9
7
6
4.7
5
4.1
4
4
3.1
3
2.3
1.9
2
1.2
1.6
1.3
1
1
0.7
0
(1)
(0.6)
(2)
(1.5)
(1.3)
3QFY17
4QFY17
1QFY18
2QFY18
3QFY18
North America
Europe
Rest of the world
Source: Company, Angel Research
January 16, 2018
4
Infosys | 3QFY2018 Result Update
Hiring and utilization
Infosys added 12,622 gross employees in 3QFY2018. The net addition for the
quarter stood at 3,251. Attrition (for consolidated entity) moved down in 3QFY2018;
it came at 18.7% (LTM) v/s. 21.4% in 2QFY2018.
Exhibit 7: Employee metrics
3QFY17 4QFY17 1QFY18 2QFY18 3QFY18
Gross addition
9,120
9,130
8,645
10,514
12,622
Net addition
(66)
601
(1,811)
(113)
3,251
Attrition - LTM basis (%)*
18.4
17.1
21.0
21.4
18.7
Source: Company, Angel Research, Note-* including subsidiaries
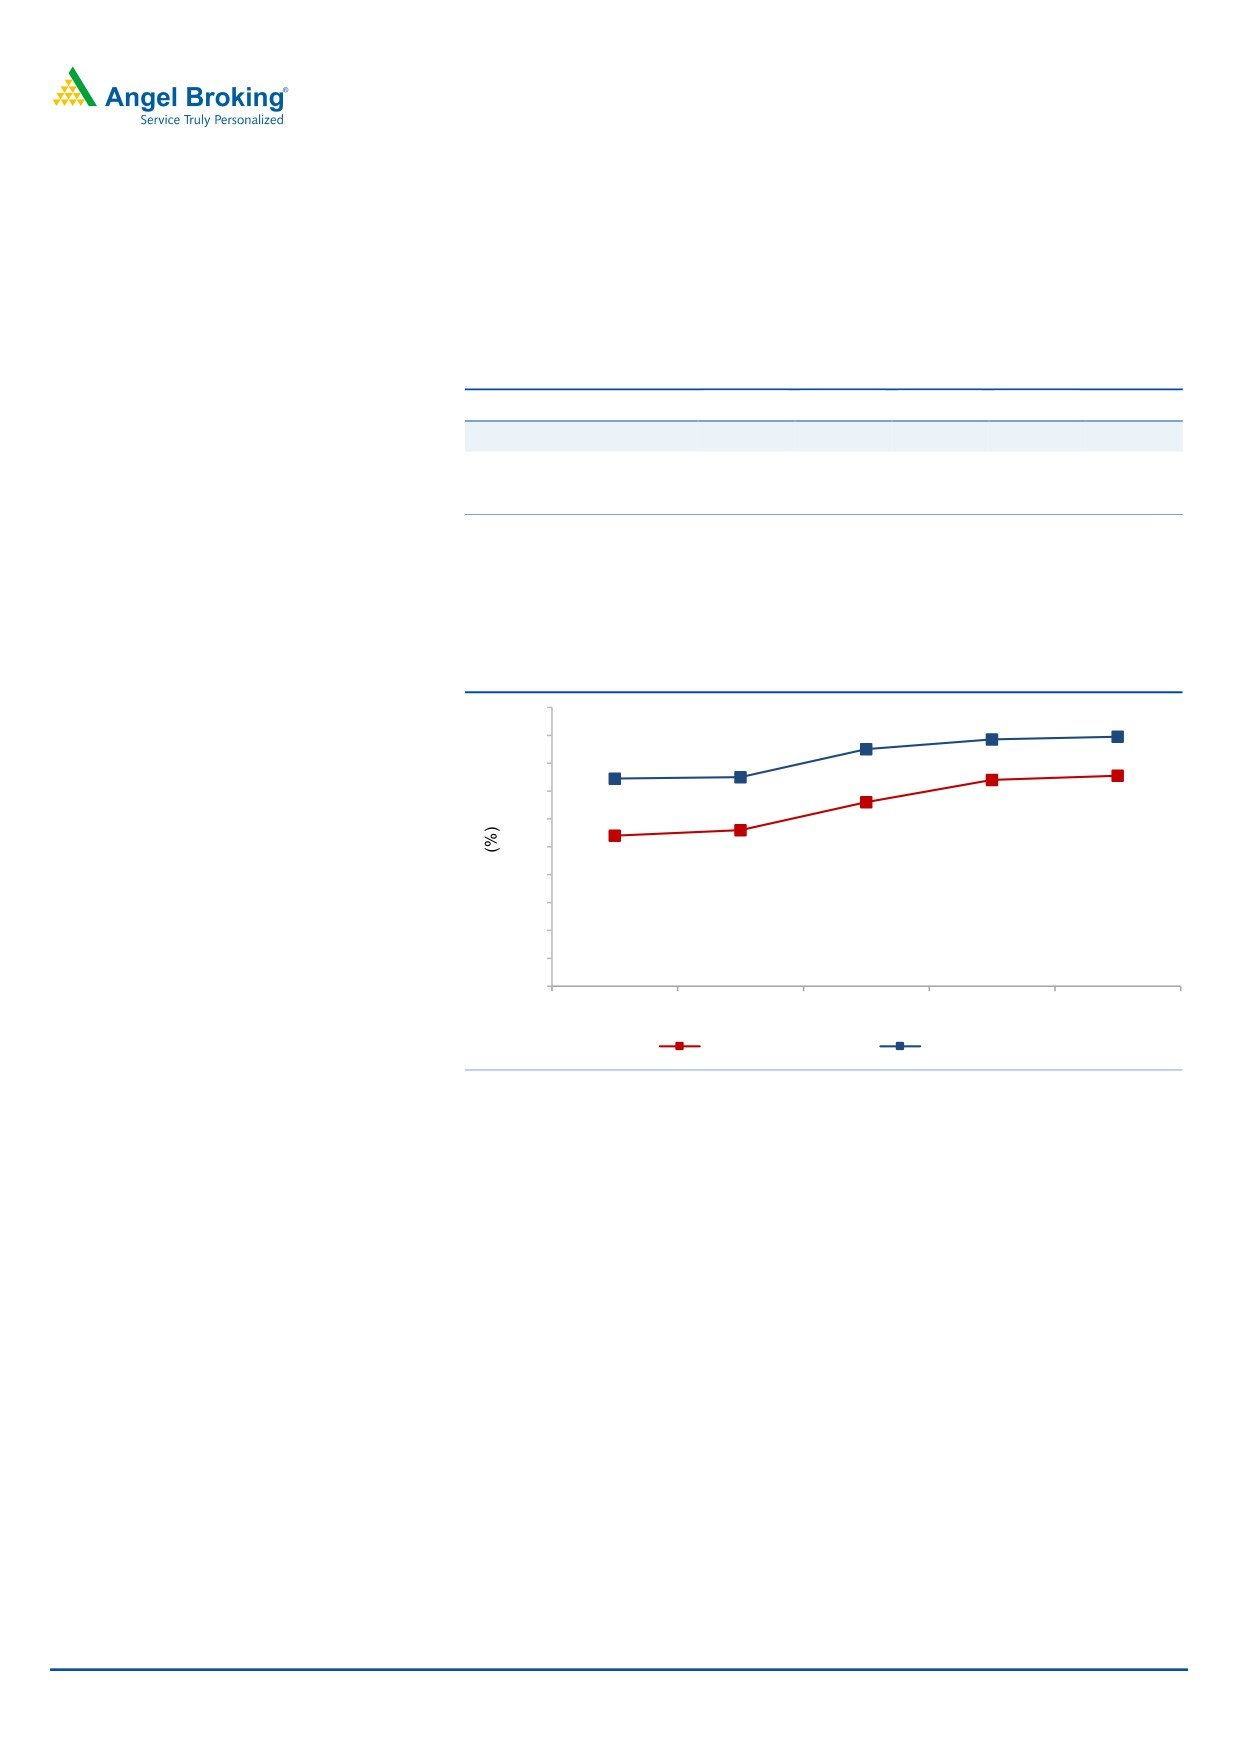
The utilization rate including trainees grew by 30bps qoq to 82.1% (81.8% in
2QFY2018); excluding trainees, it grew by 20bps qoq to 84.9%.
Exhibit 8: Trend in utilization (Services and Consulting + Projects)
87
84.7
84.9
84
85
81.9
82
83
81
81.8
82.1
79
80.2
77
77.8
78.2
75
73
71
69
67
3QFY17
4QFY17
1QFY18
2QFY18
3QFY18
Including trainees
Excluding trainees
Source: Company, Angel Research
Margins expand
On operating front, the EBITDA margins came in at 24.3% V/s 24.2% expected with
an uptick of 10bps qoq, on back of good volume growth and consequently better
employee (excluding trainees) utilization rate of 84.9% V/s 84.7% in 2QFY2018.
January 16, 2018
5
Infosys | 3QFY2018 Result Update
Exhibit 9: Trend in EBIT margin
60
26
40
50
25.1
20
20
25
0
10
24.6
(20)
(50)
24.3
(40)
23.7
24.2
24
(60)
(90)
(80)
(100)
23
3QFY17
4QFY17
1QFY18
2QFY18
3QFY18
Margin movement (qoq)
EBIT margin (%)
Source: Company, Angel Research
Client pyramid
Infosys added 79 new clients (gross additions) during the quarter, taking its
total active client base to 1,191. The client addition was across the board. The
company added 2 client in the US100+mn & 9 clients in the US$20+mn.
Exhibit 10: Client metrics
Particulars
3QFY17 4QFY17 1QFY18 2QFY18 3QFY18
Top client (% of revenue)
3.1
3.3
3.3
3.4
3.4
Gross Client addition
77
71
59
72
79
Active client
1152
1162
1164
1173
1191
US$1mn-5mn
316
316
327
334
340
US$5mn-10mn
80
93
89
100
92
US$10mn-20mn
97
98
93
86
97
US$20mn-50mn
36
35
41
45
45
US$50mn-100mn
22
25
25
24
22
US$100mn+
14
13
18
12
14
Source: Company, Angel Research
Investment arguments
Revenue guidance maintained for FY2018: The Management has given the
revenue growth guidance for FY2018, which is moderate. The company has
maintained its guidance of 6.5-8.5% CC growth earlier. The company faced multiple
challenges in FY2017, amongst which execution issues in Consulting and the loss
of the RBS contract were the major ones, resulting in a loss of revenue growth
momentum. For FY2017, the company posted 8.3% growth in CC terms V/s a
guidance of 8.4-8.8% growth (in CC terms). Currently, we have factored a growth
for FY2018 (INR and USD growth of 2.7% and 6.0% respectively). Over FY2017-19E,
we expect USD and INR revenue to grow at a CAGR of 7.0% and 5.3% respectively.
Operating margin likely to be range bound in near term: For FY2018, the
company has reiterated its guidance for EBIT margins of 23-25%, mainly factoring
January 16, 2018
6
Infosys | 3QFY2018 Result Update
in currency impact and investment in onsite facility. For FY2017, the EBIT margins
came in at 24.7%, which was against the guidance of 24-26%. Over FY2017-19E, we
expect an EBIT CAGR of 4.3%, with FY2018E and FY2019E EBIT margins expected to
come in at 24.1% respectively. The moderation in margin expected to be for the
near term, as the company plans to move towards automation, in order to
safeguard its EBIT margin pressures.
Outlook and valuation
The company has marinated its USD revenue growth guidance for FY2018 to
5.5-6.5% on CC basis. We expect the company to post ~6.5% USD revenue growth
in FY2018. The company has changed its capital allocation policy from paying out
50% of PAT to 70% of Free Cash Flow. The stock currently trades at a valuation of
16.0x its FY2019E earnings. We recommend a Neutral on the stock.
Exhibit 11: Key assumptions
Parameters
FY2018E
FY2019E
Revenue growth - USD terms (%)
6.5
8.0
USD-INR rate
65.0
65.0
Revenue growth - INR terms (%)
3.2
8.0
EBITDA margin (%)
26.5
26.5
Tax rate (%)
28.0
28.0
EPS growth (%)
0.9
6.8
Source: Company, Angel Research
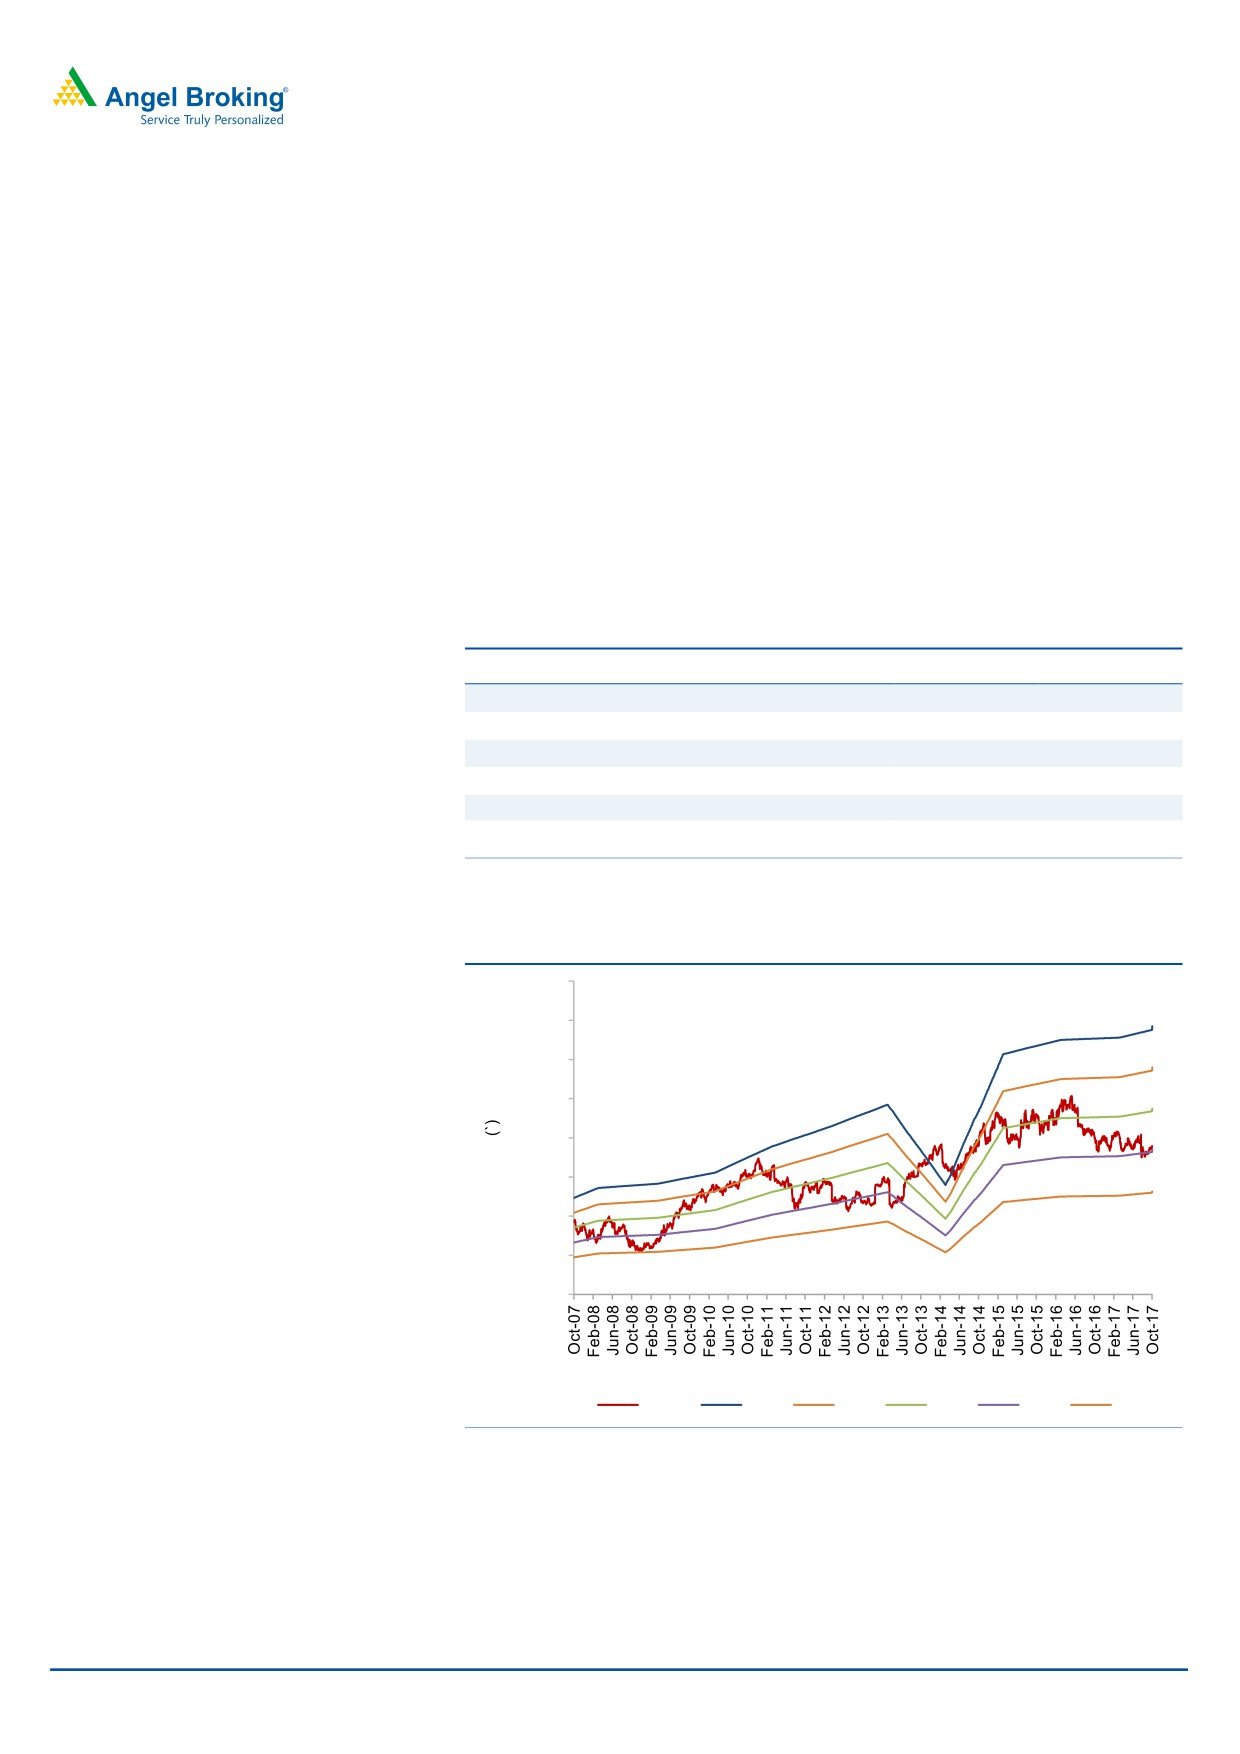
Exhibit 12: One-year forward PE (x)
2000.0
1750.0
1500.0
1250.0
1000.0
750.0
500.0
250.0
0.0
Price
26x
22x
18x
14x
10x
Source: Company, Angel Research
January 16, 2018
7
Infosys | 3QFY2018 Result Update
Exhibit 13: Recommendation summary
Company
Reco
CMP Tgt. price
Upside
FY2019E FY2019E
FY2017-19E
FY2019E
FY2019E
(`)
(`)
(%) EBITDA (%)
P/E (x)
EPS CAGR (%) EV/Sales (x)
RoE (%)
HCL Tech
Accumulate
907
1,014
11.8
22.1
13.4
6.2
1.9
20.6
Infosys
Neutral
1,080
-
-
26.5
16.0
3.8
2.6
18.7
TCS
Reduce
2,747
2,493
(9.3)
26.3
18.7
3.4
3.5
28.3
Tech Mahindra
Neutral
544
-
-
15.0
14.5
8.6
1.3
16.2
Wipro
Reduce
316
280
(11.5)
22.3
16.2
4.4
1.8
13.6
Source: Company, Angel Research
Company Background
Infosys is the second largest IT company in India, employing over
2,00,364
professionals (as of FY2017). The company services more than 1,000 clients across
various verticals, such as financial services, manufacturing, telecom, retail and
healthcare. Infosys has the widest portfolio of service offerings amongst Indian IT
companies, spanning across the entire IT service value chain - from traditional
Application Development and Maintenance to Consulting and Package
Implementation to Products and Platforms.
January 16, 2018
8
Infosys | 3QFY2018 Result Update
Profit and loss statement (IFRS, consolidated)
Y/E March (` cr)
FY2014
FY2015
FY2016
FY2017
FY2018E FY2019E
Net sales
50,133
53,319
62,441
68,484
70,665
76,318
Cost of revenue
30,767
31,817
37,595
41,550
35,686
38,541
Gross profit
19,366
21,502
24,846
26,934
27,206
29,382
% of net sales
38.6
40.3
39.8
39.3
38.5
38.5
Selling and mktg exp.
2,625
2,941
3,431
3,591
3,887
4,197
% of net sales
5.2
5.5
5.5
5.2
5.5
5.5
General and admin exp.
3,107
3,663
4,292
4,739
4,593
4,961
% of net sales
6.2
6.9
6.9
6.9
6.5
6.5
EBITDA
13,634
14,898
17,123
18,604
18,726
20,224
% of net sales
27.2
27.9
27.4
27.2
26.5
26.5
Dep and amortization
1,374
1,066
1,503
1,703
1,696
1,832
% of net sales
2.7
2.0
2.4
2.5
2.4
2.4
EBIT
12,260
13,832
15,620
16,901
17,030
18,393
% of net sales
24.5
25.9
25.0
24.7
24.1
24.1
Other income
2,669
3,427
3,122
3,080
3,080
3,080
Profit before tax
14,929
17,259
18,742
19,981
20,110
21,473
Provision for tax
4,062
4,929
5,251
5,598
5,631
6,012
% of PBT
27.2
28.6
28.0
28.0
28.0
28.0
PAT
10,648
12,330
13,491
14,383
14,479
15,460
Exceptional item
219
-
-
(30)
-
-
Adj. PAT
10,867
12,330
13,491
14,353
14,479
15,460
EPS (`)
47.3
53.7
59.0
62.5
63.1
67.3
January 16, 2018
9
Infosys | 3QFY2018 Result Update
Balance sheet (IFRS, consolidated)
Y/E March (` cr)
FY2014
FY2015
FY2016
FY2017
FY2018E FY2019E
Current assets
Cash and cash equivalents
25,950
30,367
32,697
22,625.0
33,054.0
37,750.0
Available for sale fin. assets
2,197
874
75
9,970
9,970
9,970
Invest. in certificates of deposit
859
93
103
71
71
71
Trade receivables
8,351
9,713
11,330
12,322
11,872
12,821
Unbilled revenue
2,811
2,845
3,029
3,648
3,648
3,648
Derivative financial instrum.
215
101
116
284
284
284
Prepayments and other CA
2,636
3,296
4,448
4,856
4,099
4,426
Total current assets
43,019
47,289
51,798
53,776
62,997
68,971
Non-current assets
Property, plant and equipm.
7,887
9,125
10,530
11,716
11,916
12,116
Goodwill
2,157
3,091
3,764
3,652
2,157
2,158
Intangible assets
342
638
985
776
342
343
Available for sale fin. Assets
1,252
1,345
1,811
6,382
1,252
1,253
Deferred income tax assets
656
537
536
540
656
657
Income tax assets
1,522
4,089
5,230
5,716
5,716
5,716
Other non-current assets
220
238
735
797
1,793
1,794
Total non-current assets
14,036
19,063
23,591
29,579
23,832
24,037
Total assets
57,055
66,352
75,389
83,355
86,829
93,008
Current liabilities
Trade payables
173
140
386
367
173
174
Derivative financial instrum.
-
3
5
2
-
1
Current income tax liabilities
2,187
2,818
3,410
3,885
3,787
3,788
Client deposits
40
27
28
32
40
41
Unearned revenue
660
1,052
1,332
1,777
660
661
Employee benefit obligations
954
1,069
1,341
1,359
954
955
Provisions
379
478
512
405
379
380
Other liabilties
4,745
5,796
6,225
6,186
5,545
5,546
Total current liabilities
9,138
11,383
13,239
14,013
11,538
11,546
Non-current liabilities
Deferred income tax liabilties
64
160
256
207
64
65
Employee benefit obligations
323
46
115
153
323
324
Other liabilities
-
-
-
-
-
-
Total non-current liabilities
387
206
371
360
387
388
Total liabilities
9,525
11,589
13,610
14,373
11,925
11,934
Equity
Share capital
286
572
1,144
1,144
1,144
1,144
Share premium
3,090
3,090
2,241
2,356
2,356
2,356
Retained earnings
43,584
50,531
57,655
65,056
70,833
77,002
Other components of equity
570
570
739
426
571
572
Total equity
47,530
54,763
61,779
68,982
74,904
81,074
Total liabilties and equity
57,055
66,352
75,389
83,355
86,829
93,008
January 16, 2018
10
Infosys | 3QFY2018 Result Update
Cash flow statement (IFRS, consolidated)
Y/E March (` cr)
FY2014 FY2015 FY2016 FY2017 FY2018E FY2019E
Pre tax profit from operations
12,260
13,832
15,620
16,901
17,030
18,393
Depreciation
1,374
1,066
1,503
1,703
1,696
1,832
Pre tax cash from operations
13,634
14,898
17,123
18,604
18,726
20,224
Other income/prior period ad
2,669
3,427
3,122
3,080
3,080
3,080
Net cash from operations
16,303
18,325
20,245
21,684
21,806
23,304
Tax
4,062
4,929
5,251
5,598
5,631
6,012
Cash profits
12,241
13,396
14,994
16,086
16,175
17,292
(Inc)/dec in current assets
(2,271)
(1,942)
(2,968)
(2,187)
1,208
(1,278)
Inc/(dec) in current liabilties
2,852
2,245
1,856
774
(2,475)
8
(Inc)/dec in net trade WC
581
303
(1,112)
(1,413)
(1,267)
(1,270)
12,822
13,699
13,882
14,673
14,908
16,022
Cashflow from operating actv.
(Inc)/dec in fixed assets
(2,793)
(2,304)
(2,908)
(2,889)
(1,896)
(2,032)
(Inc)/dec in investments
(1,317)
2,089
789
(9,863)
-
-
(inc)/dec in sale of financial assets
(858)
(93)
(466)
(4,571)
5,130
(1)
(Inc)/dec in deferred tax assets
(583)
(2,448)
(1,140)
(490)
(116)
(1)
119
(181)
165
(11)
27
1
Inc/(dec) in other non current liab.
(Inc)/dec in other non current ass.
(138)
(1,248)
(1,517)
259
933
(3)
Cashflow from investing actv.
(5,570)
(4,185)
(5,077)
(17,565)
4,078
(2,036)
Inc/(dec) in debt
-
-
-
-
-
-
Inc/(dec) in equity/premium
1,099
450
889
515
(404)
(1,242)
4,233
5,547
7,364
7,695
8,153
8,049
Dividends
Cashflow from financing actv.
(3,134)
(5,097)
(6,475)
(7,180)
(8,557)
(9,291)
Cash generated/(utilised)
4,118
4,417
2,330
(10,072)
10,429
4,696
Cash at start of the year
21,832
25,950
30,367
32,697
22,625
33,054
Cash at end of the year
25,950
30,367
32,697
22,625
33,054
37,750
January 16, 2018
11
Infosys | 3QFY2018 Result Update
Key ratios
Y/E March
FY2014 FY2015 FY2016 FY2017 FY2018E FY2019E
Valuation ratio (x)
P/E
22.8
20.1
18.3
17.3
17.1
16.0
P/CEPS
20.3
18.5
16.5
15.4
15.3
14.3
P/BVPS
5.2
4.5
4.0
3.6
3.3
3.1
Dividend yield (%)
1.5
1.7
2.3
2.3
2.9
3.1
EV/Sales
4.3
4.0
3.4
3.1
2.9
2.6
EV/EBITDA
16.0
14.5
12.5
11.5
10.9
9.8
EV/Total assets
3.8
3.2
2.8
2.6
2.3
2.1
Per share data (`)
EPS
47
54
59
63
63
67
53
58
65
70
70
75
Cash EPS
Dividend
16
19
25
25
32
34
Book value
207
239
269
300
326
353
Dupont analysis
Tax retention ratio (PAT/PBT)
0.7
0.7
0.7
0.7
0.7
0.7
1.2
1.2
1.2
1.2
1.2
1.2
Cost of debt (PBT/EBIT)
EBIT margin (EBIT/Sales)
0.2
0.3
0.3
0.2
0.2
0.2
Asset turnover ratio (Sales/Assets)
0.9
0.8
0.8
0.8
0.8
0.8
Leverage ratio (Assets/equity)
1.2
1.2
1.2
1.2
1.2
1.1
Operating ROE
22.4
22.5
21.8
20.9
19.3
19.1
Return ratios (%)
RoCE (pre-tax)
21.5
20.8
20.7
20.3
19.6
19.8
Angel RoIC
43.7
39.5
36.7
33.3
38.9
40.7
RoE
22.9
22.5
21.8
20.8
19.3
19.1
Turnover ratios(x)
6.4
5.8
5.9
5.8
5.9
6.3
Asset turnover (fixed assets)
Receivables days
81
86
84
85
80
79
January 16, 2018
12
Infosys | 3QFY2018 Result Update
Research Team Tel: 022 - 39357800
DISCLAIMER
Angel Broking Private Limited (hereinafter referred to as “Angel”) is a registered Member of National Stock Exchange of India Limited,
Bombay Stock Exchange Limited and Metropolitan Stock Exchange Limited. It is also registered as a Depository Participant with CDSL
and Portfolio Manager with SEBI. It also has registration with AMFI as a Mutual Fund Distributor. Angel Broking Private Limited is a
registered entity with SEBI for Research Analyst in terms of SEBI (Research Analyst) Regulations, 2014 vide registration number
INH000000164. Angel or its associates has not been debarred/ suspended by SEBI or any other regulatory authority for accessing
/dealing in securities Market. Angel or its associates/analyst has not received any compensation / managed or co-managed public
offering of securities of the company covered by Analyst during the past twelve months.
This document is solely for the personal information of the recipient, and must not be singularly used as the basis of any investment
decision. Nothing in this document should be construed as investment or financial advice. Each recipient of this document should make
such investigations as they deem necessary to arrive at an independent evaluation of an investment in the securities of the companies
referred to in this document (including the merits and risks involved), and should consult their own advisors to determine the merits
and risks of such an investment.
Reports based on technical and derivative analysis center on studying charts of a stock's price movement, outstanding positions and
trading volume, as opposed to focusing on a company's fundamentals and, as such, may not match with a report on a company's
fundamentals. Investors are advised to refer the Fundamental and Technical Research Reports available on our website to evaluate the
contrary view, if any
The information in this document has been printed on the basis of publicly available information, internal data and other reliable
sources believed to be true, but we do not represent that it is accurate or complete and it should not be relied on as such, as this
document is for general guidance only. Angel Broking Pvt. Limited or any of its affiliates/ group companies shall not be in any way
responsible for any loss or damage that may arise to any person from any inadvertent error in the information contained in this report.
Angel Broking Pvt. Limited has not independently verified all the information contained within this document. Accordingly, we cannot
testify, nor make any representation or warranty, express or implied, to the accuracy, contents or data contained within this document.
While Angel Broking Pvt. Limited endeavors to update on a reasonable basis the information discussed in this material, there may be
regulatory, compliance, or other reasons that prevent us from doing so.
This document is being supplied to you solely for your information, and its contents, information or data may not be reproduced,
redistributed or passed on, directly or indirectly.
Neither Angel Broking Pvt. Limited, nor its directors, employees or affiliates shall be liable for any loss or damage that may arise from
or in connection with the use of this information.
Disclosure of Interest Statement
Infosys
1. Financial interest of research analyst or Angel or his Associate or his relative
No
2. Ownership of 1% or more of the stock by research analyst or Angel or associates or relatives
No
3. Served as an officer, director or employee of the company covered under Research
No
4. Broking relationship with company covered under Research
No
Ratings (Based on expected returns
Buy (> 15%)
Accumulate (5% to 15%)
Neutral (-5 to 5%)
over 12 months investment period):
Reduce (-5% to -15%)
Sell (< -15)
January 16, 2018
13