2QCY2016 Result Update | Pharmaceutical
July 26, 2016
Sanofi India
NEUTRAL
CMP
`4,582
Performance Highlights
Target Price
-
Y/E Dec. (` cr)
2QCY2016 1QCY2016
% chg (qoq) 2QCY2015
% chg (yoy)
Investment Period
-
Net sales
565
506
11.7
514
9.9
Other income
59
64
(7.2)
45
30.5
Stock Info
Operating profit
103
91
13.3
86
19.9
Sector
Pharmaceutical
Adj. Net profit
85
81
5.8
64
32.9
Market Cap (` cr)
10,553
Source: Company, Angel Research
Net debt (` cr)
(531)
Beta
0.5
Sanofi India (Sanofi) posted a robust set of numbers for 2QCY2016. It posted a
52 Week High / Low
4,770/3,676
9.9% yoy growth in sales to `565cr, although the same are lower than our
Avg. Daily Volume
2,356
expectation. The bottom-line came in higher than our expectation on the back of
Face Value (`)
10
a 30.5% surge in other income during the quarter. On the operating front, the
BSE Sensex
28,095
company reported a gross margin of 50.5% V/s 48.3% in 2QCY2015, which
Nifty
8,636
resulted in an OPM of 18.2% V/s 16.7% in 2QCY2015. The proportionate
Reuters Code
SANO.BO
expansion in the OPM was less than that in the gross margin as other expenses
Bloomberg Code
SANL@IN
rose by 15.6% yoy during the quarter. The net profit for the quarter came in at
`85.3cr V/s `64.2cr in 2QCY2015. We maintain our Neutral rating on the
stock.
Shareholding Pattern (%)
Promoters
60.4
Sales underperform: For the quarter, the company posted sales of `565cr, a yoy
MF / Banks / Indian Fls
15.1
growth of 9.9%. Gross margin stood at 50.5% V/s 48.3% in 2QCY2015, which
FII / NRIs / OCBs
14.3
enabled the company to post an OPM of 18.2% V/s 16.7% in 2QCY2015. The
Indian Public / Others
10.2
proportionate expansion in the OPM was less than that in the gross margin, as
other expenses rose by 15.6% yoy during the quarter. Expansion in OPM along
with a 30.5% yoy growth in other income aided the net profit to come in at
Abs. (%)
3m 1yr
3yr
`85.3cr V/s `64.2cr in 2QCY2015.
Sensex
9.4
(0.1)
39.8
Outlook and valuation: We expect net sales to post a 14.6% CAGR to `2,692cr
Sanofi India
10.5
22.7
93.4
and EPS to register a 21.2% CAGR to `169.2 over CY2015-17E. At the current
levels, the stock is trading at 29.9x and 27.1x its CY2016E and CY2017E
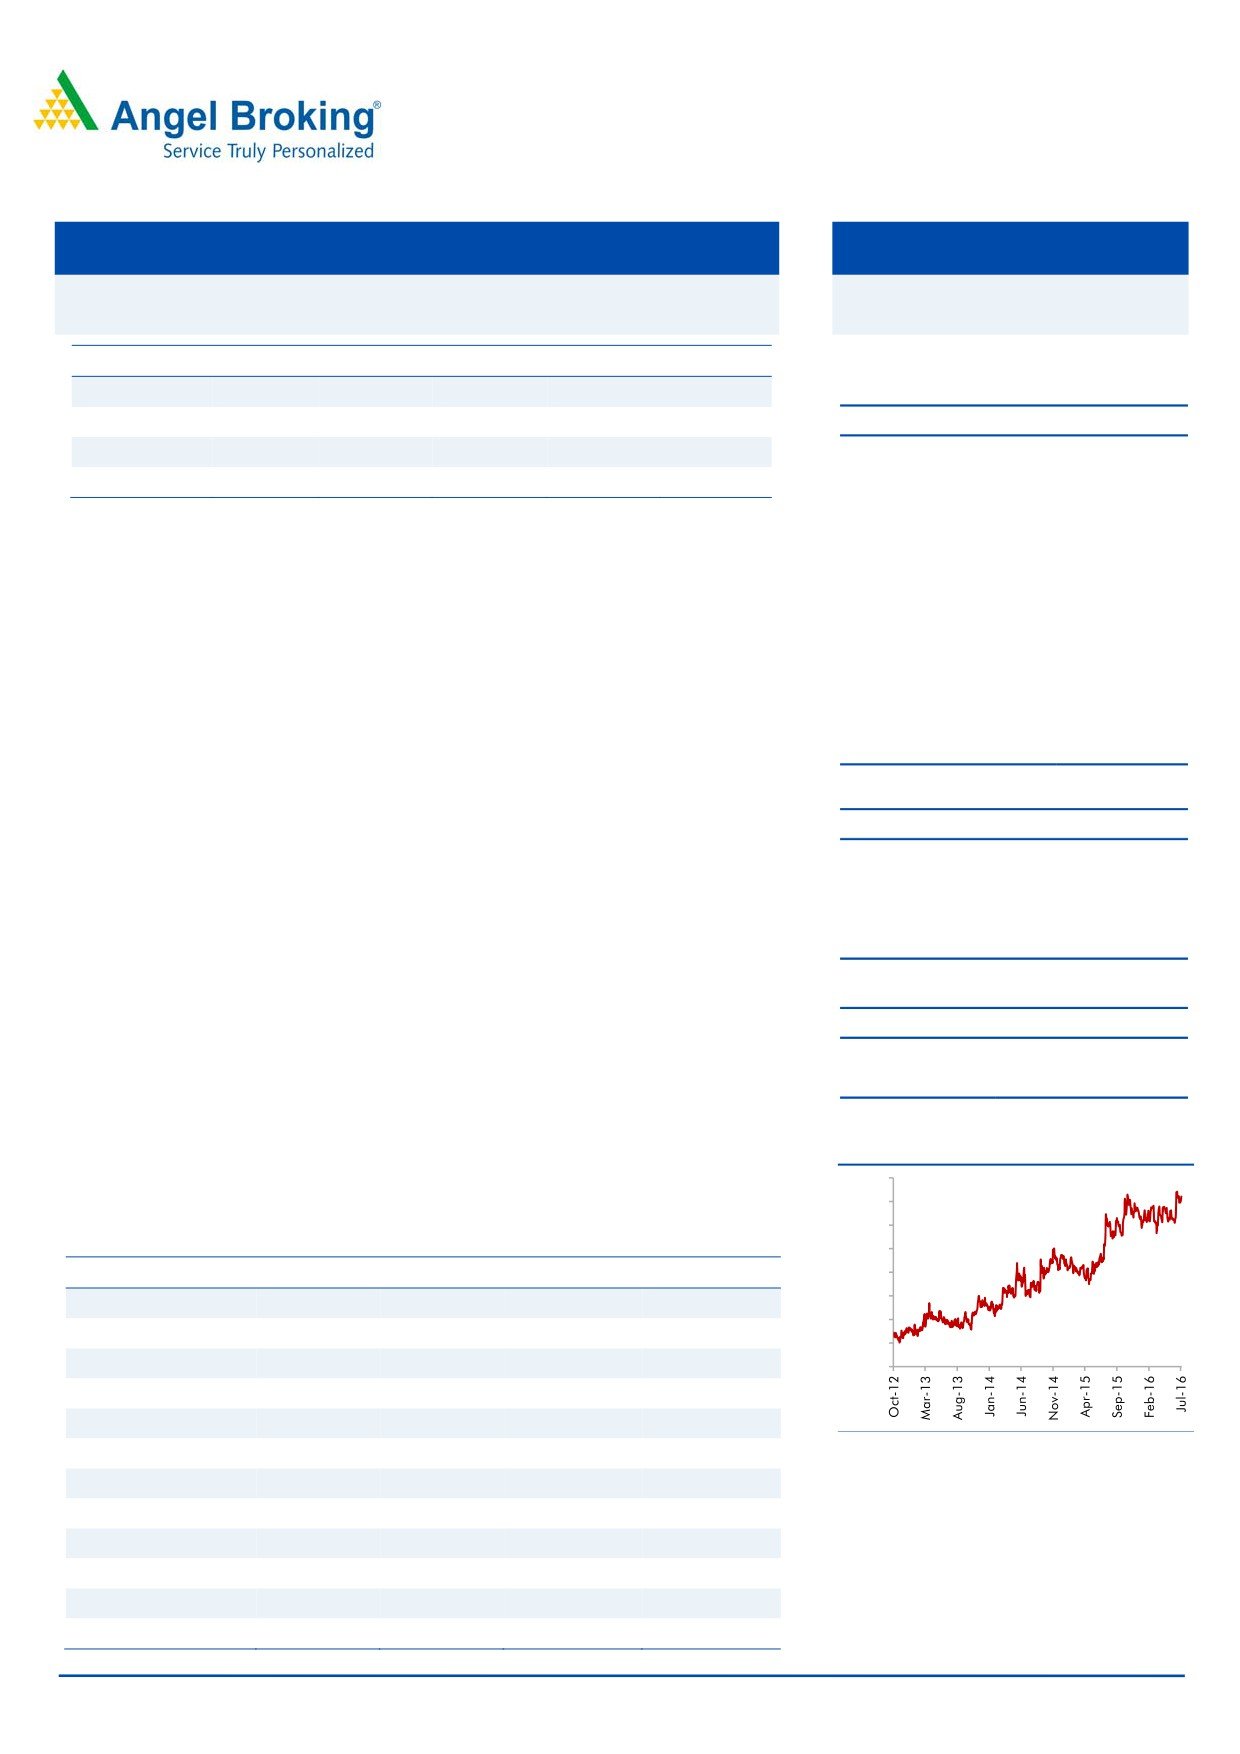
3-year price chart
earnings, respectively. Given the fuller valuations, we recommend a Neutral rating
4,900
4,500
on the stock.
4,100
Key financials
3,700
Y E Dec (` cr)
CY2014
CY2015
CY2016E
CY2017E
3,300
2,900
Net Sales
1,875
2,049
2,357
2,692
2,500
% chg
9.9
9.3
15.0
14.2
2,100
Net Profit
197.1
264.9
353.0
389.2
1,700
% chg
(17.8)
34.4
33.3
10.2
EPS (`)
85.6
115.2
153.5
169.2
EBITDA (%)
12.6
15.4
17.3
17.3
Source: Company, Angel Research
P/E (x)
53.5
39.8
29.9
27.1
RoE (%)
14.4
19.3
25.8
28.4
RoCE (%)
10.2
14.8
20.9
24.9
P/BV (x)
7.1
6.5
5.1
4.1
Sarabjit Kour Nangra
EV/Sales (x)
5.4
4.9
4.1
3.4
+91 22 3935 7800 Ext: 6806
EV/EBITDA (x)
42.7
31.6
23.8
19.5
Source: Company, Angel Research; Note: CMP as of July 25, 2016
Please refer to important disclosures at the end of this report
1
Sanofi India | 2QCY2016 Result Update
Exhibit 1: 2QCY2016 performance
Y/E Dec (` cr)
2QCY2016
1QCY2016
% chg (QoQ) 2QCY2015
% chg (YoY) 1HCY16 1HCY15
% chg yoy
Net sales
565
506
11.7
514
9.9
1,072
974
10.0
Other income
59
64
(7.2)
45
30.5
123
94
30.6
Total income
624
570
9.5
560
11.6
1,194
1,068
11.8
PBIDT
103
91
13.3
86
19.9
194
140
38.6
OPM (%)
18.2
18.0
16.7
18.1
14.4
Interest
0.7
0.1
0.1
1
0
Depreciation & amortisation
30
30
(0.3)
28
5.6
60
54
11.3
PBT & exceptional items
132
125
5.6
103
27.9
256
180
42.2
Less : Exceptional items
0
0
0
0
(16)
Profit before tax
132
125
5.6
103
27.9
256
196
30.6
Provision for taxation
46
44
5.2
39
19.7
90
67
34.5
Net profit
85
81
5.8
64
32.9
166
129
28.6
Adj net profit
85
81
5.8
64
32.9
166
129
28.6
EPS (`)
37.1
35.0
27.9
72.1
56.1
Source: Company, Angel Research
Exhibit 2: 2QCY2016 - Actual Vs Angel estimates
` cr
Actual
Estimates
Variation (%)
Net sales
565
600
(5.8)
Other income
59
45
30.5
Operating profit
103
104
(0.7)
Tax
46
42
10.6
Net profit
85
77
10.4
Source: Company, Angel Research
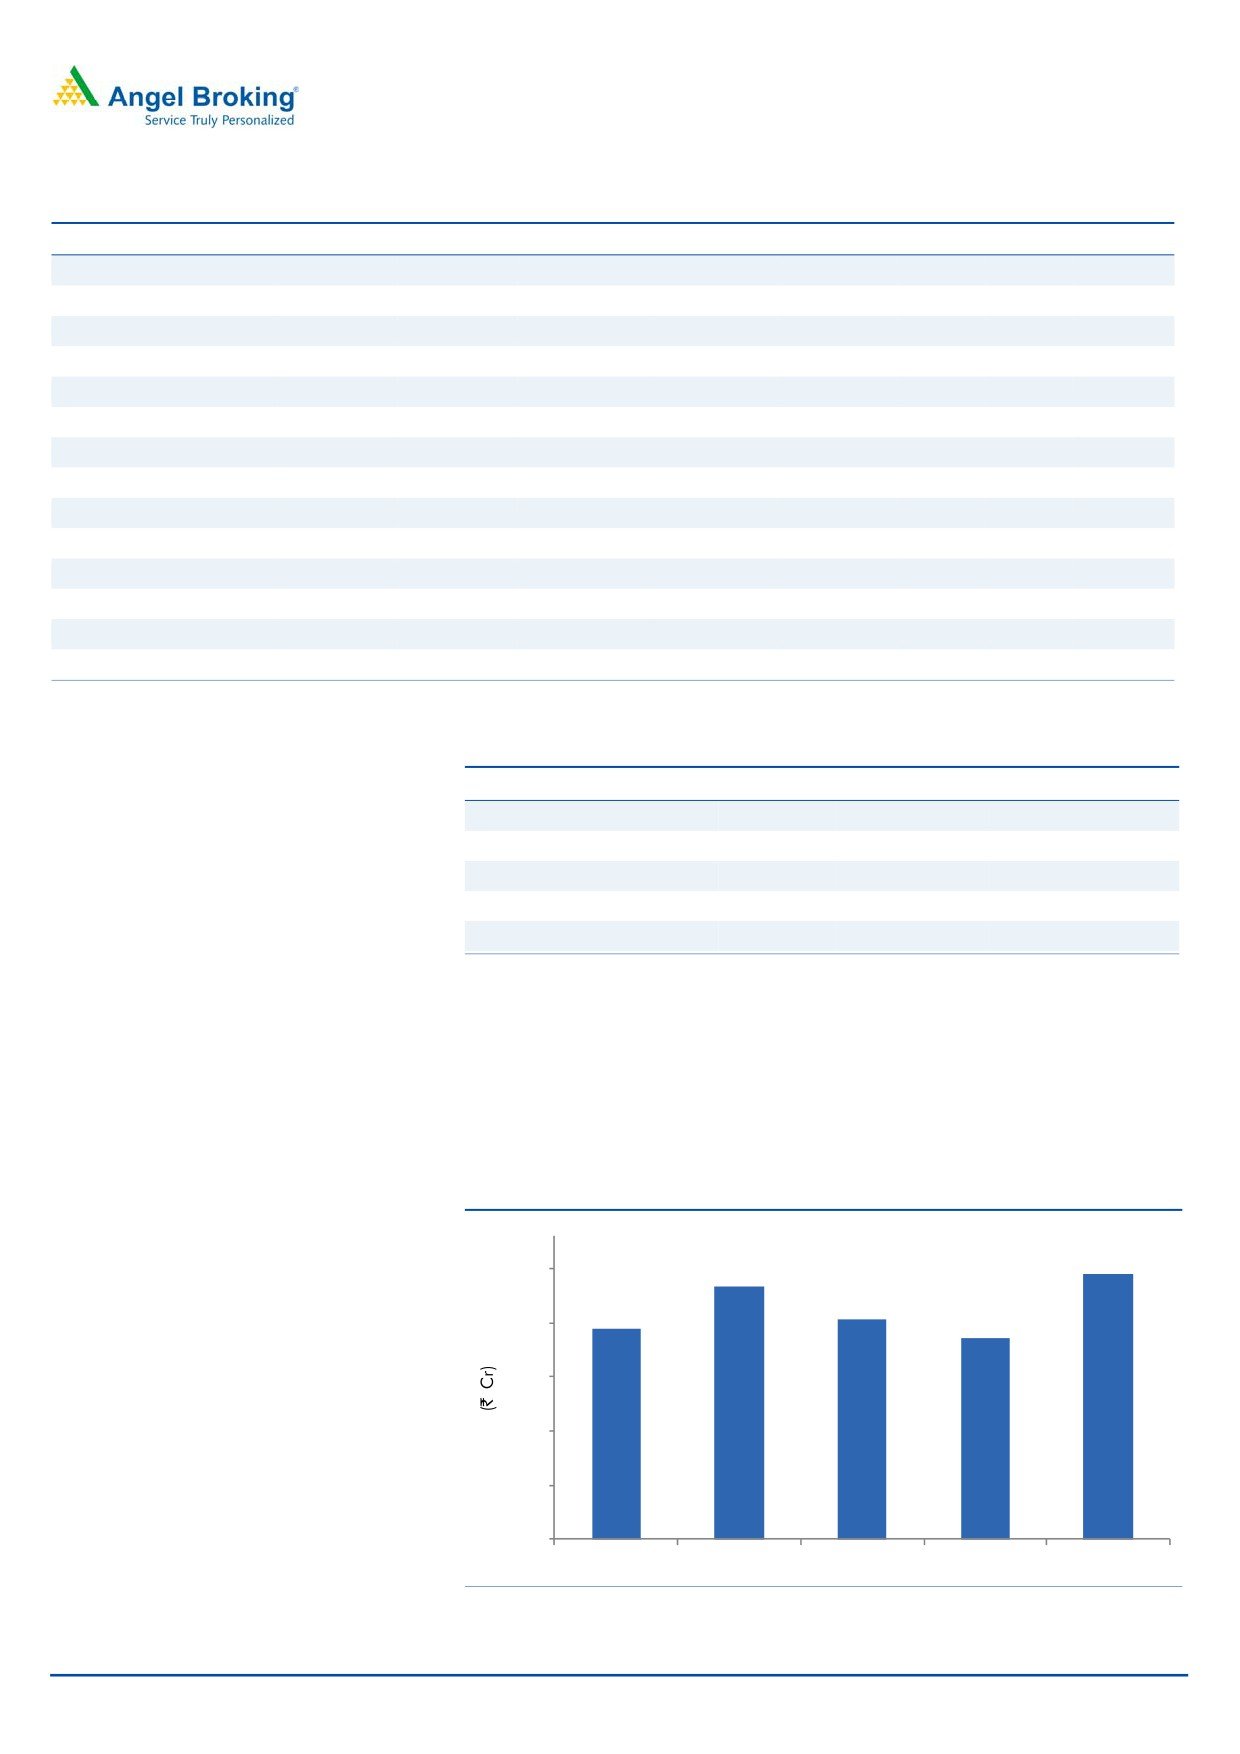
Revenue growth lower than expectation: - The company posted a 9.9% yoy growth
in sales of `565cr, which is lower than our expectation of `600cr, mainly impacted
by the fixed dose combination ban and on account of National List of Essential
Medicines (NLEM) getting enforced. We expect the near term performance of the
company to continue to be impacted on this account.
Exhibit 3: Sales trend
565
570
553
522
514
520
506
470
420
370
320
2QCY2015
3QCY2015
4QCY2015
1QCY2016
2QCY2016
Source: Company, Angel Research
July 26, 2016
2
Sanofi India | 2QCY2016 Result Update
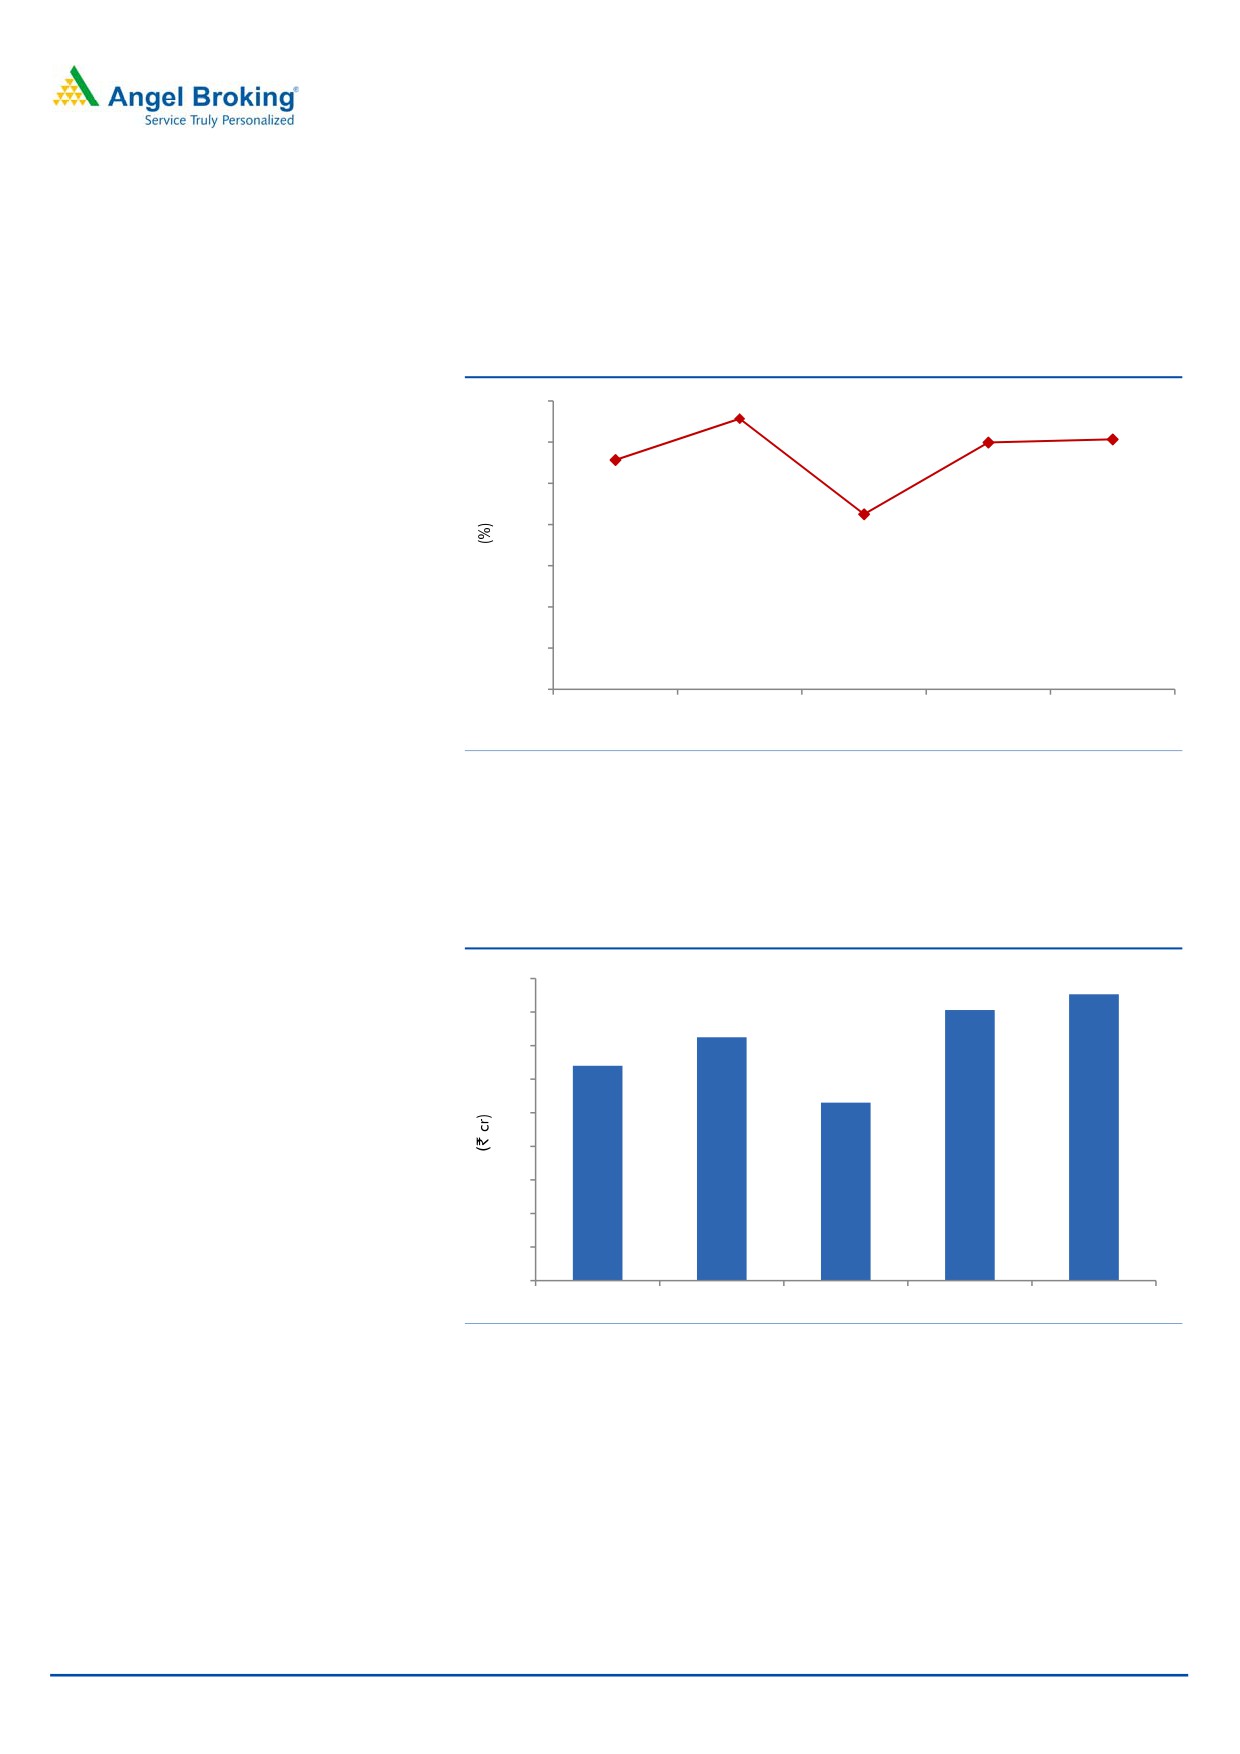
OPM expands to 18.2%: On the operating front, gross margin came in at 50.5%
V/s 48.3% in 2QCY2015, which enabled the company to post an OPM of 18.2%
V/s 16.7% in 2QCY2015. The proportionate expansion in the OPM was less than
that in the gross margin, as other expenses rose by 15.6% yoy during the quarter.
Exhibit 4: OPM trend
21.0
19.7
18.0
16.7
18.2
18.0
15.0
12.0
12.7
9.0
6.0
3.0
0.0
2QCY2015
3QCY2015
4QCY2015
1QCY2016
2QCY2016
Source: Company, Angel Research
Bottom-line higher than expected: The expansion in the OPM along with a 30.5%
yoy growth in other income (at `59cr V/s `45cr in 2QCY2015) aided the net profit
to come in at `85cr V/s `64cr in 2QCY2015 and V/s `77cr expected.
Exhibit 5: Adj. net profit trend
90
85
81
80
73
70
64
60
53
50
40
30
20
10
0
2QCY2015
3QCY2015
4QCY2015
1QCY2016
2QCY2016
Source: Company, Angel Research
July 26, 2016
3
Sanofi India | 2QCY2016 Result Update
Recommendation rationale
Focus on top-line growth: Sanofi recorded a revenue CAGR of 9.1% over
CY2006-12 to `1,494cr. The growth could have been better but was impacted by
a lower-than-expected growth in domestic formulations and loss of distribution
rights of Rabipur vaccine. Going forward, to grow in line with the industry’s
average growth rate in the domestic segment, the company has rolled out a
project - Prayas, an initiative to increase its penetration in rural areas. Under the
project, the company would launch low-priced products in the anti-infective and
NSAID therapeutic segments and increase its field force. The project is expected to
provide incremental revenue of `500cr over the next five years.
Sanofi also plans to launch CVS and vaccine products in the domestic market post
the acquisition of Shantha Biotech by its parent company. Further, during CY2011,
the company acquired the nutraceutical business of Universal Medicare Pvt. Ltd,
which led the company’s foray into the nutarceutical business, thus aiding it in
diversifying, and boosting overall growth of its domestic formulation business.
Recently the government expanded the NLEM and banned ~344 fixed drug
combinations (FDCs), which will impact the industry’s growth. Overall, we expect
the company’s net sales to log a 15.0% CAGR over CY2015-17, with domestic
formulation sales expected to post a yoy growth of around 15.0% during the
period.
Valuation: We expect net sales to post a 14.6% CAGR to `2,692cr and EPS to
register a 21.2% CAGR to `169.2 over CY2015-17. At current levels, the stock is
trading at 29.3x and 26.6x its CY2016E and CY2017E earnings, respectively. Given
the fuller valuations, we recommend a neutral rating on the stock.
Exhibit 6: Key assumptions
CY2016E
CY2017E
Net sales growth (%)
15.7
14.2
Domestic sales growth (%)
15.0
15.0
Export sales growth (%)
10.0
10.0
Growth in employee expenses (%)
15.7
14.2
Operating margins (%)
17.3
17.3
Net profit growth (%)
33.3
10.2
Capex (` cr)
30.0
30.0
Source: Company, Angel Research
July 26, 2016
4
Sanofi India | 2QCY2016 Result Update
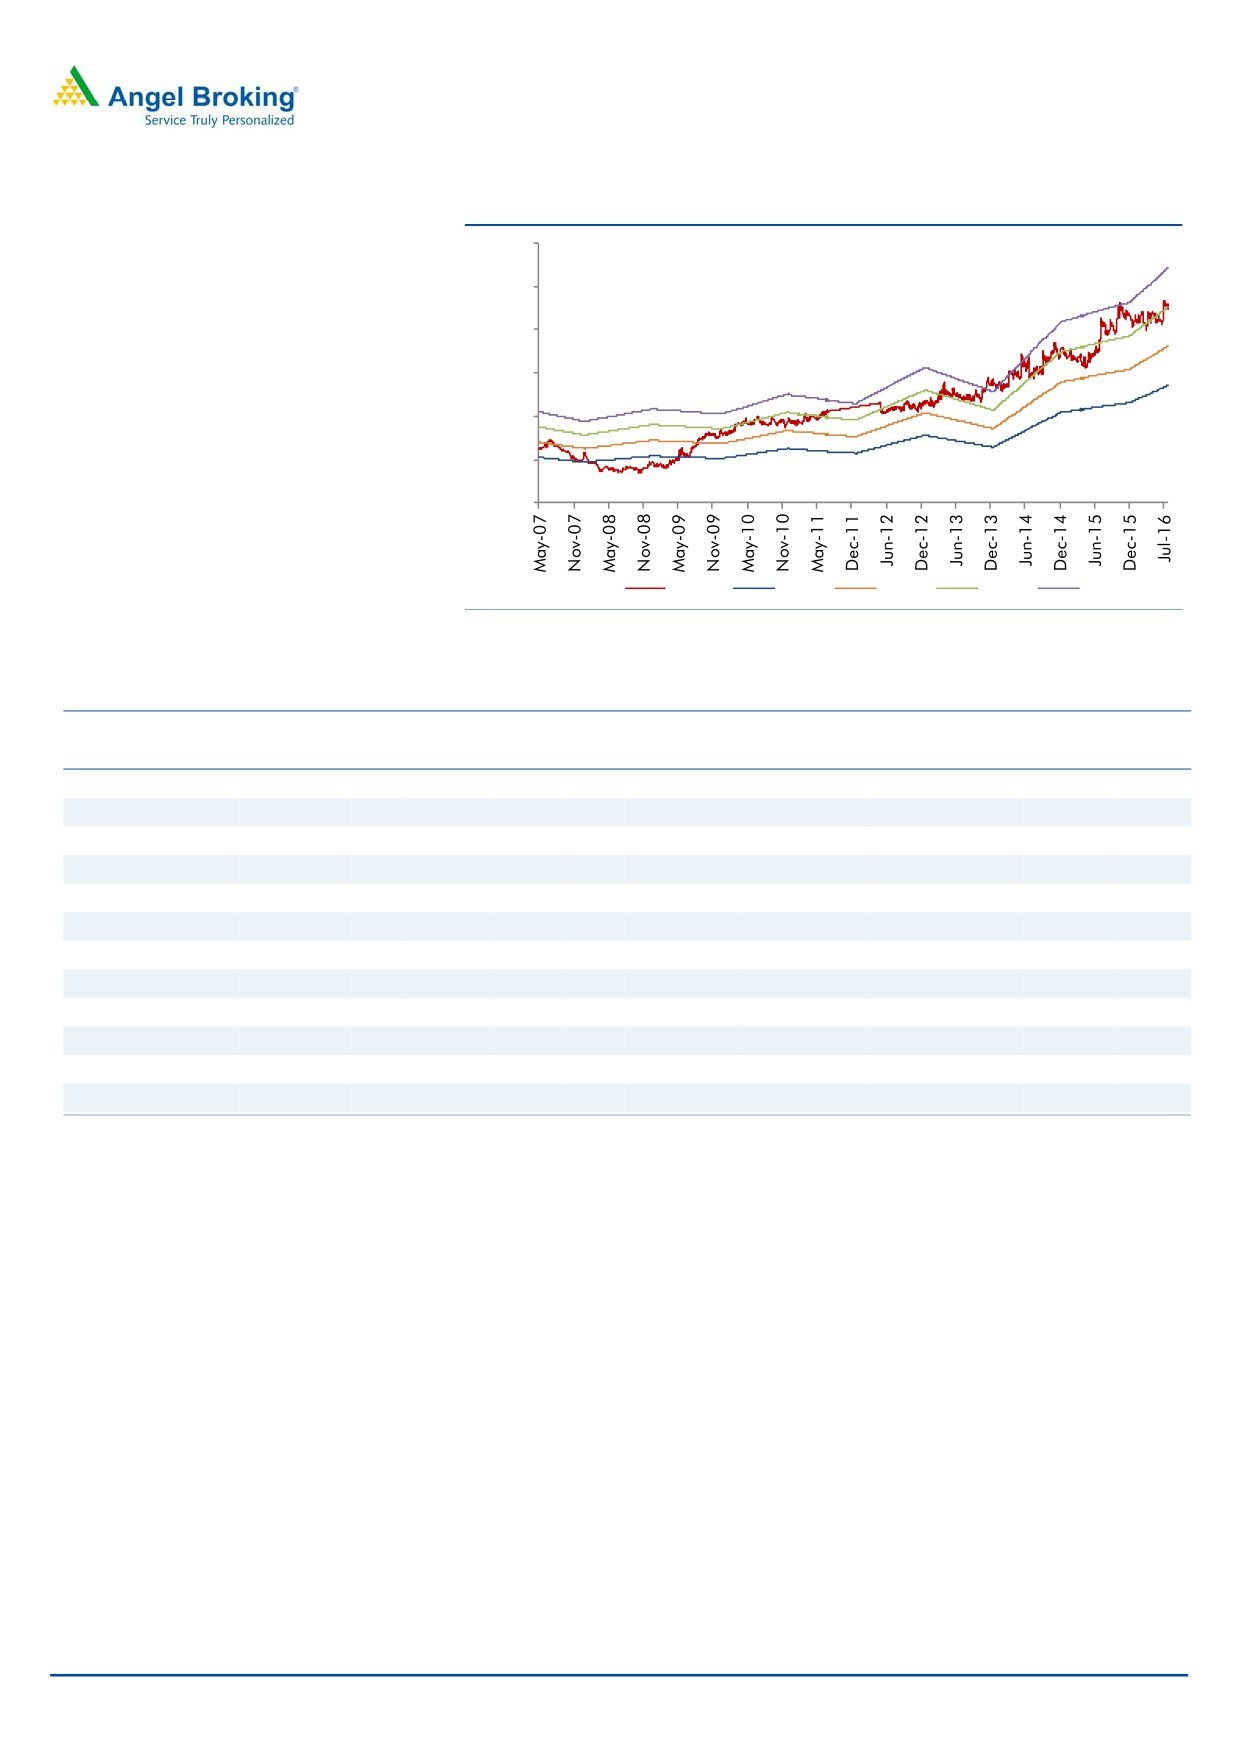
Exhibit 7: One-year forward P/E
6,000
5,000
4,000
3,000
2,000
1,000
0
Price
10x
15x
20x
25x
Source: Company, Angel Research
Exhibit 8: Recommendation summary
Company
Reco.
CMP Tgt Price Upside
FY2018E
FY16-18E
FY2018E
(`)
(`)
(%) PE (x) EV/Sales (x) EV/EBITDA (x) CAGR in EPS (%) RoCE (%) RoE (%)
Alembic Pharma
Neutral
588
-
-
24.8
2.6
15.0
(21.2)
23.5
21.3
Aurobindo Pharma Accumulate
799
877
9.7
16.9
2.8
11.7
18.1
22.5
26.1
Cadila Healthcare
Accumulate
372
399
7.5
18.6
2.8
12.5
15.8
24.3
26.6
Cipla
Neutral
525
-
-
19.3
2.5
13.3
20.4
13.5
15.2
Dr Reddy's
Neutral
3,476
-
-
20.0
2.9
11.9
12.2
19.3
18.2
Dishman Pharma
Sell
165
83
(42.0)
13.8
1.5
7.0
(1.1)
9.6
10.2
GSK Pharma
Neutral
3,404
-
-
52.1
7.2
37.5
21.6
35.8
31.8
Indoco Remedies
Sell
315
225
(28.6)
20.2
2.3
12.5
31.5
19.1
19.2
Ipca labs
Buy
495
613
23.8
17.4
1.8
9.7
17.9
11.8
14.9
Lupin
Buy
1,717
1,809
5.4
24.8
4.0
15.0
17.2
24.4
20.9
Sanofi India*
Neutral
4,582
-
-
29.9
3.4
19.5
21.2
24.9
28.4
Sun Pharma
Buy
803
944
17.6
24.5
5.0
16.0
22.0
33.1
18.9
Source: Company, Angel Research, *- December ending
Company Background
Sanofi, a leading global pharmaceutical company, operates in India through four
entities - Sanofi India, Sanofi-Synthelabo (India) Ltd, Sanofi Pasteur India Pvt Ltd
and Shantha Biotechnics. Sanofi India focuses its activities on seven major
therapeutic areas, namely
- Cardiovascular diseases, Metabolic Disorders,
Thrombosis, Oncology, Central Nervous System disorders, Internal Medicine and
Vaccines. Predominately a domestic company, the company exports to
semi-regulated markets; exports at
~`500cr contributed
~26% of sales in
CY2014.
July 26, 2016
5
Sanofi India | 2QCY2016 Result Update
Profit & loss statement
Y/E Dec. (` cr)
CY2012
CY2013
CY2014
CY2015
CY2016E
CY2017E
Gross sales
1,534
1,746
1,915
2,097
2,412
2,748
Less: Excise duty
40
39
40
48
55
56
Net sales
1,494
1,707
1,875
2,049
2,357
2,692
Other operating income
91
102
103
144
144
144
Total operating income
1,585
1,809
1,978
2,193
2,500
2,835
% chg
20.5
14.1
9.3
10.9
14.0
13.4
Total expenditure
1,261
1,411
1,639
1,734
1,948
2,225
Net raw materials
735
820
974
1,012
1,117
1,276
Other mfg costs
74
82
93
106
122
140
Personnel
214
242
288
333
383
438
Other
238
267
283
283
325
371
EBITDA
233
296
236
315
409
467
% chg
32.2
27.0
7.3
8.3
9.3
10.3
(% of Net Sales)
15.6
17.3
12.6
15.4
17.3
17.3
Depreciation& amortisation
90
92
97
113
123
125
EBIT
143
203
140
202
286
342
% chg
(1.5)
42.4
5.7
6.7
7.7
8.7
(% of Net Sales)
9.6
11.9
10.2
11.2
12.2
13.2
Interest & other charges
1
0
-
-
-
-
Other income
30
58
64
135
100
100
(% of PBT)
11.4
15.9
18.6
19.6
20.6
21.6
Share in profit of Associates
-
-
-
-
-
-
Recurring PBT
262
363
307
481
530
585
% chg
(7.7)
38.7
3.8
4.8
5.8
6.8
Extraordinary Expense/(Inc.)
PBT (reported)
262
363
307
481
530
585
Tax
85.0
123.3
109.0
159.4
174.9
193.2
(% of PBT)
32.4
33.9
35.6
33.1
33.0
33.0
PAT (reported)
177
240
198
322
355
392
Extra-ordinary items
(0)
(25)
(67)
56
-
-
PAT after MI (reported)
177
266
264
321
353
389
ADJ. PAT
177
240
197
265
353
389
% chg
(7.4)
35.4
(17.8)
34.4
33.3
10.2
(% of Net Sales)
11.8
15.6
14.1
15.7
15.0
14.5
Basic EPS (`)
77
104
86
115
153
169
Fully Diluted EPS (`)
77
104
86
115
153
169
% chg
(7.4)
35.4
(17.8)
34.6
33.3
10.2
July 26, 2016
6
Sanofi India | 2QCY2016 Result Update
Balance Sheet
Y/E Dec (` cr)
CY2012 CY2013 CY2014 CY2015 CY2016E CY2017E
SOURCES OF FUNDS
Equity share capital
23
23
23
23
23
23
Preference Capital
-
-
-
-
-
-
Reserves & surplus
1,181
1,324
1,463
1,604
2,061
2,553
Shareholders funds
1,204
1,347
1,486
1,627
2,084
2,576
Long term provisions
19
25
32
40
40
40
Other long term liabilities
-
-
-
-
-
-
Total loans
-
-
-
-
-
-
Total liabilities
1,223
1,372
1,518
1,668
2,126
2,620
APPLICATION OF FUNDS
Gross block
889
1,075
1,195
1,349
1,379
1,409
Less: Acc. depreciation
315
409
506
619
741
867
Net block
574
666
690
730
638
542
Goodwill
125
125
125
125
125
125
Capital Work-in-Progress
43
43
43
43
43
43
Long term loan and adv.
61
62
106
262
262
262
Investments
0.4
0.2
0.2
0.2
0.2
0.2
Current assets
827
947
1,263
1,245
1,865
2,551
Cash
429
264
469
572
788
1,428
Loans & advances
208
219
196
301
346
288
Other
191
464
598
373
731
835
Current liabilities
387
435
656
617
687
785
Net current assets
441
512
607
628
1,178
1,767
Deferred tax assets
(21)
(37)
(54)
(120)
(120)
(120)
Total assets
1,223
1,372
1,518
1,668
2,126
2,620
July 26, 2016
7
Sanofi India | 2QCY2016 Result Update
Cash flow statement
Y/E Dec. (` cr)
CY2012 CY2013 CY2014 CY2015 CY2016E CY2017E
Profit before tax
282
285
291
292
293
294
Depreciation
90
92
97
113
123
125
(Inc)/Dec in Working Capital
(147)
236
(64)
73
334
(51)
Less: Other income
91
102
66
67
68
69
Direct taxes paid
93
91
93
94
95
96
Cash Flow from Operations
41
420
164
317
587
203
(Inc.)/Dec.in Fixed Assets
(67)
(186)
(120)
(154)
(30)
(30)
(Inc.)/Dec. in Investments
-
0
0
-
-
1
Other income
91
102
66
67
68
69
Cash Flow from Investing
24
(84)
41
42
43
44
Issue of Equity
-
-
-
-
-
-
Inc./(Dec.) in loans
-
-
-
-
-
-
Dividend Paid (Incl. Tax)
(88)
(104)
(104)
(104)
(104)
(104)
Others
218
(397)
102
(153)
(301)
519
Cash Flow from Financing
130
(501)
(1)
(257)
(404)
415
Inc./(Dec.) in Cash
195
(164)
204
103
226
663
Opening Cash balances
234
429
264
469
572
788
Closing Cash balances
429
264
469
572
788
1,428
July 26, 2016
8
Sanofi India | 2QCY2016 Result Update
Key ratios
Y/E Dec.
CY2012
CY2013
CY2014
CY2015
CY2016E CY2017E
Valuation Ratio (x)
P/E (on FDEPS)
59.6
44.0
53.5
39.8
29.9
27.1
P/CEPS
39.5
29.5
29.2
24.3
22.2
20.5
P/BV
8.8
7.8
7.1
6.5
5.1
4.1
EV/Sales
6.8
6.0
5.4
4.9
4.1
3.4
EV/EBITDA
43.5
34.8
42.7
31.6
23.8
19.5
Per Share Data (`)
EPS (Basic)
76.9
104.1
85.6
115.2
153.5
169.2
EPS (fully diluted)
76.9
104.1
85.6
115.2
153.5
169.2
Cash EPS
115.9
155.4
156.7
188.7
206.9
223.7
DPS
33.0
33.0
33.0
33.0
33.0
33.0
Book Value
522.9
584.8
645.2
707.4
906.0
1,120.2
Returns (%)
RoCE (Pre-tax)
12.1
15.7
10.2
14.8
20.9
24.9
Angel ROIC (Pre-tax)
17.5
22.4
14.6
21.1
29.8
35.5
ROE
15.3
18.8
14.4
19.3
25.8
28.4
Turnover ratios (x)
Inventory / Sales (days)
61
31
28
26
23
20
Receivables (days)
23
9
8
7
7
6
Payables (days)
44
24
21
20
18
16
July 26, 2016
9
Sanofi India | 2QCY2016 Result Update
Research Team Tel: 022 - 39357800
DISCLAIMER
Angel Broking Private Limited (hereinafter referred to as “Angel”) is a registered Member of National Stock Exchange of India Limited,
Bombay Stock Exchange Limited and Metropolitan Stock Exchange Limited. It is also registered as a Depository Participant with CDSL
and Portfolio Manager with SEBI. It also has registration with AMFI as a Mutual Fund Distributor. Angel Broking Private Limited is a
registered entity with SEBI for Research Analyst in terms of SEBI (Research Analyst) Regulations, 2014 vide registration number
INH000000164. Angel or its associates has not been debarred/ suspended by SEBI or any other regulatory authority for accessing
/dealing in securities Market. Angel or its associates/analyst has not received any compensation / managed or co-managed public
offering of securities of the company covered by Analyst during the past twelve months.
This document is solely for the personal information of the recipient, and must not be singularly used as the basis of any investment
decision. Nothing in this document should be construed as investment or financial advice. Each recipient of this document should
make such investigations as they deem necessary to arrive at an independent evaluation of an investment in the securities of the
companies referred to in this document (including the merits and risks involved), and should consult their own advisors to determine
the merits and risks of such an investment.
Reports based on technical and derivative analysis center on studying charts of a stock's price movement, outstanding positions and
trading volume, as opposed to focusing on a company's fundamentals and, as such, may not match with a report on a company's
fundamentals. Investors are advised to refer the Fundamental and Technical Research Reports available on our website to evaluate the
contrary view, if any.
The information in this document has been printed on the basis of publicly available information, internal data and other reliable
sources believed to be true, but we do not represent that it is accurate or complete and it should not be relied on as such, as this
document is for general guidance only. Angel Broking Pvt. Limited or any of its affiliates/ group companies shall not be in any way
responsible for any loss or damage that may arise to any person from any inadvertent error in the information contained in this report.
Angel Broking Pvt. Limited has not independently verified all the information contained within this document. Accordingly, we cannot
testify, nor make any representation or warranty, express or implied, to the accuracy, contents or data contained within this document.
While Angel Broking Pvt. Limited endeavors to update on a reasonable basis the information discussed in this material, there may be
regulatory, compliance, or other reasons that prevent us from doing so.
This document is being supplied to you solely for your information, and its contents, information or data may not be reproduced,
redistributed or passed on, directly or indirectly.
Neither Angel Broking Pvt. Limited, nor its directors, employees or affiliates shall be liable for any loss or damage that may arise from
or in connection with the use of this information.
Disclosure of Interest Statement
Sanofi India
1. Financial interest of research analyst or Angel or his Associate or his relative
No
2. Ownership of 1% or more of the stock by research analyst or Angel or associates or relatives
No
3. Served as an officer, director or employee of the company covered under Research
No
4. Broking relationship with company covered under Research
No
Ratings (Based on expected returns
Buy (> 15%)
Accumulate (5% to 15%)
Neutral (-5 to 5%)
over 12 months investment period):
Reduce (-5% to -15%)
Sell (< -15)
July 26, 2016
10