4QFY2016 Result Update | Pharmaceutical
May 23, 2016
Lupin
BUY
CMP
`1,505
Performance Highlights
Target Price
`1,809
Y/E March (` cr)
4QFY2016 3QFY2016
% chg qoq 4QFY2015
% chg yoy
Investment Period
12 months
Net sales
4,091
3,358
21.8
3,054
34.0
Other income
115
263
(56.3)
41
178.9
Stock Info
Operating profit
1,277
679
88.1
766
66.9
Interest
23
9
149.2
3
815.2
Sector
Pharmaceutical
Net profit
807
530
52.3
547
47.5
Market Cap (` cr)
67,837
Source: Company, Angel Research
Net Debt (` cr)
6,737
Beta
0.7
For 4QFY2016, Lupin posted results above our expectations. Sales came in at
`4,091cr (V/s `3,665cr expected), up 34.0% yoy. Sales growth was driven by
52 Week High / Low
2,127 / 1,294
Formulations (`3,807.5cr) which rose by 38.6% yoy, while API (`283.8cr)
Avg. Daily Volume
157,745
witnessed a dip of 7.7% yoy. On the operating front, the EBDITA margin came in
Face Value (`)
2
at 31.2% V/s 25.1% in 4QFY2015 and V/s our expectation of 29.5%. The
BSE Sensex
23,382
expansion in the OPM was on the back of a firmer GPM which came in at 73.8%
Nifty
7,108
V/s 67.9% in 4QFY2015 and V/s 72.7% expected. This along with high other
Reuters Code
LUPN.BO
income at `115cr (V/s `41cr in 4QFY2015) led the net profit to come in at
Bloomberg Code
LPC@IN
`807cr V/s `547cr in 4QFY2015 and V/s `829cr expected. We recommend a
Buy on the stock with a price target of `1,809.
Shareholding Pattern (%)
Numbers outperform our expectations: Sales for the quarter came in at `4,091cr
Promoters
46.5
(V/s `3,665cr expected), up 34.0% yoy. Sales growth was driven by Formulations
MF / Banks / Indian Fls
8.3
(`3,807.5cr) which rose by 38.6% yoy, while API (`283.8cr) witnessed a dip of
FII / NRIs / OCBs
35.8
7.7% yoy. Formulation sales were driven by USA (`2,187.1cr, +58.7% yoy),
Indian Public / Others
9.4
Europe (`125.4cr, +40.7% yoy), India (`761.5cr, +14.7% yoy, Japan (`344.2cr,
+17.0% yoy) and ROW (`275.8cr, +38.3% yoy). On the operating front, the
EBDITA margin came in at 31.2% V/s 25.1% in 4QFY2015 and V/s our
Abs. (%)
3m 1yr 3yr
expectation of 29.5%. This along with high other income at `115cr (V/s `41cr in
Sensex
6.7
(8.5)
25.1
4QFY2015) led the net profit to come in at `807cr V/s `547cr in 4QFY2015 and
Lupin
(15.6)
(12.8)
96.0
V/s `829cr expected.
Outlook and valuation: We expect Lupin to post a net sales CAGR of 16.7% to
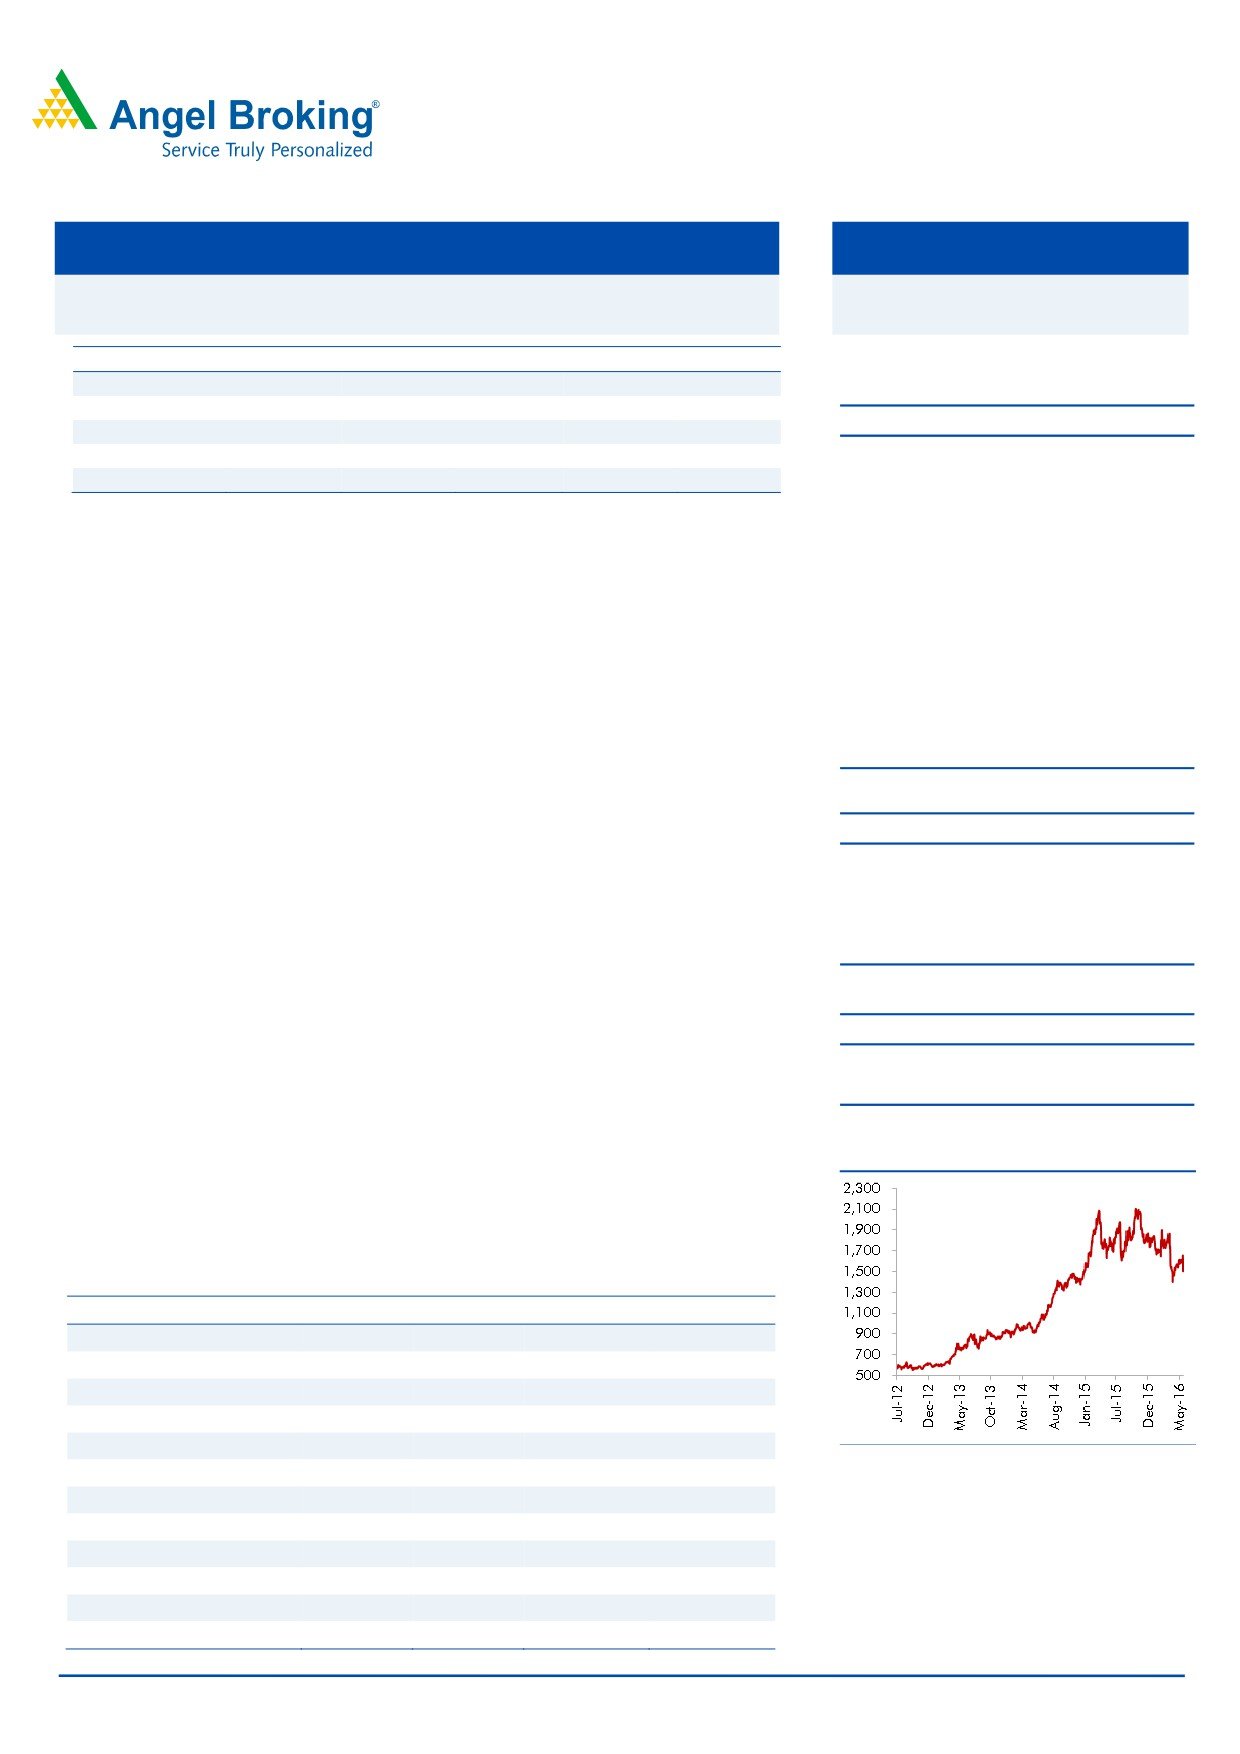
3-year price chart
`18,644cr and earnings CAGR of 17.2% to `69.3/share over FY2016-18E.
Currently, the stock is trading at 25.9x and 21.7x its FY2017E and FY2018E
earnings, respectively. We recommend a Buy on the stock.
Key financials (Consolidated)
Y/E March (` cr)
FY2015
FY2016
FY2017E
FY2018E
Net sales
12,600
13,702
15,912
18,644
% chg
13.6
8.7
16.1
17.2
Net profit
2,403
2,271
2,611
3,117
% chg
30.9
(5.5)
15.0
19.4
EPS (`)
53.7
50.6
58.1
69.3
Source: Company, Angel Research
EBITDA margin (%)
27.4
23.7
26.4
26.7
P/E (x)
28.2
29.8
25.9
21.7
RoE (%)
30.4
22.9
21.4
20.9
RoCE (%)
34.3
19.6
19.3
24.4
P/BV (x)
7.6
6.2
5.0
4.1
Sarabjit Kour Nangra
EV/sales (x)
5.3
5.4
4.3
3.5
+91 22 3935 7600 Ext: 6806
EV/EBITDA (x)
19.4
22.6
16.1
13.1
Source: Company, Angel Research; Note: CMP as of May 20, 2016
Please refer to important disclosures at the end of this report
1
Lupin | 4QFY2016 Result Update
Exhibit 1: 4QFY2016 - Consolidated performance
Y/E March (` cr)
4QFY2016
3QFY2016
% chg (qoq)
4QFY2015
% chg (yoy) FY2016 FY2015
% chg (yoy)
Net sales
4,091
3,358
21.8
3,054
34.0
13,701
12,600
8.7
Other income
115
263
(56.3)
41
178.9
695
409
69.8
Total income
4,206
3,621
16.2
3,096
35.9
14,396
13,009
10.7
Gross profit
3,018
2,235
35.0
2,074
9,392
8,443
11.2
Gross margin
73.8
66.6
67.9
68.5
67.0
Operating profit
1,277.5
679.1
88.1
766
66.9
3,246
3,450.0
(5.9)
OPM (%)
31.2
20.2
25.1
23.7
27.4
Interest
23
9
149.2
3
815.2
45
10
346.2
Dep. & amortization
145
114
26.9
107
35.0
464
435
6.6
PBT
1,225
819
49.5
697
75.7
3,433
3,414
0.6
Provision for taxation
413
290
42.4
136
203.1
1,154
970
18.9
Reported net profit
812
529
53.4
561
44.8
2,279
2,444
(6.7)
Less : exceptional items
-
-
-
-
-
MI & share in associates
5
1
310.4
14
(62.6)
9
41
(78.6)
PAT after exceptional items
807
530
52.3
547
47.5
2,271
2,403
(5.5)
EPS (`)
18.0
11.8
12.2
50.6
53.7
Source: Company, Angel Research
Exhibit 2: 4QFY2016 - Actual Vs Angel estimates
` cr
Actual
Estimates
Variation
Net Sales
4,091
3,665
11.6
Other Income
115
41
178.9
Operating Profit
1,277
1,080
18.3
Deprecation
145
113
28.0
Tax
413
207
99.1
Net Profit
807
829
(2.6)
Source: Company, Angel Research
Revenue grows 34.0% yoy: The company’s sales for the quarter came in at
`4,091cr (V/s `3,665cr expected), up 34.0% yoy. Sales growth was driven by
Formulations
(`3,807.5cr) which rose by
38.6% yoy, while API
(`283.8cr)
witnessed a dip of 7.7% yoy. Formulation sales were driven by USA (`2,312.5cr)
and Europe (`125.4cr), up a 57.6% yoy and 40.7% yoy respectively.
The growth in the US business (US$325mn) was led by strong sales of generic
Glumetza (in 180 days exclusivity) and by price hikes undertaken in generic
Fortamet in the previous quarters. The company completed the acquisition of
Gavis in March 2016, which resulted in the inclusion of Gavis sales (~US$10-
12mn) for 20 days in 4QFY2016.
India (`761.5cr) posted a 14.7% yoy growth, while Japan (`344.2cr) posted a
17.0% yoy growth. ROW (`275.8cr) posted a 38.3% yoy growth.
The company launched 9 products in the US during the period, taking the total
launches in FY2016 to 21. It has 79 products in the market. Lupin is the market
leader in 44 products marketed in the US generics market. The company is
amongst the top 3 by market share in 79 products.
Another export destination - Japan, posted a yoy growth of 17.0% to `344.2cr,
mainly on back of the currency impact. Sales in JPY terms grew 4.8% yoy to
May 23, 2016
2
Lupin | 4QFY2016 Result Update
JPY5,918mn during the quarter. Lupin’s sales in Europe (`125.4cr) and India
(`761.5cr) posted a yoy growth of 40.7% and 14.7% yoy, respectively. ROW
(`275.8cr) posted a strong growth of 38.3% yoy in 4QFY2016.
Pharma Dynamics clocked revenues of `113.5cr during 4QFY2016, a growth of
8.3% yoy, while it grew 13.2% in ZAR terms to ZAR228mn. The company remains
the fourth largest generic company in the South African market. On the regulatory
front, Lupin received 6 approvals from the USFDA during the quarter. Cumulative
ANDA filings with the USFDA as of March 31, 2016 stood at 343 (35 FTFs) with
the company having received 180 approvals to date.
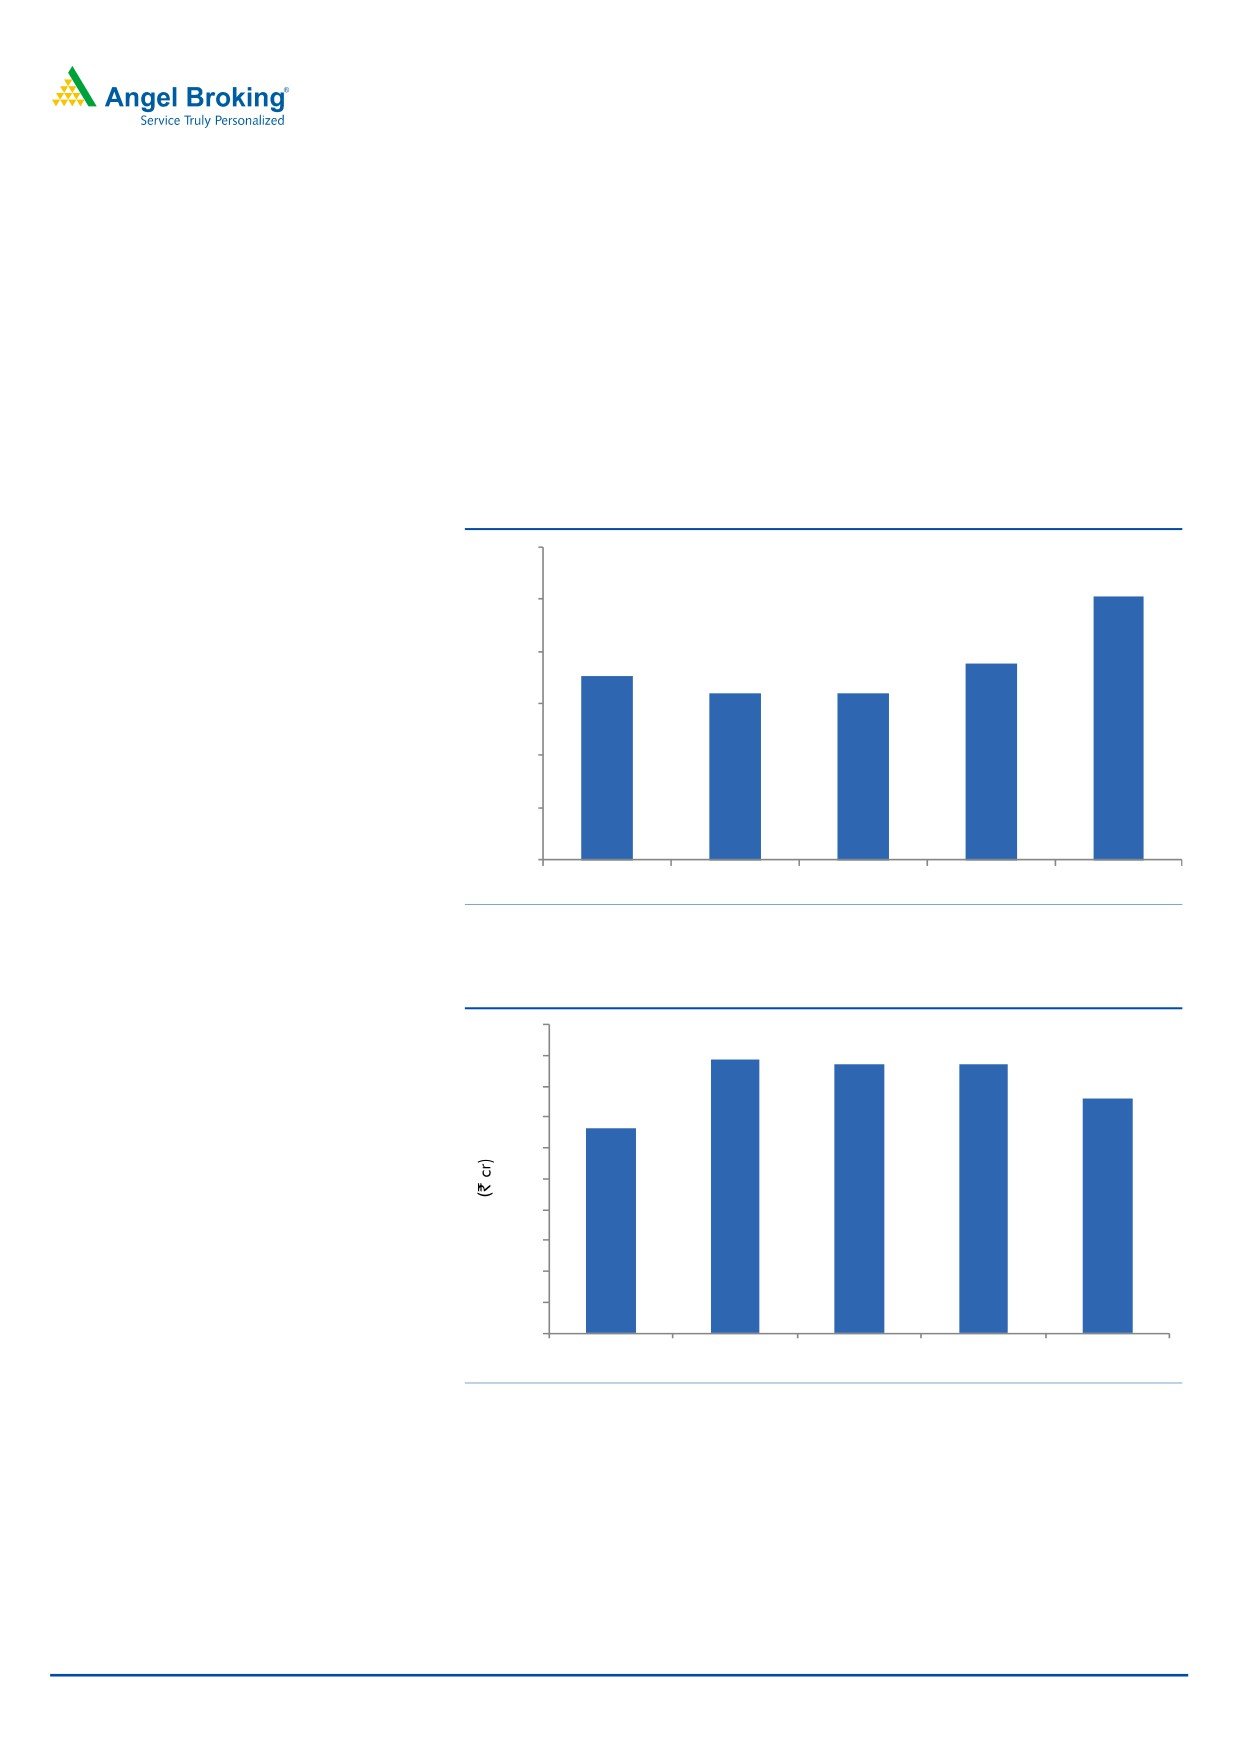
Exhibit 3: Advanced markets - Sales trend
3,000
2,531
2,500
1,880
2,000
1,761
1,599
1,594
1,500
1,000
500
0
4QFY2015
1QFY2016
2QFY2016
3QFY2016
4QFY2016
Source: Company, Angel Research
Exhibit 4: Domestic Formulation Market
1000
885
874
871
900
762
800
664
700
600
500
400
300
200
100
0
4QFY2015
1QFY2016
2QFY2016
3QFY2016
4QFY2016
Source: Company
OPM at 31.2%: On the operating front, the EBDITA margin came in at 31.2% V/s
25.1% in 4QFY2015 and V/s 29.5% expected. The expansion in the OPM was on
back of the GPM expansion which came in at 73.8% V/s 68.7% in 4QFY2015 and
V/s 72.7% expected. The R&D expenditure during the quarter was 16.7% of sales
V/s 10.1% of sales during 4QFY2015.
May 23, 2016
3
Lupin | 4QFY2016 Result Update
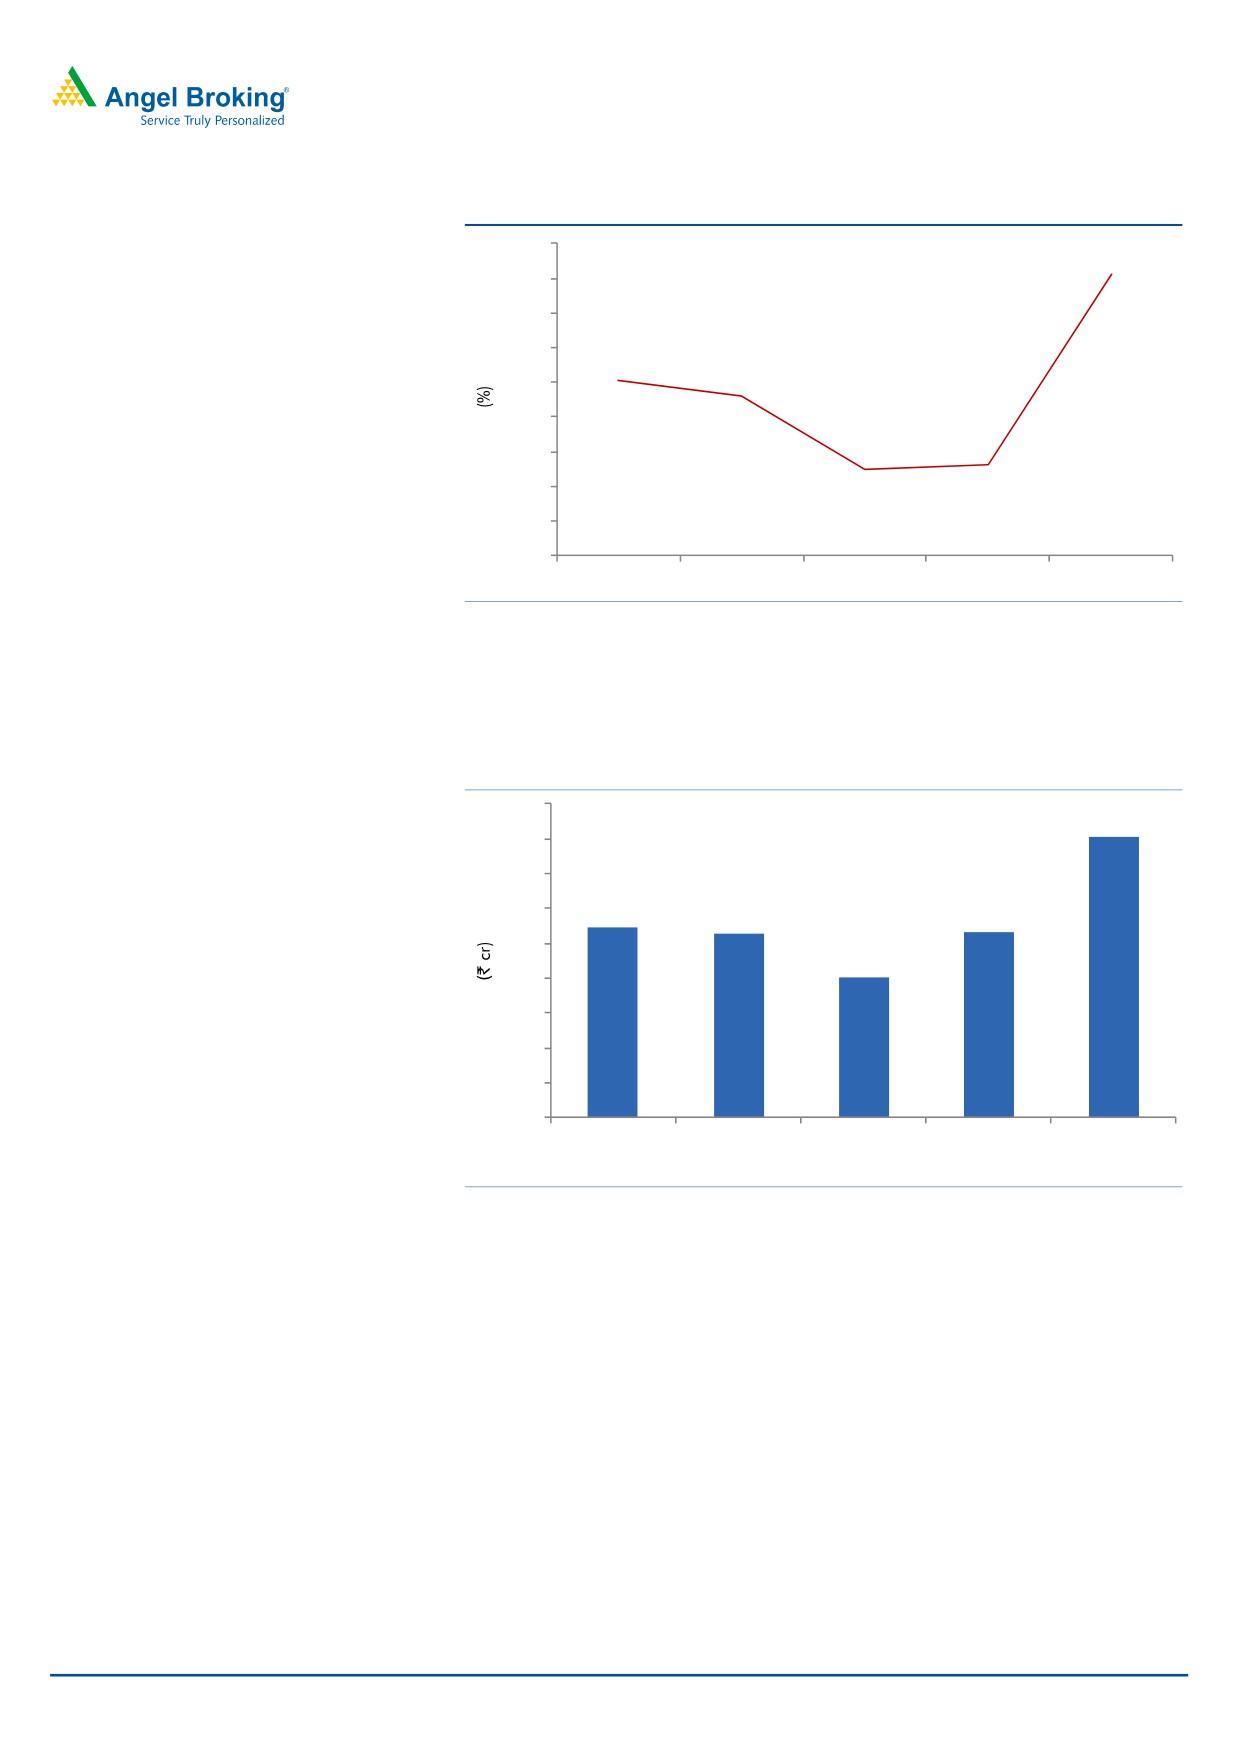
Exhibit 5: OPM trend
33.0
31.2
31.0
29.0
27.0
25.1
24.2
25.0
23.0
20.0
20.2
21.0
19.0
17.0
15.0
4QFY2015
1QFY2016
2QFY2016
3QFY2016
4QFY2016
Source: Company, Angel Research
Net profit growth lower than our estimate: Thus, the net profit came in at `807cr
V/s `829cr expected and V/s `547cr in 4QFY2015, a yoy growth of 47.5%.
Exhibit 6: Net profit trends
900
807
800
700
600
547
525
530
500
400
400
300
200
100
-
4QFY2015
1QFY2016
2QFY2016
3QFY2016
4QFY2016
Source: Company, Angel Research
Conference call takeaways
FY2018 revenue aspiration has been brought down to US$3.5bn (US$2.1bn
in FY2016) from US$5bn. Net profit margin for FY2018 to be 20%.
Fortamet and Glumetza should continue to drive growth in FY2017 as the
company does not expect more than 1-2 new players over the next one year.
ANDA approval guidance: 25-30 launches are expected in FY2017 out of
which 15 would be from Gavis and 15 would be from Lupin. Lupin expects 2
FTFs in FY2017.
R&D as % of sales to be 12-15% in FY2017. Biosimilars expense would be
~12-14% of total R&D cost. Around 1/6th of the expense would be towards the
NCE portfolio.
May 23, 2016
4
Lupin | 4QFY2016 Result Update
Currently, 24% of the portfolio is under NLEM (price control) and the company
has taken a price decline of ~2.7% on this portfolio (in line with WPI
deflation).
Tax rate guided to be between 28-30% of PBT.
Recommendation rationale
US market - the key driver: The high-margin branded generic business has
been the key differentiator for Lupin in the Indian pharmaceuticals space. On
the generic turf, Lupin is currently the fifth largest generic player in the US,
with 5.3% market share in prescription. Lupin is now the market leader in 44
products marketed in the US generics market and is amongst the top 3 by
market share in 79 products. Currently, the company’s cumulative filings stand
at 343, of which 180 have been approved, with 35 FTFs valued at more than
US$13bn. Lupin plans to launch 25-30 products in the US in FY2017. We
expect the region to post a CAGR of 22.9% during FY2016-18E, on back of
new product launches.
Domestic formulations on a strong footing: Lupin continues to make strides in
the Indian market. Currently, Lupin ranks No 3, and is the fastest growing
company among the top five companies in the domestic formulation space,
registering a strong CAGR of 20.0% over the last few years. Six of Lupin's
products are among the top 300 brands in the country. Lupin has a strong
field force of ~6,000MRs (as of FY2016). We expect the domestic formulation
market to grow at a CAGR of 15.0% over FY2016-18E.
First-mover advantage in Japan: Lupin figures among the few Indian
companies with a formidable presence in Japan, the world’s second largest
pharma market (ranked as the 8th largest as per IMS MAT March 2014). The
Management believes there will be patent expiries (US$14-16bn) in the next
two years in the Japanese market, which along with increased generic
penetration would drive growth in the market. The Management expects
improvement in growth in the next 3-4 years. On a conservative basis, we
expect the market to post a CAGR of 10.0% over FY2016-18E.
May 23, 2016
5
Lupin | 4QFY2016 Result Update
Valuation
We expect Lupin to post a net sales CAGR of 16.7% to `18,644cr and earnings
CAGR of 17.2% to `69.3/share over FY2016-18E. Currently, the stock is trading
at
25.9x and
21.7x its FY2017E and FY2018E earnings, respectively. We
recommend a Buy on the stock.
Exhibit 7: Key Assumptions
FY2017E
FY2018E
Sales growth (%)
16.1
17.2
Domestic growth (%)
14.0
16.0
Exports growth (%)
17.8
17.5
Operating margins (%)
26.4
26.7
R&D Exp ( % of sales)
12.0
12.0
Capex (` cr)
1000
1000
Source: Company, Angel Research
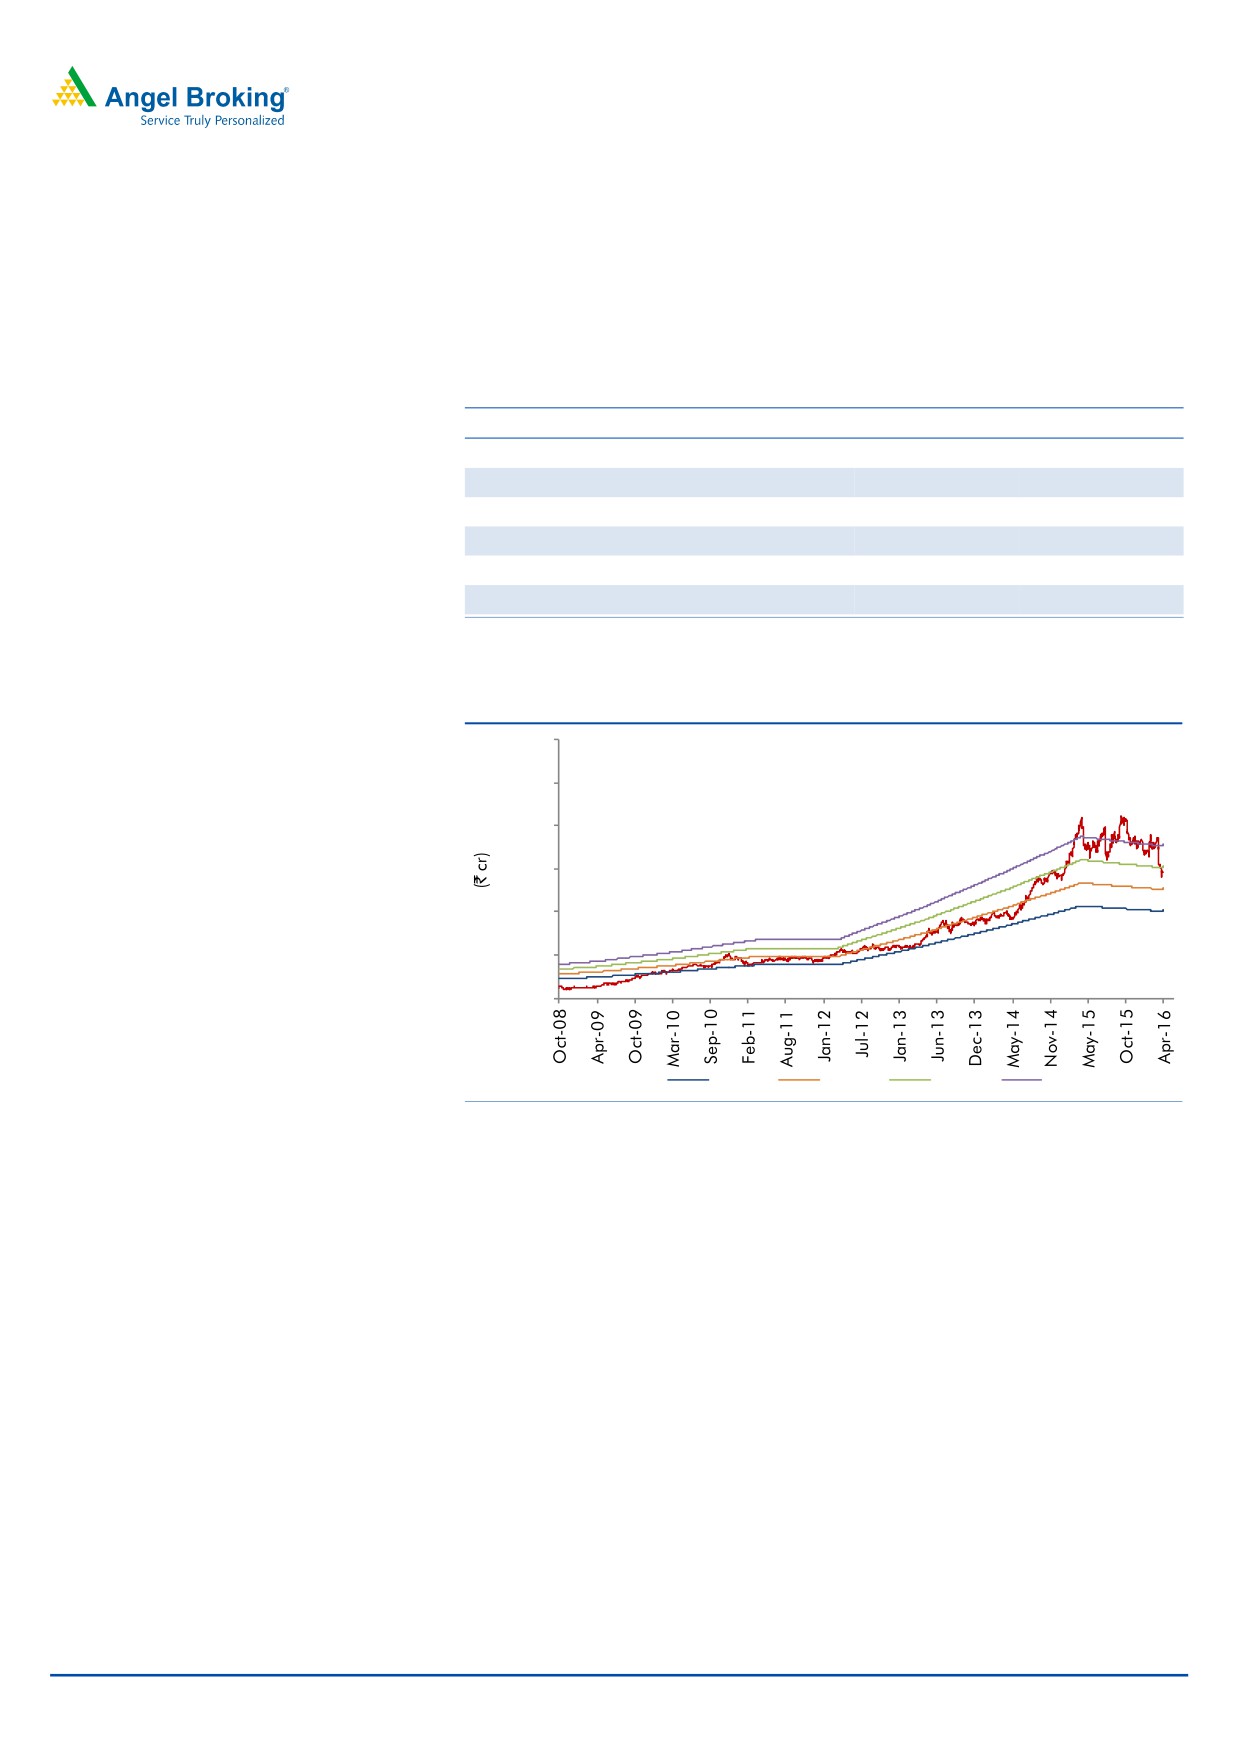
Exhibit 8: One-year forward PE
3,000
2,500
2,000
1,500
1,000
500
-
20x
25x
30x
35x
Source: Company, Angel Research
May 23, 2016
6
Lupin | 4QFY2016 Result Update
Exhibit 9: Recommendation summary
Company
Reco
CMP Tgt. price Upside
FY2017E
FY15-17E
FY2017E
(`)
(`)
(%) PE (x) EV/Sales (x) EV/EBITDA (x) CAGR in EPS (%) RoCE (%) RoE (%)
Alembic Pharma
Neutral
564
-
-
19.7
2.7
13.9
11.4
23.5
21.3
Aurobindo Pharma Accumulate
770
856
11.1
18.0
2.9
12.6
15.6
23.5
30.2
Cadila Healthcare
Buy
321
400
24.6
18.8
2.9
13.0
22.9
24.2
28.8
Cipla
Buy
507
605
19.3
18.4
2.4
12.9
18.3
16.7
16.1
Dr Reddy's
Buy
3,035
3,476
14.5
19.9
2.9
11.8
6.8
19.2
18.7
Dishman Pharma
Neutral
157
-
-
15.7
1.7
7.8
15.9
9.4
11.0
GSK Pharma*
Neutral
3,382
-
-
49.5
8.7
39.2
6.6
33.7
34.3
Indoco Remedies
Neutral
258
-
-
19.0
2.1
11.4
23.0
19.7
19.7
Ipca labs
Buy
450
750
66.7
16.1
1.7
9.1
17.9
11.8
14.9
Lupin
Buy
1,505
1,809
20.2
25.9
4.3
16.3
4.2
19.3
21.4
Sanofi India
Accumulate
4,292
4,738
12.4
27.5
3.8
21.8
34.2
21.0
25.6
Sun Pharma
Buy
792
950
19.9
29.4
5.2
16.8
8.4
15.8
16.6
Source: Company, Angel Research; Note: * December year ending
May 23, 2016
7
Lupin | 4QFY2016 Result Update
Company Background
Lupin, established in 1968, is primarily engaged in the manufacture and global
distribution of active pharmaceutical ingredients (APIs) and finished dosages. Over
the years, the company forayed into the US markets through a differentiated export
strategy of tapping branded generics and consequently gaining a large share of
the US prescription market. Further, to expand its footprint in the global markets,
Lupin has prudently adopted the inorganic growth route. In line with this, over the
last two years, the company made small acquisitions across geographies,
prominent among these being the acquisition of Kyowa in the growing Japanese
market. In the US, the company has acquired privately held Gavis Pharmaceuticals
LLC and Novel Laboratories Inc. The acquisitions enhance Lupin’s scale in the US
generic market and also broadens its pipeline in dermatology, controlled
substance products and other high-value and niche generics.
May 23, 2016
8
Lupin | 4QFY2016 Result Update
Profit & Loss Statement (Consolidated)
Y/E March (` cr)
FY2013
FY2014
FY2015
FY2016
FY2017E
FY2018E
Gross sales
9,524
11,167
12,684
13,797
16,008
18,757
Less: Excise duty
62
80
84
96
96
113
Net sales
9,462
11,087
12,600
13,702
15,912
18,644
Other operating income
180
200
170
507
200
200
Total operating income
9,641
11,287
12,770
14,208
16,112
18,844
% chg
36.1
17.1
13.1
11.3
13.4
17.0
Total expenditure
7,371
8,284
9,150
10,455
11,718
13,667
Net raw materials
3,548
3,817
4,157
4,309
5,092
5,864
Other mfg costs
757
847
963
1,047
1,216
1,425
Personnel
1,249
1,465
1,747
2,108
2,069
2,868
Other
1,818
2,155
2,283
2,580
3,342
3,511
EBITDA
2,090
2,803
3,449
3,247
4,194
4,977
% chg
58.2
34.1
23.1
(5.9)
29.2
18.7
(% of Net Sales)
22.1
25.3
27.4
23.7
26.4
26.7
Depreciation& Amortization
332
261
435
464
933
1,013
EBIT
1,758
2,542
3,015
2,783
3,261
3,964
% chg
60.7
44.6
18.6
(7.7)
17.2
21.5
(% of Net Sales)
18.6
22.9
23.9
20.3
20.5
21.3
Interest & other charges
41
27
10
45
10
10
Other Income
28
116
240
188
188
188
(% of PBT)
1
4
7
5
5
4
Share in profit of associates
-
-
-
-
-
-
Recurring PBT
1,925
2,832
3,415
3,433
3,639
4,342
% chg
60.9
47.1
20.6
0.5
6.0
19.3
Extraordinary expense/(Inc.)
-
-
-
-
-
-
PBT (reported)
1,925
2,832
3,415
3,433
3,639
4,342
Tax
584
962
970
1,154
1,019
1,216
(% of PBT)
30.4
34.0
28.4
33.6
28.0
28.0
PAT (reported)
1,340
1,870
2,444
2,279
2,620
3,126
Add: Share of earnings of asso.
-
-
-
-
-
-
Less: Minority interest (MI)
26
33
41
9
9
9
Prior period items
-
-
-
-
-
-
PAT after MI (reported)
1,314
1,836
2,403
2,271
2,611
3,117
ADJ. PAT
1,314
1,836
2,403
2,271
2,611
3,117
% chg
51.5
39.7
30.9
(5.5)
15.0
19.4
(% of Net Sales)
13.9
16.6
19.1
16.6
16.4
16.7
Basic EPS (`)
29.4
41.0
53.5
50.5
58.1
69.3
Fully Diluted EPS (`)
29.4
41.0
53.5
50.5
58.1
69.3
% chg
51.0
39.5
30.5
(5.5)
15.0
19.4
May 23, 2016
9
Lupin | 4QFY2016 Result Update
Balance Sheet (Consolidated)
Y/E March
FY2013
FY2014
FY2015
FY2016
FY2017E
FY2018E
SOURCES OF FUNDS
Equity share capital
90
90
90
90
90
90
Reserves & surplus
5,115
6,842
8,784
10,894
13,337
16,286
Shareholders funds
5,204
6,932
8,874
10,984
13,427
16,376
Minority interest
59
67
24
32
41
50
Total loans
1,164
553
471
7,119
1,000
500
Other Long-Term Liabilities
50
46
74
75
76
77
Long-Term Provisions
112
132
132
380
380
380
Deferred tax liability
163
178
118
124
124
124
Total liabilities
6,754
7,908
9,693
18,715
15,049
17,507
APPLICATION OF FUNDS
Gross block
4,114
4,564
5,355
11,160
12,160
13,160
Less: Acc. depreciation
1,684
1,928
2,363
2,827
3,759
4,772
Net block
2,430
2,635
2,992
8,334
8,401
8,388
Capital work-in-progress
311
304
304
304
304
304
Goodwill
570
720
1,648
2,964
2,964
2,964
Investments
2
178
1,658
8
8
8
Long-Term Loans and Adv.
387
373
275
970
1,126
1,320
Current assets
5,143
5,924
6,176
9,777
6,489
9,495
Cash
435
798
1,306
838
338
2,288
Loans & advances
340
302
671
737
847
993
Other
3,154
4,825
4,199
8,202
5,303
6,214
Current liabilities
2,089
2,227
3,360
3,642
4,243
4,972
Net current assets
3,054
3,697
2,816
6,135
2,245
4,523
Mis. Exp. not written off
-
-
-
-
-
-
Total assets
6,754
7,908
9,693
18,715
15,049
17,507
May 23, 2016
10
Lupin | 4QFY2016 Result Update
Cash Flow Statement (Consolidated)
Y/E March (` cr)
FY2013 FY2014 FY2015 FY2016 FY2017E FY2018E
Profit before tax
1,925
2,832
3,415
3,433
3,639
4,342
Depreciation
332
261
435
464
933
1,013
(Inc)/Dec in working capital
620
(1,481)
1,487
(4,482)
3,233
(521)
Direct taxes paid
(584)
(962)
(970)
(1,154)
(1,019)
(1,216)
Cash Flow from Operations
2,293
649
4,367
(1,739)
6,786
3,618
(Inc.)/Dec.in Fixed Assets
(353)
(443)
(791)
(5,805)
(1,000)
(1,000)
(Inc.)/Dec. in Investments
-
-
-
-
-
-
Cash Flow from Investing
(353)
(443)
(791)
(5,805)
(1,000)
(1,000)
Issue of equity
-
-
-
-
-
-
Inc./(Dec.) in loans
(476)
(611)
(82)
6,648
(6,119)
(500)
Dividend Paid (Incl. Tax)
(209)
(157)
(168)
(168)
(168)
(168)
Others
499
(795)
(2,816)
597
1
-
Cash Flow from Financing
(186)
(1,564)
(3,067)
7,077
(6,287)
(668)
Inc./(Dec.) in Cash
1,753
(1,358)
509
(468)
(500)
1,950
Opening Cash balances
402
435
798
1,306
838
338
Closing Cash balances
435
798
1,306
838
338
2,288
May 23, 2016
11
Lupin | 4QFY2016 Result Update
Key Ratios
Y/E March (` cr)
FY2013
FY2014
FY2015
FY2016
FY2017E
FY2018E
Valuation Ratio (x)
P/E (on FDEPS)
51.3
36.8
28.2
29.8
25.9
21.7
P/CEPS
40.9
32.2
23.8
24.7
19.1
16.4
P/BV
12.9
9.7
7.6
6.2
5.0
4.1
Dividend yield (%)
0.3
0.4
0.5
0.5
0.5
0.5
EV/Sales
7.2
6.0
5.3
5.4
4.3
3.5
EV/EBITDA
32.5
23.9
19.4
22.6
16.1
13.1
EV / Total Assets
10.0
8.5
6.9
3.9
4.5
3.7
Per Share Data (`)
EPS (Basic)
29.4
41.0
53.5
50.5
58.1
69.3
EPS (fully diluted)
29.4
41.0
53.5
50.5
58.1
69.3
Cash EPS
36.8
46.8
63.1
60.8
78.8
91.9
DPS
4.0
6.0
8.0
8.0
8.0
8.0
Book Value
116.3
154.6
197.4
244.4
298.7
364.3
Dupont Analysis
EBIT margin
18.6
22.9
23.9
20.3
20.5
21.3
Tax retention ratio
69.6
66.0
71.6
66.4
72.0
72.0
Asset turnover (x)
1.6
1.7
1.6
1.1
1.0
1.3
ROIC (Post-tax)
20.9
25.4
28.2
14.6
14.6
19.3
Cost of Debt (Post Tax)
2.0
2.0
1.4
0.8
0.2
1.0
Leverage (x)
0.0
0.0
0.0
0.0
0.2
0.0
Operating ROE
20.9
25.4
28.2
14.6
17.2
19.6
Returns (%)
ROCE (Pre-tax)
27.5
34.7
34.3
19.6
19.3
24.4
Angel ROIC (Pre-tax)
35.0
44.1
48.2
26.4
25.0
33.9
ROE
28.5
30.3
30.4
22.9
21.4
20.9
Turnover ratios (x)
Asset Turnover (Gross Block)
2.5
2.6
2.6
1.7
1.4
1.5
Inventory / Sales (days)
70
66
62
74
66
56
Receivables (days)
75
75
66
78
71
59
Payables (days)
72
84
78
86
86
86
WC cycle (ex-cash) (days)
88
89
63
87
82
40
Solvency ratios (x)
Net debt to equity
0.1
(0.0)
(0.1)
0.6
0.0
(0.1)
Net debt to EBITDA
0.3
(0.1)
(0.2)
1.9
0.2
(0.4)
Interest Coverage
42.9
95.4
307.3
62.4
326.1
396.4
May 23, 2016
12
Lupin | 4QFY2016 Result Update
Research Team Tel: 022 - 39357800
DISCLAIMER
Angel Broking Private Limited (hereinafter referred to as “Angel”) is a registered Member of National Stock Exchange of India Limited,
Bombay Stock Exchange Limited and Metropolitan Stock Exchange of India Limited. It is also registered as a Depository Participant with
CDSL and Portfolio Manager with SEBI. It also has registration with AMFI as a Mutual Fund Distributor. Angel Broking Private Limited is
a registered entity with SEBI for Research Analyst in terms of SEBI (Research Analyst) Regulations, 2014 vide registration number
INH000000164. Angel or its associates has not been debarred/ suspended by SEBI or any other regulatory authority for accessing
/dealing in securities Market. Angel or its associates including its relatives/analyst do not hold any financial interest/beneficial
ownership of more than 1% in the company covered by Analyst. Angel or its associates/analyst has not received any compensation /
managed or co-managed public offering of securities of the company covered by Analyst during the past twelve months. Angel/analyst
has not served as an officer, director or employee of company covered by Analyst and has not been engaged in market making activity
of the company covered by Analyst.
This document is solely for the personal information of the recipient, and must not be singularly used as the basis of any investment
decision. Nothing in this document should be construed as investment or financial advice. Each recipient of this document should
make such investigations as they deem necessary to arrive at an independent evaluation of an investment in the securities of the
companies referred to in this document (including the merits and risks involved), and should consult their own advisors to determine
the merits and risks of such an investment.
Reports based on technical and derivative analysis center on studying charts of a stock's price movement, outstanding positions and
trading volume, as opposed to focusing on a company's fundamentals and, as such, may not match with a report on a company's
fundamentals.
The information in this document has been printed on the basis of publicly available information, internal data and other reliable
sources believed to be true, but we do not represent that it is accurate or complete and it should not be relied on as such, as this
document is for general guidance only. Angel Broking Pvt. Limited or any of its affiliates/ group companies shall not be in any way
responsible for any loss or damage that may arise to any person from any inadvertent error in the information contained in this report.
Angel Broking Pvt. Limited has not independently verified all the information contained within this document. Accordingly, we cannot
testify, nor make any representation or warranty, express or implied, to the accuracy, contents or data contained within this document.
While Angel Broking Pvt. Limited endeavors to update on a reasonable basis the information discussed in this material, there may be
regulatory, compliance, or other reasons that prevent us from doing so.
This document is being supplied to you solely for your information, and its contents, information or data may not be reproduced,
redistributed or passed on, directly or indirectly.
Neither Angel Broking Pvt. Limited, nor its directors, employees or affiliates shall be liable for any loss or damage that may arise from
or in connection with the use of this information.
Note: Please refer to the important ‘Stock Holding Disclosure' report on the Angel website (Research Section). Also, please refer to the
latest update on respective stocks for the disclosure status in respect of those stocks. Angel Broking Pvt. Limited and its affiliates may
have investment positions in the stocks recommended in this report.
Disclosure of Interest Statement
Lupin
1. Analyst ownership of the stock
No
2. Angel and its Group companies ownership of the stock
No
3. Angel and its Group companies' Directors ownership of the stock
No
4. Broking relationship with company covered
No
Note: We have not considered any Exposure below ` 1 lakh for Angel, its Group companies and Directors
Ratings (Based on expected returns
Buy (> 15%)
Accumulate (5% to 15%)
Neutral (-5 to 5%)
over 12 months investment period):
Reduce (-5% to -15%)
Sell (< -15)
May 23, 2016
13