4QFY2016 Result Update | Infrastructure
May 27, 2016
Larsen & Toubro
BUY
CMP
`1,475
Performance Highlights
Target Price
`1,700
Quarterly highlights - Standalone
Investment Period
12 Months
Y/E March (` cr)
4QFY16 3QFY16 4QFY15
% chg (yoy)
% chg (qoq)
Net sales
21,061
14,774
18,968
11.0
42.6
EBITDA
3,193
1,002
2,491
28.2
218.7
Stock Info
Adj. PAT
2,616
791
1,875
39.5
230.7
Source: Company, Angel Research
Sector
Infrastructure
Standalone numbers impress: For 4QFY2016, Larsen & Toubro (L&T) reported
Market Cap (` cr)
137,404
an 11% yoy increase in the top-line to `21,061cr, which is slightly lower than
Net debt (` cr)
11,927
our expectation. Revenue growth on a yoy basis reflects an 11.7%/ 33.3%
Beta
1.3
increase in Infrastructure/ Power segment. EBITDA for the quarter came in
higher than our expectation at `3,193cr. With some of the projects attaining
52 Week High / Low
1,887 /1,017
revenue recognition threshold level, EBITDA margins expanded 203bp yoy to
Avg. Daily Volume
2,283,576
15.2%. This is the first quarter after three successive quarters where the
Face Value (`)
2
company reported yoy increase in its EBITDA margin. Further, the PAT at
`2,539cr has come in ahead of our estimate. On adjusting for gains on
BSE Sensex
26,654
divestment of stake in the Foundry business (`48.5cr) and provision for
Nifty
8,157
impairment on the value of investment (`135cr), Adjusted PAT stood at
Reuters Code
LART.BO
`2,616cr. Adj. PAT margin improved 254bps yoy to 12.4% in 4QFY2016.
Bloomberg Code
LT@IN
Order inflows for consolidated entity in FY2016 declined 9.0% yoy to `43,334cr.
The order backlog stands at `2,49,949cr, thereby giving revenue visibility for
over the next 10 quarters.
Shareholding Pattern (%)
Hydro-carbon business reports minimal losses: With completion of legacy
Promoters
-
projects in the international business, strong execution from ongoing projects
helped the Hydro-carbon segment report 10.9% yoy increase in revenues to
MF / Banks / Indian Fls
39.1
`2,479cr. For the quarter, the segment reported an EBIT level loss of `92cr vs a
FII / NRIs / OCBs
16.6
loss of `209cr in the corresponding quarter a year ago.
Indian Public / Others
44.4
Key positives: More clarity on ongoing asset divestments, IDPL restructuring,
completion of Hydro-carbon legacy projects; net WC cycle at 24% of sales.
Abs. (%)
3m
1yr
3yr
Key Negatives: Miss on FY2016 order inflow guidance.
Sensex
15.9
(4.1)
32.2
Outlook and valuation: L&T’s diversified presence and an anticipated recovery in
the capex cycle coupled with the company’s strong balance sheet comfort us that
LT
36.6
(9.5)
52.0
it is well positioned to benefit from a revival in the award activity environment.
With order backlog expected to grow, execution should pick-up gradually. We
have valued the company using the sum-of-the-parts (SoTP) methodology to
3-year price chart
capture the value of all its businesses and investments. Ascribing separate values
2,000
to its parent business (on a P/E basis) and investments in subsidiaries (using P/E,
P/BV and M-cap basis), we arrive at FY2017E based target price of `1,700. We
1,500
are of the view that L&T is a good proxy play for investors wanting to ride on the
1,000
revival of the Indian infrastructure growth story. Given the 15.3% upside potential
in the stock from the current levels, we upgrade to BUY rating on the stock.
500
Key financials (Standalone)
0
Y/E March (` cr)
FY13
FY14
FY15
FY16
FY17E
FY18E
Net Sales
51,611
56,599
57,017
59,780
67,665
77,249
% chg
9.7
0.7
4.8
13.2
14.2
Net Profit
4,385
5,493
5,056
4,191
5,380
6,685
Source: Company, Angel Research
% chg
25.3
(8.0)
(17.1)
28.4
24.3
EBITDA (%)
10.6
11.8
11.4
10.3
10.7
11.5
EPS (`)
53
59
54
57
57
71
P/E (x)
27.9
25.0
27.3
26.1
25.7
20.7
P/BV (x)
3.2
3.0
2.7
2.5
2.4
2.2
RoE (%)
14.2
15.6
13.3
15.1
12.6
14.3
Yellapu Santosh
RoCE (%)
17.5
18.7
16.3
14.5
15.6
17.6
EV/Sales (x)
2.5
2.6
2.6
2.5
2.2
1.9
022 - 3935 7800 Ext: 6811
EV/EBITDA (x)
23.8
21.9
22.9
24.1
20.7
16.6
Source: Company, Angel Research; Note: CMP as of May 27, 2016
Please refer to important disclosures at the end of this report
1
Larsen & Toubro | 4QFY2016 Result Update
Exhibit 1: Quarterly Performance (Standalone)
Particulars (` cr)
4QFY16
3QFY16
% chg (qoq)
4QFY15
% chg (yoy)
FY16
FY15
% chg
Net Sales
21,061
14,774
42.6
18,968
11.0
59,780
57,017
4.8
Total Expenditure
17,868
13,772
29.7
16,477
8.4
53,609
50,529
6.1
Operating Expenses
16,213
11,819
37.2
14,799
9.6
46,629
44,380
5.1
Employee benefits Expense
1,037
1,200
(13.5)
1,022
1.5
4,480
4,162
7.6
Sales, Admin & Other Expenses
618
753
(18.0)
656
(5.9)
2,500
1,986
25.9
EBITDA
3,193
1,002
218.7
2,491
28.2
6,171
6,488
(4.9)
EBIDTA %
15.2
6.8
13.1
10.3
11.4
Depreciation
255
244
4.1
246
3.5
999
1,008
(0.9)
EBIT
2,939
757
287.9
2,245
30.9
5,172
5,480
(5.6)
Interest and Financial Charges
397
381
4.2
335
18.7
1,449
1,420
2.1
Other Income
737
617
19.4
570
29.2
2,406
2,283
5.4
PBT before Exceptional Items
3,278
993
230.0
2,480
32.2
6,129
6,344
(3.4)
Exceptional Items
77
(92)
(186)
(560)
(357)
PBT after Exceptional Items
3,201
1,085
195.0
2,666
20.1
6,689
6,701
(0.2)
Tax
662
202
227.2
605
9.3
1,378
1,645
(16.3)
% of PBT
20.7
18.6
22.7
20.6
24.5
PAT
2,539
883
187.6
2,061
23.2
5,311
5,056
5.0
Adj. PAT (for excep. Items)
2,616
791
230.7
1,875
39.5
4,751
4,699
1.1
Adj. PAT %
12.4
5.4
9.9
7.9
8.2
Dil. EPS
27.08
9.44
186.9
21.95
23.4
56.80
54.10
5.0
Source: Company, Angel Research
Standalone business
Revenues grew 11% yoy
For the quarter L&T reported an 11% yoy increase in the top-line to `21,061cr,
which is slightly lower than our expectation. Revenue growth on a yoy basis reflects
an 11.7% increase in the Infrastructure segment and a 33.3% increase in the
Power segment. Revenue growth across the Infrastructure segment was owing to
some of the projects awarded in 4QFY2015 reaching the threshold of revenue
recognition. Within the Infra segment, the Transportation Infra, Heavy Civil and
Waters businesses contributed to the revenue growth. Surge in Power segment
revenue is on account of substantial progress seen across coal and gas based
projects under execution. Lower opening order book and slow execution led to
2.2% and 6.1% yoy revenue de-growth across Metallurgical & Material Handling
(MMH) and Electrical & Automation (E&A) segments, respectively.
For the full year FY2016, a strong 44.7% and 3.7% yoy increase in revenue
booking across Power (10.7% of FY2016 revenue) and Infrastructure (69.8% of
FY2016 revenue) segments led the company to report a 4.8% yoy increase in
revenue to `59,780cr.
May 27, 2016
2
Larsen & Toubro | 4QFY2016 Result Update
Exhibit 2: Segment-wise Gross Revenue Split (Standalone)
Particulars (` cr)
4QFY16
3QFY16
% chg (qoq) 4QFY15
% chg (yoy)
FY16
FY15
% chg
Infrastructure
15,949
9,785
63.0
14,278
11.7
42,175
40,652
3.7
Power
1,901
2,107
(9.8)
1,425
33.3
6,451
4,459
44.7
Metallurgical & Material Handling
905
678
33.4
925
(2.2)
2,756
3,303
(16.5)
Heavy Engineering
946
826
14.6
939
0.8
2,935
3,299
(11.0)
Electrical & Automation
1,236
1,085
13.9
1,316
(6.1)
4,228
4,129
2.4
Others
779
791
(1.5)
742
5.0
3,155
2,828
11.6
Less: Inter-segment Revenues
483
327
47.7
479
1.0
1,286
1,112
15.6
Gross Segmental Revenues
21,232
14,944
42.1
19,146
10.9
60,415
57,558
5.0
Source: Company, Angel Research
Exhibit 3: Segment-wise Unadj. EBIT & EBIT Margins (Standalone)
Particulars (` cr)
4QFY16
3QFY16
% chg (qoq)
4QFY15
% chg (yoy)
FY16
FY15
% chg
Infrastructure
2,757
833
230.9
1,958
40.8
5,037
4,443
13.4
EBIT Margin (%)
17.3
8.5
13.7
11.9
10.9
Power
49
79
(37.7)
52
(4.7)
231
201
14.9
EBIT Margin (%)
2.6
3.8
3.6
3.6
4.5
Metallurgical & Material Handling
82
(24)
nmf
61
34.9
42
239
(82.2)
EBIT Margin (%)
9.1
(3.6)
6.6
1.5
7.2
Heavy Engineering
(10)
(17)
nmf
111
nmf
(75)
336
Nmf
EBIT Margin (%)
(1.0)
(2.1)
11.8
(2.5)
10.2
Electrical & Automation
179
122
47.2
196
(8.9)
501
504
(0.6)
EBIT Margin (%)
14.5
11.2
14.9
11.8
12.2
Others
103
136
(24.0)
100
3.4
556
653
(14.9)
EBIT Margin (%)
13.2
17.2
13.4
17.6
23.1
Segmental EBIT (unadj.)
3,160
1,129
180.0
2,477
27.6
6,293
6,377
(1.3)
Source: Company, Angel Research; Note- nmf- Not Meaningful
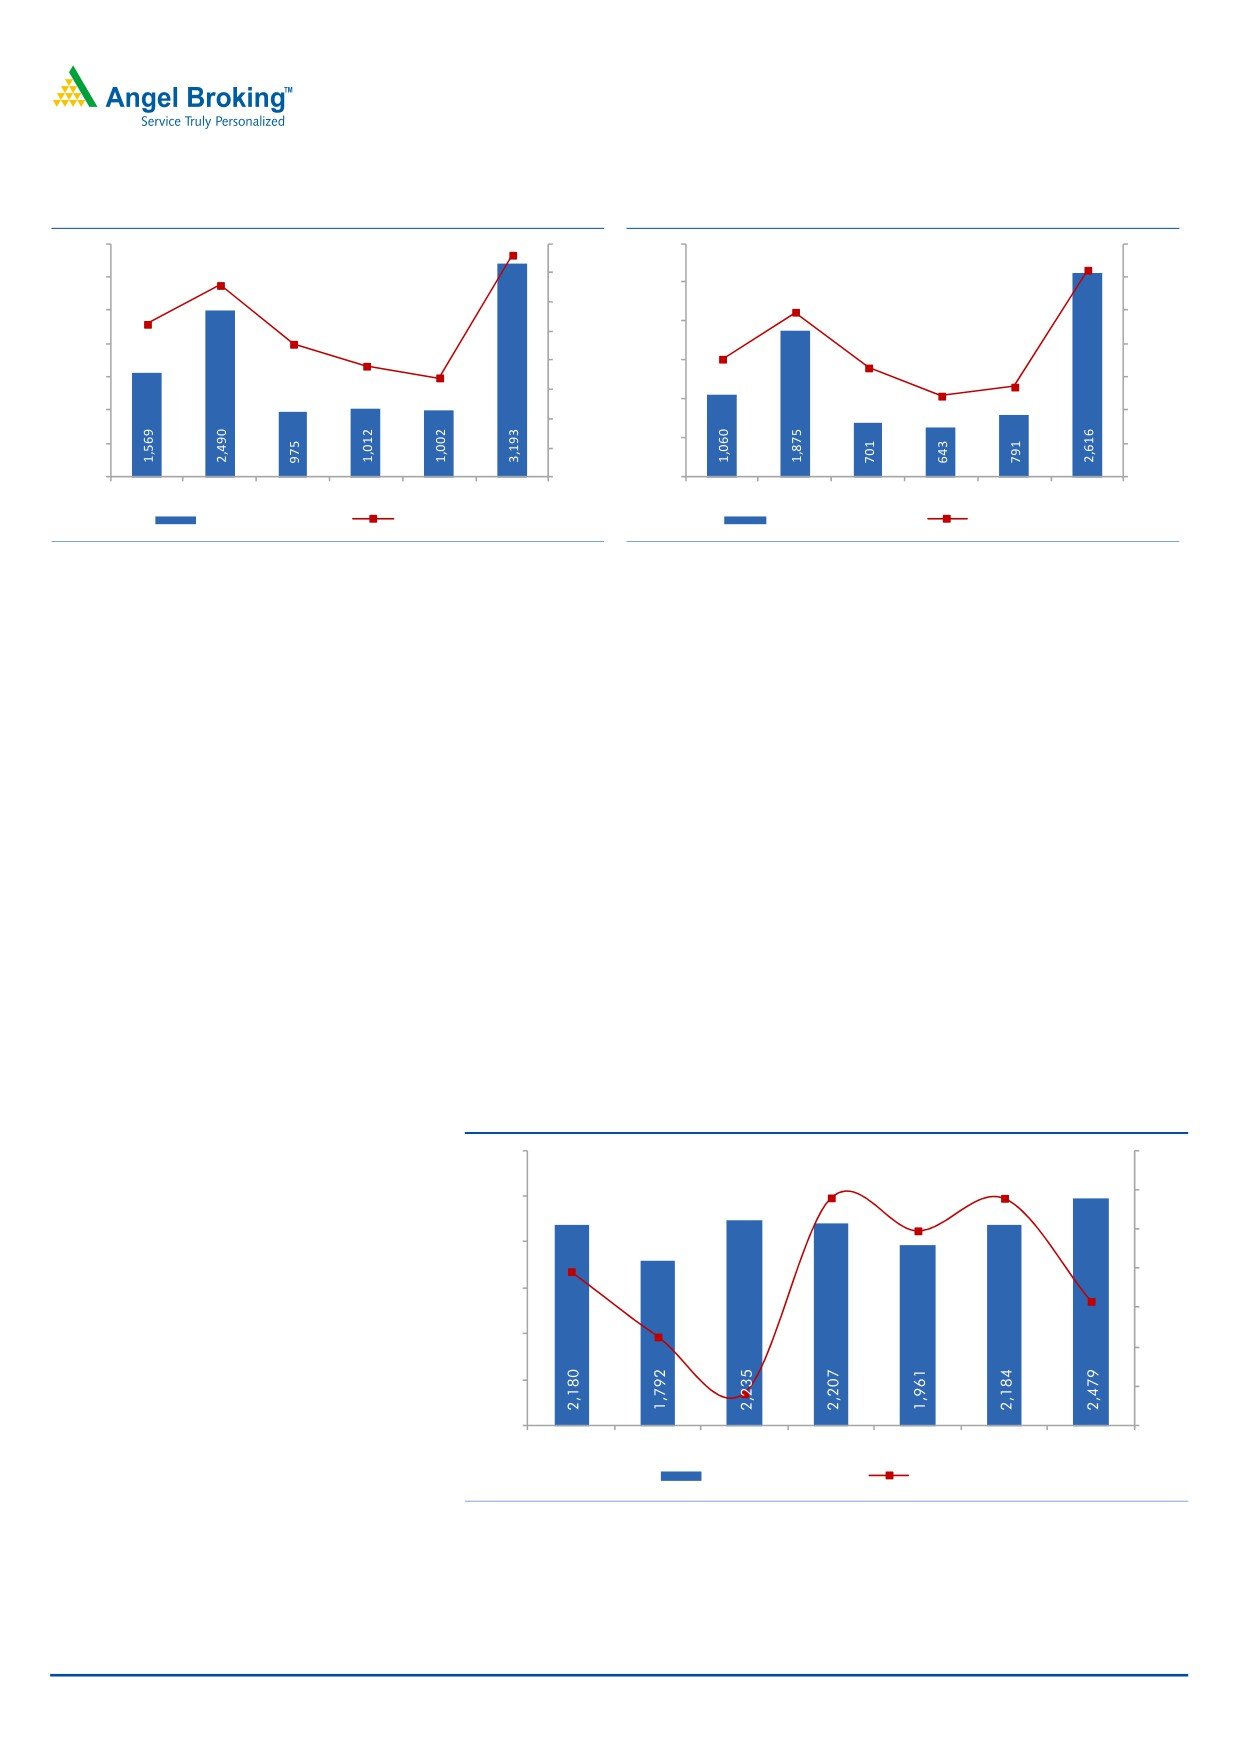
EBITDA margins expand yoy to 15.2%
The company reported higher than expected EBITDA for the quarter at `3,193cr.
With some additional projects attaining the threshold of revenue recognition, L&T
reported a 203bp yoy EBITDA margin expansion to 15.2%. This is the first quarter
after three successive quarters where L&T has been able to report a yoy increase in
its EBITDA margin. Top-line growth coupled with (a) 5.9% yoy decrease in sales,
administrative and other (SAO) expenses (to `618cr), and (b) just a 1.5% yoy
increase in employee expenses (to `1,037cr) led to an expansion in the EBITDA
margin on a yoy basis.
At the segment level, EBIT margins expanded on a yoy basis across the
Infrastructure (up 357bp to 17.3%) and the MMH segment (up 249bp to 9.1%)
while the Heavy Engineering segment reported negative margin on account of cost
provisions and under recoveries.
For FY2016, higher operating, SAO, and employee expenses led to a 106bps yoy
decline in the company’s EBITDA margin to 10.3%. Barring the Infrastructure
segment, all other segments reported yoy declines in their EBIT margins (Heavy
Engineering reported negative margins).
May 27, 2016
3
Larsen & Toubro | 4QFY2016 Result Update
Exhibit 4: EBITDA margin expands to 15.2%
Exhibit 5: Adj. PAT margin expands yoy to 12.4%
3,500
16.0
3,000
14.0
15.2
12.4
13.1
3,000
14.0
12.0
2,500
9.9
10.5
12.0
2,500
10.0
9.1
2,000
10.0
6.5
2,000
7.6
7.1
8.0
6.8
8.0
1,500
5.4
1,500
4.9
6.0
6.0
1,000
1,000
4.0
4.0
500
500
2.0
2.0
0
0.0
0
0.0
3QFY15
4QFY15
1QFY16
2QFY16
3QFY16
4QFY16
3QFY15
4QFY15
1QFY16
2QFY16
3QFY16
4QFY16
EBITDA (`cr, LHS)
EBITDAM (%, RHS)
Adj. PAT (` cr, LHS)
Adj. PATM (%, RHS)
Source: Company, Angel Research
Source: Company, Angel Research
Adj. PAT numbers report strong yoy growth
L&T reported a PAT of `2,539cr for the quarter, ahead of our estimate. On
adjusting for gains on divestment of stake in the Foundry business (`48.5cr) and
provision for impairment on the value of investment (`135cr), the Adjusted PAT
stood at `2,616cr. The Adj. PAT margin improved from 9.9% a year ago to 12.4%
in 4QFY2016. The 39.5% yoy increase in Adj. PAT for the quarter is on account of
28.2% increase in EBITDA, 29.2% increase in other income (to `737cr) and a
lower tax rate.
For the full year FY2016, in-line with EBITDA margin, the Adj. PAT margin also
compressed yoy from 8.2% in FY2015 to 7.9% in FY2016.
Hydro-Carbon business comes out of Legacy projects
At the backdrop of stronger execution, the Hydro-carbon business reported a
10.9% yoy increase in revenue to `2,479cr.
Exhibit 6: Hydro-carbon - Quarterly Revenues & EBIT
3,000
100
40
39
50
2,500
(2)
0
2,000
(54)
(50)
(92)
1,500
(100)
(137)
1,000
(209)
(150)
500
(200)
0
(250)
2QFY15
3QFY15
4QFY15
1QFY16
2QFY16
3QFY16
4QFY16
Revenue (` cr, LHS)
EBIT (` cr, RHS)
Source: Company, Angel Research
May 27, 2016
4
Larsen & Toubro | 4QFY2016 Result Update
The Hydro-carbon business reported `92cr of EBIT level losses for the quarter (vs
`209cr loss in the corresponding period a year ago). The reduction in losses is
owing to higher provisioning and completion of legacy projects in the Middle East.
For FY2016, the Hydro-carbons segment reported a 20% yoy increase in revenues
to `8,787cr, reflecting strong execution (47% of the sales were from International
subsidiaries).
Whereas, EBIT level loss margins declined from -18.1% in FY2015 to -0.2% in
FY2016, owing to close-out costs in international projects and under recovery in
fabrication yards.
IT & Technology Services business reports strong growth
L&T’s IT & Technology Services business reported an impressive 13.0% yoy
increase in revenue for the quarter to `2,295cr. The top-line growth was driven by
growth across sectors such as BFSI, autos, industrial products, and process
engineering. On the operating front, the EBIT margin declined by 64bp yoy to
18.2%.
For FY2016, the segment reported an 18% yoy increase in revenue to `8,956cr.
Similarly, higher manpower utilization and a weaker rupee helped the IT &
Technology Services segment report EBIT margin expansion to 18.6% (in FY2016;
vs 17.2% in FY2015).
May 27, 2016
5
Larsen & Toubro | 4QFY2016 Result Update
Consolidated Business Performance
Revenue grew 18.3% yoy
L&T reported an 18.3% yoy and 28.4% qoq growth in its consolidated business’
top-line to `33,157cr. Revenue growth on a yoy basis reflects (1) strong execution
across Infrastructure segment (19% yoy revenue growth to `18,655cr), (2) projects
under execution achieving substantial progress in the Power segment (51% yoy
increase in revenue to `2,185cr), and (3) 23.4% yoy increase in Others segment
(to `2,028cr). International revenues (~30% of 4QFY2016 revenues) reported a
23% yoy increase in revenues. Strong execution was seen across the Riyadh (40-
45% of civil works completed) and Doha Metro projects (tunneling works
completed, civil works related to stations would start soon).
For FY2016, revenues grew 11.6% yoy to `102,632cr, reflecting 12.3% and 47.4%
increase in Infrastructure & Power segment revenues to `50,387cr and `7,011cr,
respectively.
Exhibit 7: Quarterly Performance (Consolidated)
Particulars (` cr)
4QFY16
3QFY16
% chg (qoq)
4QFY15
% chg (yoy)
FY16
FY15
% chg
Net Sales
33,157
25,829
28.4
28,023
18.3
102,632
92,005
11.6
Total Expenditure
28,298
23,179
22.1
24,427
15.8
90,289
80,747
11.8
Man. Cons. & Opex Exp. (MCO)
24,435
19,049
28.3
20,783
17.6
74,946
67,240
11.5
Employee benefits Expense
2,242
2,411
(7.0)
2,049
9.4
9,205
8,060
14.2
Sales, Admin & Other Expenses
1,620
1,719
(5.7)
1,595
1.6
6,138
5,446
12.7
EBITDA
4,859
2,650
83.4
3,595
35.2
12,343
11,258
9.6
EBIDTA %
14.7
10.3
12.8
12.0
12.2
Depreciation
820
620
32.3
588
39.5
2,756
2,623
5.1
EBIT
4,039
2,030
98.9
3,007
34.3
9,587
8,635
11.0
Interest and Financial Charges
774
745
3.9
469
65.1
3,041
2,840
7.1
Other Income
218
452
(51.7)
290
(24.6)
1,183
1,075
10.1
PBT before Exceptional Items
3,483
1,737
100.5
2,828
23.2
7,729
6,870
12.5
Exceptional Items
(49)
0
(98)
(358)
(348)
PBT after Exceptional Items
3,532
1,737
103.3
2,927
20.7
8,087
7,217
12.0
Tax
954
556
71.7
766
24.5
2,549
2,253
13.1
% of PBT
27.0
32.0
26.2
31.5
31.2
PAT before Minority Int.
2,578
1,182
118.2
2,161
19.3
5,538
4,964
11.6
Extra-Ordinary Items
0
0
0
0
0
Share in profit of Associates (net)
(2)
(2)
(2)
(3)
2
Adj. of Minority Interests
(123)
(145)
(90)
(445)
(201)
PAT after Minority Interest
2,454
1,035
137.1
2,070
18.6
5,091
4,765
6.8
Adj. PAT (for excep. Items)
2,405
1,035
132.4
1,971
22.0
4,732
4,417
7.1
Adj. PAT %
7.3
4.0
7.0
4.6
4.8
Dil. EPS
26.17
11.07
136.4
22.05
18.7
54.44
50.98
6.8
Source: Company, Angel Research
May 27, 2016
6
Larsen & Toubro | 4QFY2016 Result Update
EBITDA margins expand yoy to 14.7%
The company reported an 182bp yoy expansion in the EBITDA margin for the
quarter to 14.7%. The surge in margin was restricted owing to (1) 17.6% yoy
increase in Man. Cons. & Opex Exp. (MCO) expenses to `24,435cr, and (2) 9.4%
yoy increase in Employee expenses to `2,242cr. Surge in employee expenses is on
account of manpower augmentation, impact of normal revisions witnessed in
earlier quarter and higher staff mix from international operations. SAO expenses
increased 1.6% yoy owing to higher provisions.
Further, if we look at segment-wise details, then the EBIT margin benefitted from a
yoy expansion in segment margins across Infrastructure (322bp) and MMH
(253bp) and narrowing of loss margins across Hydrocarbons business (-566bp).
Higher SGA expenses (mainly the provisioning) and staff costs (owing to hiring
related to international business) led to marginal decline of 20bp yoy in EBITDA
margins to 12.0% in FY2016.
Adj. PAT margins expands marginally to 7.3%
L&T reported a PAT of `2,454cr for 4QFY2016. PAT margins of the company were
at 7.4%, almost the same as in the previous year. Despite a yoy EBITDA margin
expansion, a 24.6% decline in other income (to `218cr), 39.5% increase in
depreciation expenses (to `820cr) and marginally higher tax rates (at 27.0% in
4QFY2016 vs 26.2% in 4QFY2015) led to an 18.6% yoy increase in PAT. On
adjusting for exceptional items, the PAT of the company was at `2,405cr. The Adj.
PAT margin was at
7.3% in 4QFY2016, slightly better than
7.0% in the
corresponding quarter a year ago.
For the full year, effect of marginal decline in EBITDA margin was felt at the Adj.
PAT margins level too which stood at 4.6%.
May 27, 2016
7
Larsen & Toubro | 4QFY2016 Result Update
Order inflow growth disappoints the street…
Consolidated order inflow for the quarter decreased 9.0% yoy to `43,334cr (on
excluding Services business, order inflow reported 10.7% yoy decrease). A majority
of 4QFY2016 order inflows were from Infra (contributed by Building & Factories,
Power Transmission & Distribution and Transportation Infra), Hydro-Carbon and
Electrical & Automation businesses. A third of the order wins during the quarter are
from International markets.
On the whole, order inflows for FY2016 missed the guidance as anticipated.
Order Inflows for FY2016 declined 11.9% yoy to `136,858cr.
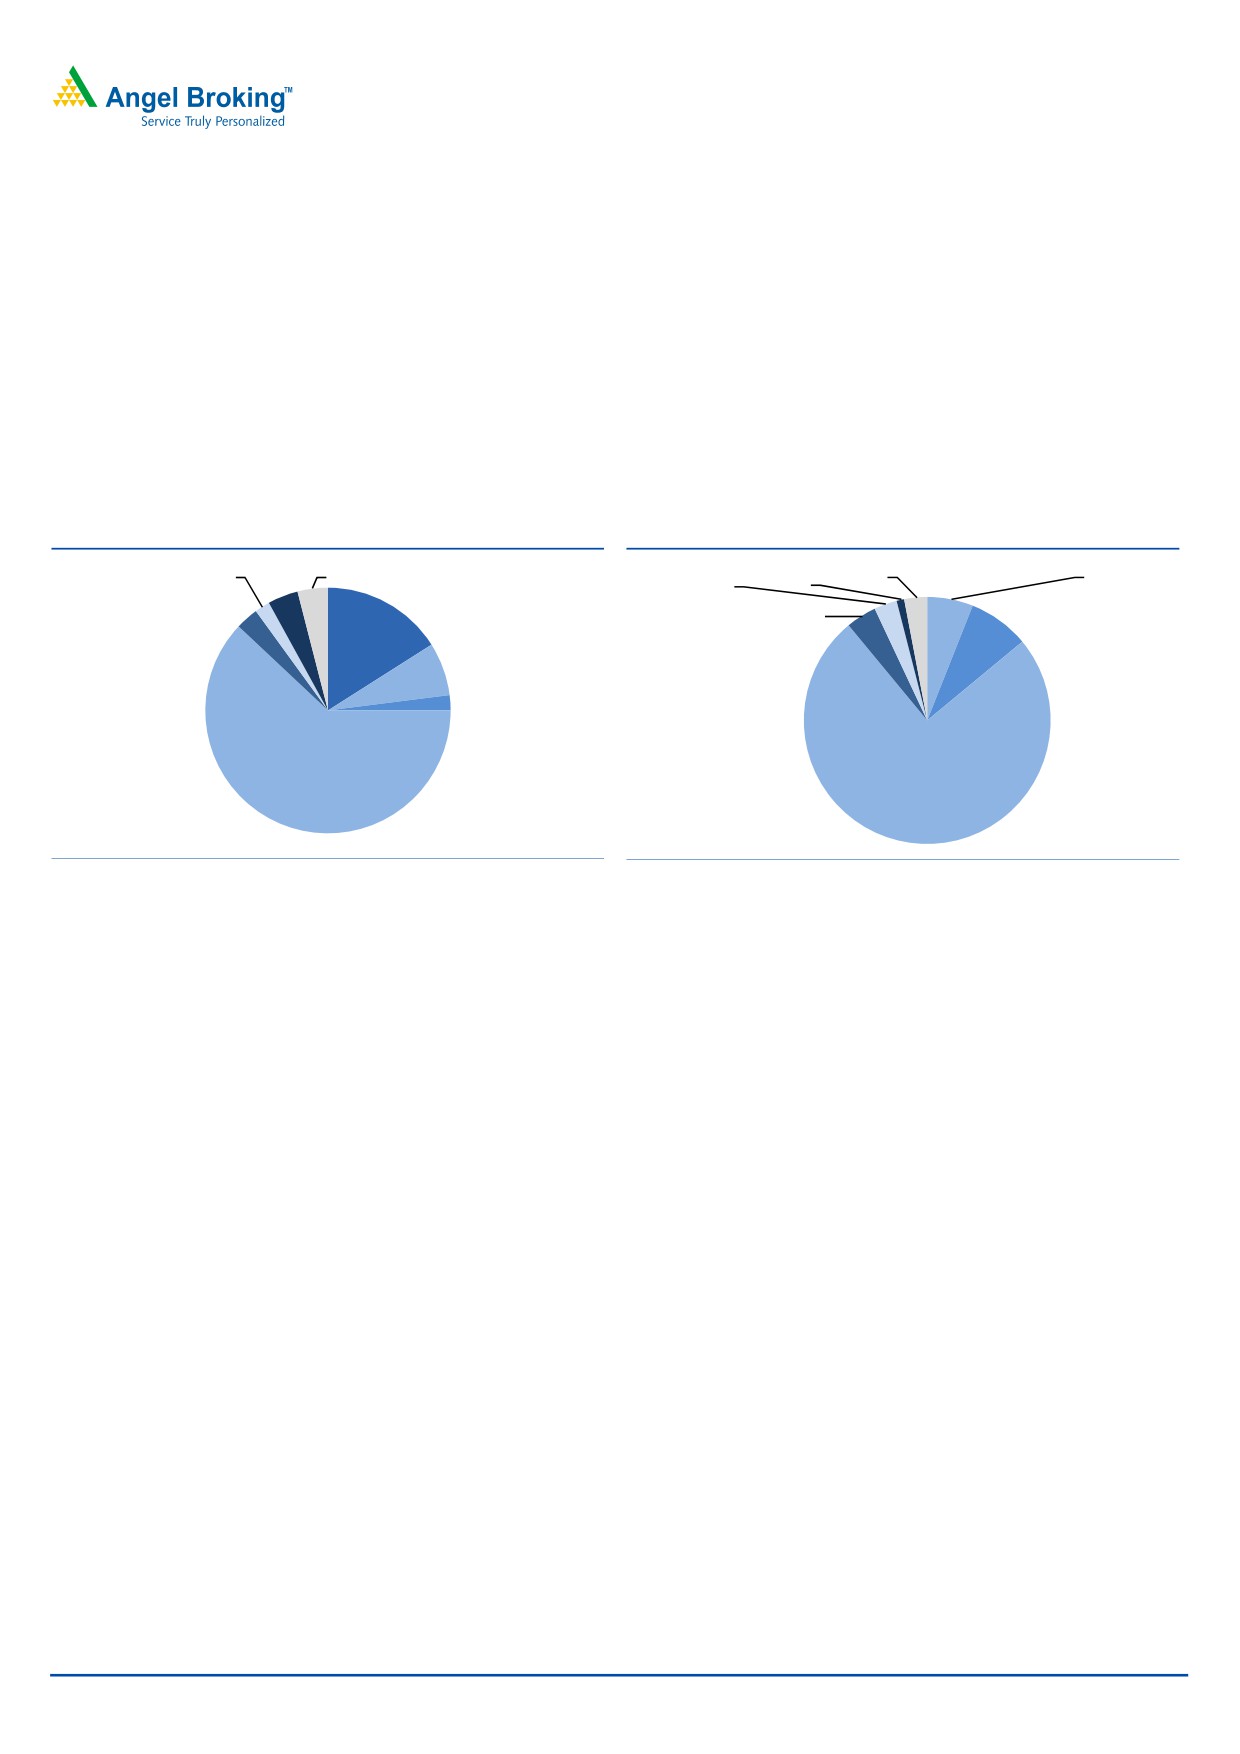
Exhibit 8: 4QFY16 Order Inflows mix (consol.)
Exhibit 9: 4QFY16 Order Book mix (consol.)
HE, 2%
Others, 3%
Hydrocarbon,
EA, 4%Others, 4%
HE, 3%
EA, 1%
Services, 0%
6%
MMH, 3%
Power, 8%
MMH, 4%
Services, 16%
Hydrocarbon,
7%
Power, 2%
Infrastructure,
62%
Infrastructure,
75%
Source: Company, Angel Research
Source: Company, Angel Research
L&T’s order book currently stands at `2,49,949cr, indicating a 7.4% yoy growth.
As of 4QFY2016, L&T’s order book is majorly dominated by Infra (75%), followed
by Power
(8%) and Hydro-carbon
(6%) segments. International order book
constitutes 28% of the total order book. The current order book gives revenue
visibility for over the next 10 quarters.
The Management has given 15% order inflow guidance for FY2017E on the back
of strong pipeline of projects coming-up for awarding. Some of the key highlights
on the bid pipeline front include, (1) strong pipeline of projects across Roads &
Highways (participated in bids worth `22,000cr), (2) Power (expect order wins to
the tune of `10,000cr), (3) large ticket projects nearing the awarding stage in the
Defense sector and (4) expect `17,000-18,000cr of projects to be awarded from
the Dedicated Freight Corridor (DFC).
May 27, 2016
8
Larsen & Toubro | 4QFY2016 Result Update
Ongoing developments
L&T in order to transform itself into an asset light business is
1. Pursuing IDPL re-structuring; this is at advanced stages. With 13 of the 15
Road BOT projects operational (8 operational for >12 months) and 1
Transmission project operational, there exists a strong case of L&T pursuing
Infrastructure Investment Trust (InvITs) route.
2.
1 (Nabha) of the 5 Power plants operational is at advanced stages of being
sold.
3. Currently negotiating the sale of its General Insurance business.
All these asset divestment initiatives in our view should be looked upon positively.
Given that all these businesses are capital intensive and consume higher capital,
L&T’s overall capital requirements would subside once the sale happens.
Valuation
We upgrade to BUY with target price of `1,700
We believe L&T has a better chance to beat its order inflow guidance and also
attain its revenue growth guidance for FY2017 (in the range of 12-15%). Further,
on considering FY2016 results for Hydro-carbon vertical, we expect improved
performance to continue in FY2017. Improved performance from this should lead
to consol. margin expansion. On the whole, L&T with its diverse business profile
(E&C, Power, Alternate Energy, Roads & Highways, Defense, Metros, Urban Infra)
is well positioned to benefit from revival in domestic infra capex cycle.
Exhibit 10: Derivation of SOTP-based target price for L&T (FY2017E)
Business Segment
Methodology
Remarks
` cr
`/share
% to TP
L&T- Parent
P/E
15.0x FY2018E Earnings
100,276
1,061
62.4
Infrastructure Subsidiaries
IDPL
P/BV
1.5x FY2017E BV
11,431
121
7.1
Key Subsidiaries - Services
L&T InfoTech
P/E
15.0x FY2017E Earnings
27,127
287
16.9
L&T Finance
M-cap Basis
20% holding company discount
6,973
74
4.3
Realty Space
L&T Realty (inc. Seawoods Realty)
P/BV
1.0x FY2017E BV
4,000
43
2.5
Hydro-Carbons Business
Hydro-Carbons
P/BV
1.5x FY2017E BV
2,100
22
1.3
Key Subsidiaries - Manufacturing
L&T Power-equipment JVs
P/BV
1.0x FY2017E BV
700
7
0.4
Other Associate Companies
P/BV
1.0x FY2017E BV
5,500
59
3.5
International Business
International Subsidiaries
P/BV
1.5x FY2017E BV
2,400
26
1.5
Grand Total
160,507
1,700
100
Upside
15.3%
CMP
1,475
Source: Company, Angel Research
May 27, 2016
9
Larsen & Toubro | 4QFY2016 Result Update
We have valued the company using sum-of-the-parts (SOTP) methodology to
capture the value of all its businesses and investments. Ascribing separate values to
its parent business on a P/E basis and investments in subsidiaries (using P/E, P/BV
and M-cap basis), we arrive at a FY2017E target price of `1,700. At the current
market price of `1,475, the standalone entity is trading at an implied P/E multiple
of 11.7x (FY2018E), which is attractive. We are of the view that L&T is a proxy play
for investors wanting to play on the revival in the Indian infrastructure growth story.
Given the 15.3% upside in the stock from the current levels, we upgrade our rating
on the stock to BUY.
Investment arguments
Indian capex recovery is a matter of time: Regular announcements on the
policy front have eased the environment for capex revival. This along with
ongoing rate cuts makes us believe that recovery is very much on cards.
Considering that the awarding activity revival should further pick-up, we sense
full-fledged recovery to be seen from 2HFY2017E onwards. Further we expect
improvement in L&T's execution and margin expansion from FY2017E
onwards.
Uptick in the domestic order inflow environment should lead to shift in order
inflow mix more towards the domestic markets, going forward. On the back of
shift in order book towards domestic markets, we expect uptick in execution.
Accordingly, we have modeled a 13.7% top-line CAGR over FY2016-2018E.
Given that L&T is currently sitting on an order book which gives revenue
visibility for over 10 quarters, this shift in order inflow mix should help the
company in faster margin recovery. We expect EBITDA margins to expand
from 10.3% in FY2016 to 11.5% in FY2018E.
Best stock to play the Indian infrastructure theme: We are of the view that L&T
is very well positioned to benefit from gradual recovery in the domestic capex
cycle, given its diverse sectoral exposure, strong balance sheet and better cash
flow generating potential in comparison to its peers, which are struggling with
higher leverage, and strained cash flows.
Company background
L&T, the largest Indian infrastructure conglomerate, is present across almost all the
infrastructure segments and is at the forefront of the Indian infra growth story.
Over the years, the company has diversified across various segments to encash the
untapped infra opportunity, not only in India but in other geographies as well, and
has an excellent track record of achieving the same. Currently, L&T manufactures
and services its business in over 30 countries worldwide.
May 27, 2016
10
Larsen & Toubro | 4QFY2016 Result Update
Profit & loss statement (Standalone)
Y/E March (` cr)
FY13
FY14
FY15
FY16
FY17E
FY18E
Net Sales
51,611
56,599
57,017
59,780
67,665
77,249
% Chg
9.7
0.7
4.8
13.2
14.2
Total Expenditure
46,138
49,932
50,530
53,609
60,459
68,404
RM & Contracting Expenses
40,205
43,346
44,397
46,629
52,610
59,636
Employee benefits Expense
3,861
4,662
4,151
4,480
5,075
5,794
Sales, Admin. & Other Exp.
2,072
1,923
1,982
2,500
2,774
2,974
EBITDA
5,473
6,667
6,488
6,171
7,206
8,845
% Chg
22
(3)
(5)
17
23
EBIDTA %
10.6
11.8
11.4
10.3
10.7
11.5
Depreciation
728
792
1,008
999
1,035
1,078
EBIT
4,745
5,875
5,480
5,172
6,171
7,767
% Chg
23.8
(6.7)
(5.6)
19.3
25.9
Interest and Financial Chrg.
955
1,076
1,419
1,449
1,508
1,531
Other Income
1,887
1,881
2,283
2,406
2,607
2,798
PBT
5,678
6,679
6,344
6,129
7,270
9,034
Exceptional Item
(176)
(589)
(357)
560
0
0
PBT after Exceptional Item
5,854
7,268
6,701
5,569
7,270
9,034
Tax Expenses
1,541
1,775
1,645
1,378
1,890
2,349
% of PBT
27.1
26.6
25.9
22.5
26.0
26.0
PAT before Extra-Ord. Items
4,313
5,493
5,056
4,191
5,380
6,685
Extra-Ordinary Item
(72)
0
0
0
0
0
Rep. PAT
4,385
5,493
5,056
4,191
5,380
6,685
% Chg
25.3
(8.0)
(17.1)
28.4
24.3
PAT %
8.5
9.7
8.9
7.0
8.0
8.7
Diluted EPS (after Extra-ord. Items)
53
59
54
57
57
71
% Chg
11.6
(8.3)
4.6
1.3
24.3
May 27, 2016
11
Larsen & Toubro | 4QFY2016 Result Update
Balance Sheet (Standalone)
Y/E March (` cr)
FY13
FY14
FY15
FY16
FY17E FY18E
Sources of Funds
Equity Capital
123
185
186
186
186
186
Reserves Total
29,020
33,476
36,899
40,532
44,162
49,067
Networth
29,143
33,662
37,085
40,718
44,348
49,253
Total Debt
8,834
11,459
12,937
13,608
13,700
12,500
Other Long-term Liabilities
788
393
470
523
569
611
Deferred Tax Liability
242
410
363
203
203
203
Total Liabilities
39,007
45,924
50,854
55,053
58,820
62,567
Application of Funds
Gross Block
11,855
11,397
12,604
13,461
14,511
15,631
Accumulated Depreciation
3,550
3,836
4,844
5,843
6,878
7,956
Net Block
8,305
7,561
7,760
7,619
7,634
7,676
Capital WIP
597
676
222
50
60
65
Investments
16,103
19,215
23,053
24,569
25,359
27,439
Current Assets
47,419
50,853
55,869
64,832
65,628
68,941
Inventories
2,064
1,983
2,208
1,888
2,275
2,355
Sundry Debtors
22,613
21,539
23,051
26,309
25,000
25,500
Cash and Bank Balance
1,456
1,783
1,516
1,681
1,797
2,349
Loans & Advances
9,413
10,067
10,533
13,237
14,279
15,450
Other Current Asset
11,873
15,481
18,562
21,717
22,277
23,287
Current Liabilities
33,417
32,381
36,050
42,017
39,860
41,553
Net Current Assets
14,002
18,472
19,820
22,815
25,768
27,388
Total Assets
39,007
45,924
50,854
55,053
58,820
62,567
May 27, 2016
12
Larsen & Toubro | 4QFY2016 Result Update
Cash Flow Statement (Standalone)
Y/E March (` cr)
FY13
FY14
FY15
FY16
FY17E FY18E
Profit before tax
5,678
6,679
6,344
6,129
7,270
9,034
Depreciation
728
792
1,008
999
1,035
1,078
Change in Working Capital
(3,703)
(5,029)
(1,579)
(3,730)
(3,748)
(1,986)
Net Interest & Financial Charges
422
581
909
929
973
996
Direct taxes paid
(1,653)
(1,977)
(1,645)
(1,378)
(1,890)
(2,349)
Cash Flow from Operations
1,472
1,047
5,037
2,949
3,640
6,773
(Inc)/ Dec in Fixed Assets
(1,000)
(962)
(1,655)
(1,030)
(1,040)
(1,115)
(Inc)/ Dec in Investments
1,657
(252)
(2,345)
508
528
(780)
Cash Flow from Investing
657
(1,214)
(3,999)
(521)
(512)
(1,895)
Issue/ (Buy Back) of Equity
163
144
0
0
0
0
Inc./ (Dec.) in Loans
(1,515)
2,612
1,478
672
92
(1,200)
Dividend Paid (Incl. Tax)
(1,115)
(1,227)
(1,375)
(1,485)
(1,595)
(1,595)
Interest Expenses
(850)
(1,025)
(1,419)
(1,449)
(1,508)
(1,531)
Cash Flow from Financing
(3,316)
504
(1,316)
(2,262)
(3,012)
(4,326)
Inc./(Dec.) in Cash
(410)
337
(278)
165
116
552
(inc. of Disc. Operat.)
Opening Cash balances
1,906
1,496
1,794
1,516
1,681
1,797
Closing Cash balances
1,496
1,794
1,516
1,681
1,797
2,349
May 27, 2016
13
Larsen & Toubro | 4QFY2016 Result Update
Key Ratios (Standalone)
Y/E March
FY13
FY14
FY15
FY16
FY17E
FY18E
Valuation Ratio (x)
P/E (on FDEPS)
27.9
25.0
27.3
26.1
25.7
20.7
P/CEPS
24.6
21.8
22.8
21.9
21.6
17.8
Dividend yield (%)
0.8
0.8
0.9
1.0
1.1
1.1
EV/Sales
2.5
2.6
2.6
2.5
2.2
1.9
EV/EBITDA
23.8
21.9
22.9
24.1
20.7
16.6
EV / Total Assets
3.3
3.2
2.9
2.7
2.5
2.4
Per Share Data (`)
EPS (fully diluted)
52.9
59.0
54.1
56.6
57.3
71.2
Cash EPS
59.9
67.5
64.6
67.2
68.3
82.7
DPS
12.0
12.3
13.3
14.4
15.4
15.4
Book Value
464
493
542
586
626
666
Returns (%)
RoCE (Pre-tax)
17.5
18.7
16.3
14.5
15.6
17.6
Angel RoIC (Pre-tax)
17.5
17.2
15.5
13.9
15.1
17.1
RoE
14.2
15.6
13.3
15.1
12.6
14.3
Turnover ratios (x)
Asset Turnover (Gross Block) (X)
4.4
4.9
4.8
4.6
4.8
5.1
Inventory / Sales (days)
15
13
13
13
11
11
Receivables (days)
160
142
143
151
138
119
Payables (days)
134
122
127
139
129
111
Leverage Ratios (x)
D/E ratio (x)
0.3
0.3
0.3
0.3
0.3
0.3
Interest Coverage Ratio (x)
6.9
7.2
5.5
5.2
5.8
6.9
May 27, 2016
14
Larsen & Toubro | 4QFY2016 Result Update
Research Team Tel: 022 - 39357800
DISCLAIMER
Angel Broking Private Limited (hereinafter referred to as “Angel”) is a registered Member of National Stock Exchange of India Limited,
Bombay Stock Exchange Limited and Metropolitan Stock Exchange of India Limited. It is also registered as a Depository Participant with
CDSL and Portfolio Manager with SEBI. It also has registration with AMFI as a Mutual Fund Distributor. Angel Broking Private Limited is
a registered entity with SEBI for Research Analyst in terms of SEBI (Research Analyst) Regulations, 2014 vide registration number
INH000000164. Angel or its associates has not been debarred/ suspended by SEBI or any other regulatory authority for accessing
/dealing in securities Market. Angel or its associates including its relatives/analyst do not hold any financial interest/beneficial
ownership of more than 1% in the company covered by Analyst. Angel or its associates/analyst has not received any compensation /
managed or co-managed public offering of securities of the company covered by Analyst during the past twelve months. Angel/analyst
has not served as an officer, director or employee of company covered by Analyst and has not been engaged in market making activity
of the company covered by Analyst.
This document is solely for the personal information of the recipient, and must not be singularly used as the basis of any investment
decision. Nothing in this document should be construed as investment or financial advice. Each recipient of this document should
make such investigations as they deem necessary to arrive at an independent evaluation of an investment in the securities of the
companies referred to in this document (including the merits and risks involved), and should consult their own advisors to determine
the merits and risks of such an investment.
Reports based on technical and derivative analysis center on studying charts of a stock's price movement, outstanding positions and
trading volume, as opposed to focusing on a company's fundamentals and, as such, may not match with a report on a company's
fundamentals.
The information in this document has been printed on the basis of publicly available information, internal data and other reliable
sources believed to be true, but we do not represent that it is accurate or complete and it should not be relied on as such, as this
document is for general guidance only. Angel Broking Pvt. Limited or any of its affiliates/ group companies shall not be in any way
responsible for any loss or damage that may arise to any person from any inadvertent error in the information contained in this report.
Angel Broking Pvt. Limited has not independently verified all the information contained within this document. Accordingly, we cannot
testify, nor make any representation or warranty, express or implied, to the accuracy, contents or data contained within this document.
While Angel Broking Pvt. Limited endeavors to update on a reasonable basis the information discussed in this material, there may be
regulatory, compliance, or other reasons that prevent us from doing so.
This document is being supplied to you solely for your information, and its contents, information or data may not be reproduced,
redistributed or passed on, directly or indirectly.
Neither Angel Broking Pvt. Limited, nor its directors, employees or affiliates shall be liable for any loss or damage that may arise from
or in connection with the use of this information.
Note: Please refer to the important ‘Stock Holding Disclosure' report on the Angel website (Research Section). Also, please refer to the
latest update on respective stocks for the disclosure status in respect of those stocks. Angel Broking Pvt. Limited and its affiliates may
have investment positions in the stocks recommended in this report.
Disclosure of Interest Statement
L&T
1. Analyst ownership of the stock
No
2. Angel and its Group companies ownership of the stock
No
3. Angel and its Group companies' Directors ownership of the stock
No
4. Broking relationship with company covered
No
Note: We have not considered any Exposure below ` 1 lakh for Angel, its Group companies and Directors
Ratings (Based on expected returns
Buy (> 15%)
Accumulate (5% to 15%)
Neutral (-5 to 5%)
over 12 months investment period):
Reduce (-5% to -15%)
Sell (< -15)
May 27, 2016
15