Initiating Coverage | Infrastructure
December 16, 2011
ASHOKA BUILDCON
BUY
CMP
`189
At the crossroads
Target Price
`245
Ashoka Buildcon (ABL), traditionally a state player, has transformed into a
Investment Period
12 Months
national player by winning four NHAI projects totaling to a TPC of ~`5,156cr.
However, this transition has come at a cost, as it entails premium commitments to
Stock Info
NHAI (~`220cr per year, albeit covered by toll collections during the construction
Sector
Infrastructure
period) and huge equity contributions from ABL’s side, which we believe would
Market Cap (` cr)
994
stretch its leverage (consolidated net D/E is expected to rise from 1.4x in FY2011
Beta
0.4
to 3.0x by FY2013E). We have valued ABL on an SOTP basis - by assigning 5.0x
EV/EBITDA to its standalone business (`104/share) and valued its BOT projects on
52 Week High / Low
312/180
NPV basis (`141/share). We initiate coverage with a Buy rating on the stock and
Avg. Daily Volume
2,134
a SOTP target price of `245/share and key catalyst being raising equity from
Face Value (`)
10
capital markets.
BSE Sensex
15,476
Integrated business model: ABL boasts of an integrated business model in place
Nifty
4,652
with strong in-house execution capabilities, which helps it to have control over
Reuters Code
ABDL.BO
time and cost - the two key essentials of road development business. In the past,
Bloomberg Code
ASBL@IN
many industry players have witnessed severe strain on the financials and
profitability of their projects because of their inability to control these important
factors. Even in current times, there are developers who do not have an integrated
Shareholding Pattern (%)
business model and are dependent on contractors for construction activities,
Promoters
73.2
making them vulnerable. Hence, we believe players (read ABL) having an
MF / Banks / Indian Fls
23.7
integrated business model are better placed.
FII / NRIs / OCBs
1.6
Road sector; opportunities galore: NHAI has set itself an aggressive target of
Indian Public / Others
1.5
awarding ~9,371km of road projects in FY2012 against ~5,000km in FY2011.
NHAI has done a commendable job by handing out ~4,000km so far in FY2012.
Going ahead, NHAI, state and rural projects are expected to garner investments
Abs. (%)
3m
1yr
3yr
of `6.1trillion over FY2012-16E, which augurs well for road developers.
Sensex
(8.5)
(22.0)
55.3
Prefer IRB over ABL in the Road BOT space: We initiate coverage on ABL with a
ABL
(28.1)
(34.4)
#
Buy rating and a SOTP target price of `245. Our analysis indicates that ABL
Note: # listed in Oct 2010
would need to infuse equity up to ~`990cr (FY2012-14E) in various SPVs; this
would be substantially funded by the PE route, as per management. However, we
have not factored the same in our estimates, given the gloomy market conditions;
instead, we have penciled in the increase in debt levels. In recent times, markets
have been harsh on companies with loose financial discipline and, hence, we are
conservative in assigning trading multiples to ABL. Therefore, we prefer IRB over
ABL, considering ABL’s comparatively smaller size, dependency on capital
markets for equity and projects at nascent stage.
Key financials (Consolidated)
Y/E March (` cr)
FY2010
FY2011 FY2012E
FY2013E
Net Sales (incl op. income)
796
1,302
1,627
1,831
% chg
53.5
63.7
25.0
12.5
Adj. Net Profit
80.4
100.8
110.7
130.2
% chg
130.8
25.5
9.8
17.6
FDEPS (`)
15.3
19.2
21.0
24.7
EBITDA Margin (%)
26.9
19.4
21.7
23.1
Shailesh Kanani
P/E (x)
12.4
9.9
9.0
7.6
022-39357800 Ext: 6829
RoAE (%)
21.2
14.9
11.7
12.2
RoACE (%)
10.7
9.3
8.5
7.5
P/BV (x)
2.2
1.1
1.0
0.9
Nitin Arora
EV/Sales (x)
2.6
1.7
1.9
2.4
022-39357800 Ext: 6842
EV/EBITDA (x)
9.5
8.8
8.8
10.3
Source: Company, Angel Research
Please refer to important disclosures at the end of this report
1
Initiating Coverage | Infrastructure
Investment arguments
Integrated business model
We believe the BOT business has three most important aspects, namely:
1) Project planning; 2) C&EPC activities; and 3) Post construction activities (O&M).
1) Project planning (PP): Given the back-ended nature of cash flows from
ABL’s long stint in the road BOT
BOT assets, reliable assessment of future traffic growth, cost estimates etc
business has helped it to gain rich
become pertinent. Over the course of more than 15 years in toll-based
experience - strengthening its ability to
BOT projects, ABL has developed an in-house traffic study team, which
accurately plan for BOT projects.
has the dual responsibility of conducting pre-bidding traffic surveys and
monitoring toll collections. This process has helped ABL’s team in gaining
experience - by comparing the actual performance with the forecasted
traffic numbers. Therefore, we believe this experience strengthens its
ability to plan accurately for future BOT projects.
ABL has its own construction equipment
2) C&EPC activities: The company’s EPC division, with its experienced team
and in-house RMC and bitumen
of engineers and skilled workmen and its fleet of construction equipment,
division.
constructs and maintains the projects - leading to control over time and
cost. ABL’s in-house RMC and bitumen division manufactures and
supplies concrete and bitumen - leading to better operating margins.
ABL utilizes its own toll collection audit
3) Post construction activities: Once the projects are operational, the main
system to minimize the chance of cash
source of revenue, toll collection, is received in cash. There are numerous
pilferages and the in-house construction
surveys and papers on this subject, indicating cash pilferage of ~10% in
team ensures smooth O&M throughout
toll collections. To seal this loophole, ABL utilizes its own toll collection
the life of the project.
audit system, which includes cameras installed at toll booths and own
proprietary software. The system enables to monitor toll collection on a
real-time basis. Also, having an in-house construction team ensures
smooth operations and maintenance (O&M) throughout the project’s life.
Exhibit 1: ABL and IRB - Both have an integrated business model covering major pivotal points of road projects
Life cycle of a road project
PP
LoA
FC
Designing
Construction
Operation
Revenue stream for ABL
Y
n.a.
N
Y
Y
Y
Revenue stream for IRB
Y
n.a.
N
Y
Y
Y
Revenue stream for ITNL
Y
n.a.
Y
Y
N
Y
Revenue stream for other operators
N
n.a.
N
N
Y
Y
Source: Company, Angel Research
ABL’s integrated structure allows to
This integrated business model ensures the timely completion of projects, reduces
capture the entire value in the BOT
its reliance on subcontractors and controls costs. In the past, many industry players
development business, including EPC
have witnessed severe strain on the financials and profitability of their projects
margins, developer returns and
because of their inability to control these important factors. Even in current times,
operation and maintenance margins.
there are developers who do not have an integrated business model and are
dependent on contractors for construction activities, thus making them vulnerable.
December 16, 2011
2
Initiating Coverage | Infrastructure
Completed Projects
Date of completion
ABL has been able to timely execute its projects, owing to its integrated business
Scheduled
Actual
model (as depicted in the table). Further, it results in extended period of toll
collection, which in turn helps in increasing overall revenue. It also allows
Dewas Bypass
Jul-04 May-04
capturing the entire value in the BOT development business, including EPC
Wainganga Bridge
May-01 Mar-01
margins, developer returns and operation and maintenance margins. Hence, we
Nashirabad RoB
Nov-00 Jul-00
believe players such as ABL, having an integrated business model, are better
Sheri Nallah Bridge
Mar-01 Nov-00
placed in current competitive times.
Anawali-Kasegaon
Jul-04 Mar-04
Road sector - Opportunities galore
The road segment continues to offer plenty of opportunities for road concentrated
NHAI is yet to award 21,117km of the
players such as ABL. Of the 49,254km (refer exhibit below) of the planned NH
planned 49,254km NH, ~7,000km of
under the National Highways Development Project (NHDP), the NHAI is still left
which is likely to be awarded in FY2012
with ~21,117km (refer exhibit below) that has to be awarded. NHAI has set itself
itself.
an aggressive target of awarding ~9,371km (originally 7,300km + 2,071km
added after the PM’s intervention) of road projects in FY2012 against ~5,000km
awarded in FY2011. NHAI has done a commendable job by handing out
~4,000km so far in the current fiscal and is looking on track to achieve over
~7,000km of project awarding in FY2012. Going ahead, even state highways
provide significant opportunities to players. Also, on the anvil, there are plans to
build 18,367km of expressways by 2022 in three phases. Around 1,000km of
expressway is expected to be completed over the next five years, representing an
opportunity of ~`203bn (average capex per km is ~`20cr). The government has
Apart from NH, state highways,
also identified nine mega projects with length ranging from 390km to 700km.
expressways and mega projects provide
Over the next five years, an investment of ~`423bn is expected to flow into mega
a number of opportunities to companies
projects. In all, these initiatives would provide immense opportunity (`6.1trillion
in road infrastructure development.
over FY2012-16E) to companies in road infrastructure development, such as IRB,
ITNL and ABL who have a proven track record and the ability to manage large
projects.
Exhibit 2: Huge opportunities from NHAI
Total 4/6 Laned
Under implementation Balance for award
(km)
(km)
(km) Contracts (No)
(km)
GQ
5,846
5,829
17
8
-
NS and EW corridors
7,142
5,831
891
80
420
Port connectivity
380
330
50
4
-
Other NHs
1,390
945
425
6
20
SARDP-NE
388
-
112
2
276
NHDP phase
III
12,109
2,617
6,112
82
3,380
IV
14,799
-
1,744
11
13,055
V
6,500
655
2,538
20
3,307
VII
700
-
41
2
659
Total
49,254
16,207
11,930
215
21,117
Source: NHAI, Angel Research, Note: As on 30th Sept. 2011
December 16, 2011
3
Initiating Coverage | Infrastructure
Positive developments at NHAI’s end…
Steps such as annual qualification of
NHAI has taken several steps (plans to enact more) to enhance transparency in the
players and e-tendering of projects
working style of the agency. It has introduced annual pre-qualification for bidders,
along with plans to implement e-tolling
as against the earlier each-project basis, which we believe is not only logical and
bring forth increased transparency and
economical but would also lead to shortening of the time cycle (by 2-3 months) in
enhance participation in the sector.
awarding projects. Further, it has initiated e-tendering of projects and intends to
implement e-toll collection going ahead. We believe these changes are taking the
sector forward in the right direction and would lead to greater transparency and
cost savings.
…but intense competition plays the spoil sport for contractors
During the last few quarters, players in the road segment are witnessing enhanced
competition due to scarcity of order inflow across sectors (except road), as evident
from the huge difference in the bidding amount of players and the all-time high
participation of players (refer Exhibit 3).
Exhibit 3: Aggressive bidding was witnessed during the last few months
Project
Length
TPC
Winner
Premium/(Grant)
Diff No of pre-qualified
(Km)
(` cr)
L1 (` cr)
L2 (` cr)
(%)
bidders
A'bad Vadodara
102.0
2,125
IRB
310.0
191.7
61.7
22
Beawer Pali Pindwara
244.0
2,388
L&T
251.0
225.0
11.6
19
Krishangarh A'bad
556.0
5,387
GMR
636.0
516.0
23.3
11
Kota Jhalawar
88.0
530
Keti Const.
3.5
3.4
3.2
41
Barwa Adda Panagarh
123.0
1,665
DSC
106.0
67.9
56.1
20
Source: NHAI, Angel Research
…however some rationality is finally coming to fore
We believe competition in the road
However, recent bid results throw a mixed picture (refer exhibit below), as few bids
segment is here to stay; but considering
witnessed sensible bidding. As shown in the table below, the difference between L1
the tough liquidity environment, better
and L2 has narrowed down significantly in some cases. We believe this
financial discipline on the bidding front
moderation is due to the tight liquidity situation and projects facing difficulty in
from players is also expected.
achieving financial closure, as banks are getting skeptical in lending to
aggressively won projects. However, NHAI is emerging as the winner in this highly
competitive environment, with bidders offering a premium much higher than
NHAI’s expectations. We believe competition is here to stay, considering the
general slowdown in the economy and lack of opportunities in other segments.
However, considering the tough liquidity environment, better financial discipline on
the bidding front from players is also expected.
December 16, 2011
4
Initiating Coverage | Infrastructure
Exhibit 4: Bidding trend in recently awarded road projects
Project
Length
TPC
Winner
Premium/(Grant)
Diff.
No of pre-qualified
(Km)
(` cr)
L1 (` cr)
L2 (` cr)
(%)
bidders
Raipur Bilaspur
126.0
1,220
IVRCL
45.5
43.0
5.7
33
Mah/KNT-Sangareddy
145.0
1,273
L&T
80.0
75.1
6.6
37
Agra Etawah
125.0
1,207
Ramky
128.1
121.9
5.1
33
Bakhtiyarpur Khagaria
113.0
1,635
Essar/KNR
(537.0)
(568.0)
5.5
27
Cuttack Angul
112.0
1,124
Ashoka
61.1
51.2
19.3
27
Hospet Chitradurga
120.0
1,045
Ramky
63.0
45.0
40.0
37
Etawah Chakeri
160.0
1,573
Oriental
91.9
68.1
34.9
35
Rampur Kathgodam
93.0
790
Era
34.0
5.4
529.6
24
Source: NHAI, Angel Research
Prefer IRB over ABL in the road BOT space
We initiate coverage on ABL with a Buy rating and a SOTP target price of `245:
The stock has recently corrected by ~20%; and on a YTD basis, the correction has
been ~38%. The decline in the stock price can mainly be attributed to 1) the
general weakness in stock markets; 2) negatives surrounding the infrastructure
sector; and 3) ABL’s deterioration in leverage position and expectations of the
trend to continue (with the recent Cuttack Angul project win).
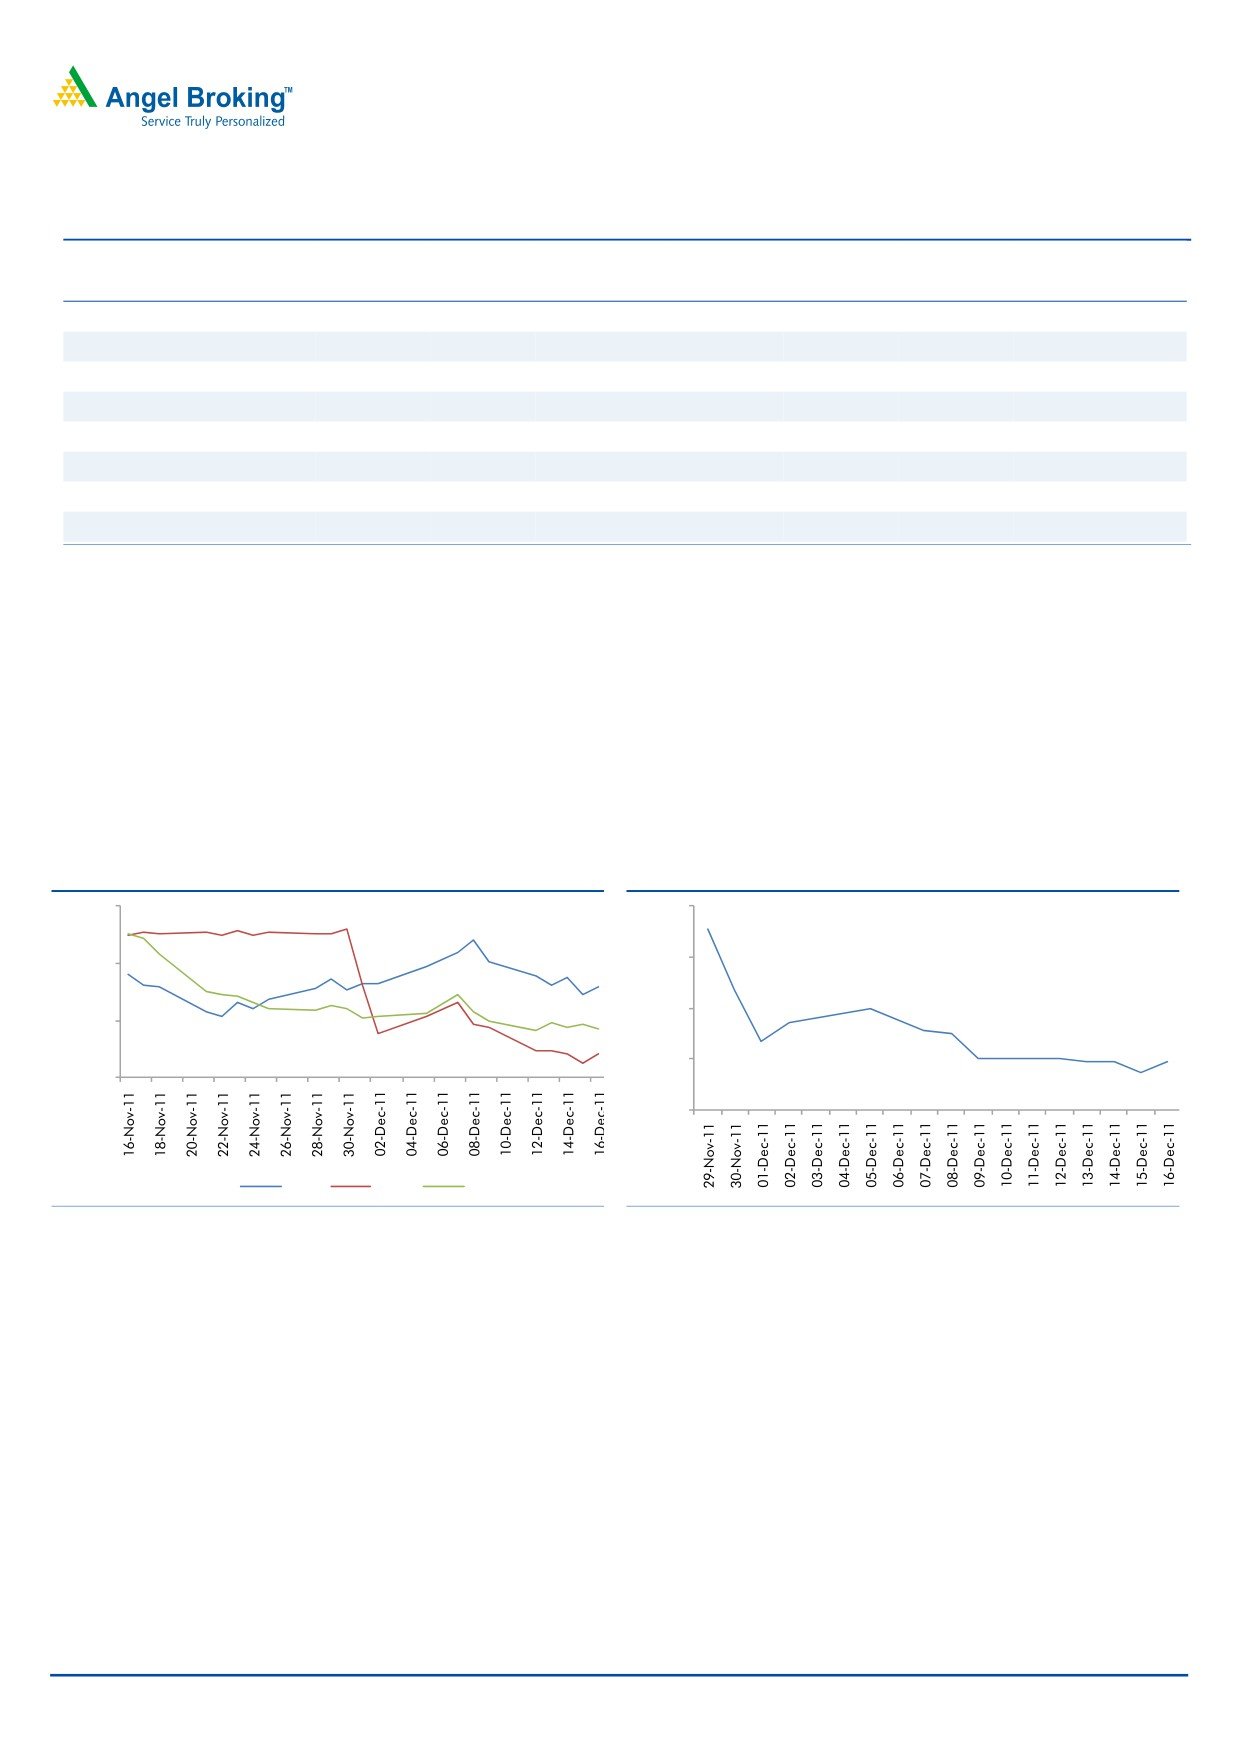
Exhibit 5: Share price movement over the last one
Exhibit 6: Decline in ABL’s share price post winning the
month - Indicates IRB’s outperformance
`1,124cr Cuttack Angul project (`)
105.0
250.0
230.0
95.0
210.0
85.0
190.0
75.0
170.0
IRB
ABL
ITNL
Source: Company, Angel Research
Source: Company, Angel Research
ABL, traditionally a state player, has transformed into a national player by winning
Our analysis indicates that ABL is in
four NHAI projects totaling to a TPC of ~`5,156cr. However, this transition has
need of
~`990cr of equity during
come at a cost, as it entails premium commitments to NHAI (~`220cr per year,
FY12012-14E, which would increase its
albeit covered by toll collections during the construction period) and huge equity
dependence on capital markets.
contributions from ABL’s side. We have analyzed the equity requirement for ABL
over FY2012-14E on the basis of its current portfolio. Our analysis indicates that
ABL is in need of ~`990cr of equity during the same period (as shown in the table
below), which would increase its dependence on capital markets for the same.
In recent times, markets have been harsh on companies with loose financial
discipline and we, therefore, remain conservative in assigning higher trading
multiples to ABL until the time its funding is tied up.
December 16, 2011
5
Initiating Coverage | Infrastructure
Equity requirement of ~`9.9bn - we expect balance sheet to stretch
Management has guided that the PE
As far as funding of equity is concerned, ABL has three sources: 1) internal
route would substantially fund the
accruals, 2) dilution of stake at the SPV level and 3) debt raising at Parent
equity requirement. However, we have
level/refinancing of existing operational projects.
not factored the same in our estimates,
Internal accruals: Internal sources include cash flow from the C&EPC segment and
given the gloomy market conditions;
toll collection. We believe ABL’s C&EPC segment would be able to generate cash
instead, we have penciled in the
flow of ~`209cr over FY2012-14E and the BOT segment would be able to garner
increase in debt levels.
~`400cr over the same period.
Dilution of stake at the SPV level: As per management, ABL is looking to dilute
stake at the SPV level to raise funds worth `700cr-750cr. However, given the
current gloomy market conditions, we believe that PE money would be hard to
come by and, hence, we are reluctant to factor in the same. Also, the recently won
projects are won with high premium commitments towards NHAI; this makes
things tougher by raising a question mark over the profitability of these projects.
Debt raising at Parent level/refinancing of existing operational projects: We are
factoring in the increase of debt at the parent level to fulfill its ~50% of investment
commitments (as shown in the table below); and, thereby, we see further
deterioration in its balance sheet - consolidated net D/E is expected to rise from
1.4x in FY2011 to 3.0x by FY2013E. ABL also has an option to refinance
operational BOT projects to meet this shortfall. This route will give cheaper access
to funds owing to stability in cash flows. In the past as well, ABL has employed this
alternative of re-leveraging to arrange for its funding requirement.
Exhibit 7: Equity requirement and funding over FY2012-14E
ABL
IRB
Projects
` cr Projects
` cr
Pimpalgaon-Nashik-Gonde
44 Pathankot-Amritsar
391
Belgaum -Dharwad
215 Jaipur-Deoli
499
Sambalpur-Baragarh
299 Talegaon Amravati
194
Dhankuni
293 Tumkur-Chitradurga
311
Cuttack Angul
140 Ahmedabad-Vadodara
753
Total
990
2,148
Funding
` cr Funding
` cr
C&EPC cash flows (FY2012E-14E)
209 C&EPC cash flows (FY2012E-14E)
812
BOT cash flows (FY2012E-14E)
400 BOT cash flows (FY2012E-14E)
500
Funding from Parent/refinancing of operational projects
445 Funding from Parent/refinancing of operational projects
250
Cash balance (FY2011 Consol.)
60 Cash balance (FY2011 Consol.)
1,200
Total
1,114 Total
2,762
Source: Company, Angel Research, Note: ITNL has an equity requirement of only ~`150cr for its projects (current portfolio)
December 16, 2011
6
Initiating Coverage | Infrastructure
Peer comparison on various parameters
Despite being a small player, we believe ABL has done a commendable job of
ramping up its portfolio (bagged four NHAI projects), which has resulted in good
revenue visibility. However, this would lead to increased leverage for the company,
as explained before.
Therefore, we prefer market leaders like IRB (CMP: `148, TP: `182) over ABL,
considering ABL’s comparatively smaller size, dependency on capital markets for
equity and major projects at nascent stage (given that average weighted age of its
portfolio is comparatively lower).
Exhibit 8: Comparison of ABL with IRB and ITNL
ABL
ITNL
IRB
ABL, traditionally a state player, has
Project comparison
transformed into a national player by
No. of projects
18
22
17
winning four NHAI projects totaling to a
Project Type
Toll
Toll + Annuity
Toll
TPC of ~`5,156cr.
Projects in more developed states
no
yes
yes
Foreign presence
no
yes
no
More diversified Portfolio (project type)
no
yes
no
Total lane km (stake adjusted)
3,709
7,026
6,579
Lane km under operation (stake adjusted)
1,204
2,979
3,270
Average weighted age of portfolio
Lane km under development (stake adjusted)
2,505
4,047
3,309
(years) indicates ABL’s portfolio is at a
TPC (stake adjusted) (` cr)
6,016
15,048
16,966
nascent stage in comparison to IRB.
Equity Commitment (` cr) For current portfolio
1,288
150
2,815
Order book
5,150
8,900
9,635
OB/Sales (x) (FY2011 EPC rev.)
5.0
5.2
5.8
Revenue collection/day (` cr) 2QFY2012
1.0
1.8
3.2
Average Weighted Age of Portfolio (years)
2.4
2.8
3.3
Financial comparison
We expect deterioration in ABL’s
Net debt/Equity (FY2013E) (x)
3.0
3.2
2.0
balance sheet - consolidated net D/E is
PE (FY2013E)
7.6
6.4
11.4
expected to rise from 1.4x in FY2011 to
P/BV (FY2013E)
0.9
1.0
1.6
3.0x by FY2013E.
EV/EBITDA (x) (FY2013E)
10.3
8.3
7.4
Source: Company, Angel Research Note: Average Weighted Age of Portfolio (years) = Age of
project x Weights, Weights= TPC of SPV/ TPC of All SPVs
December 16, 2011
7
Initiating Coverage | Infrastructure
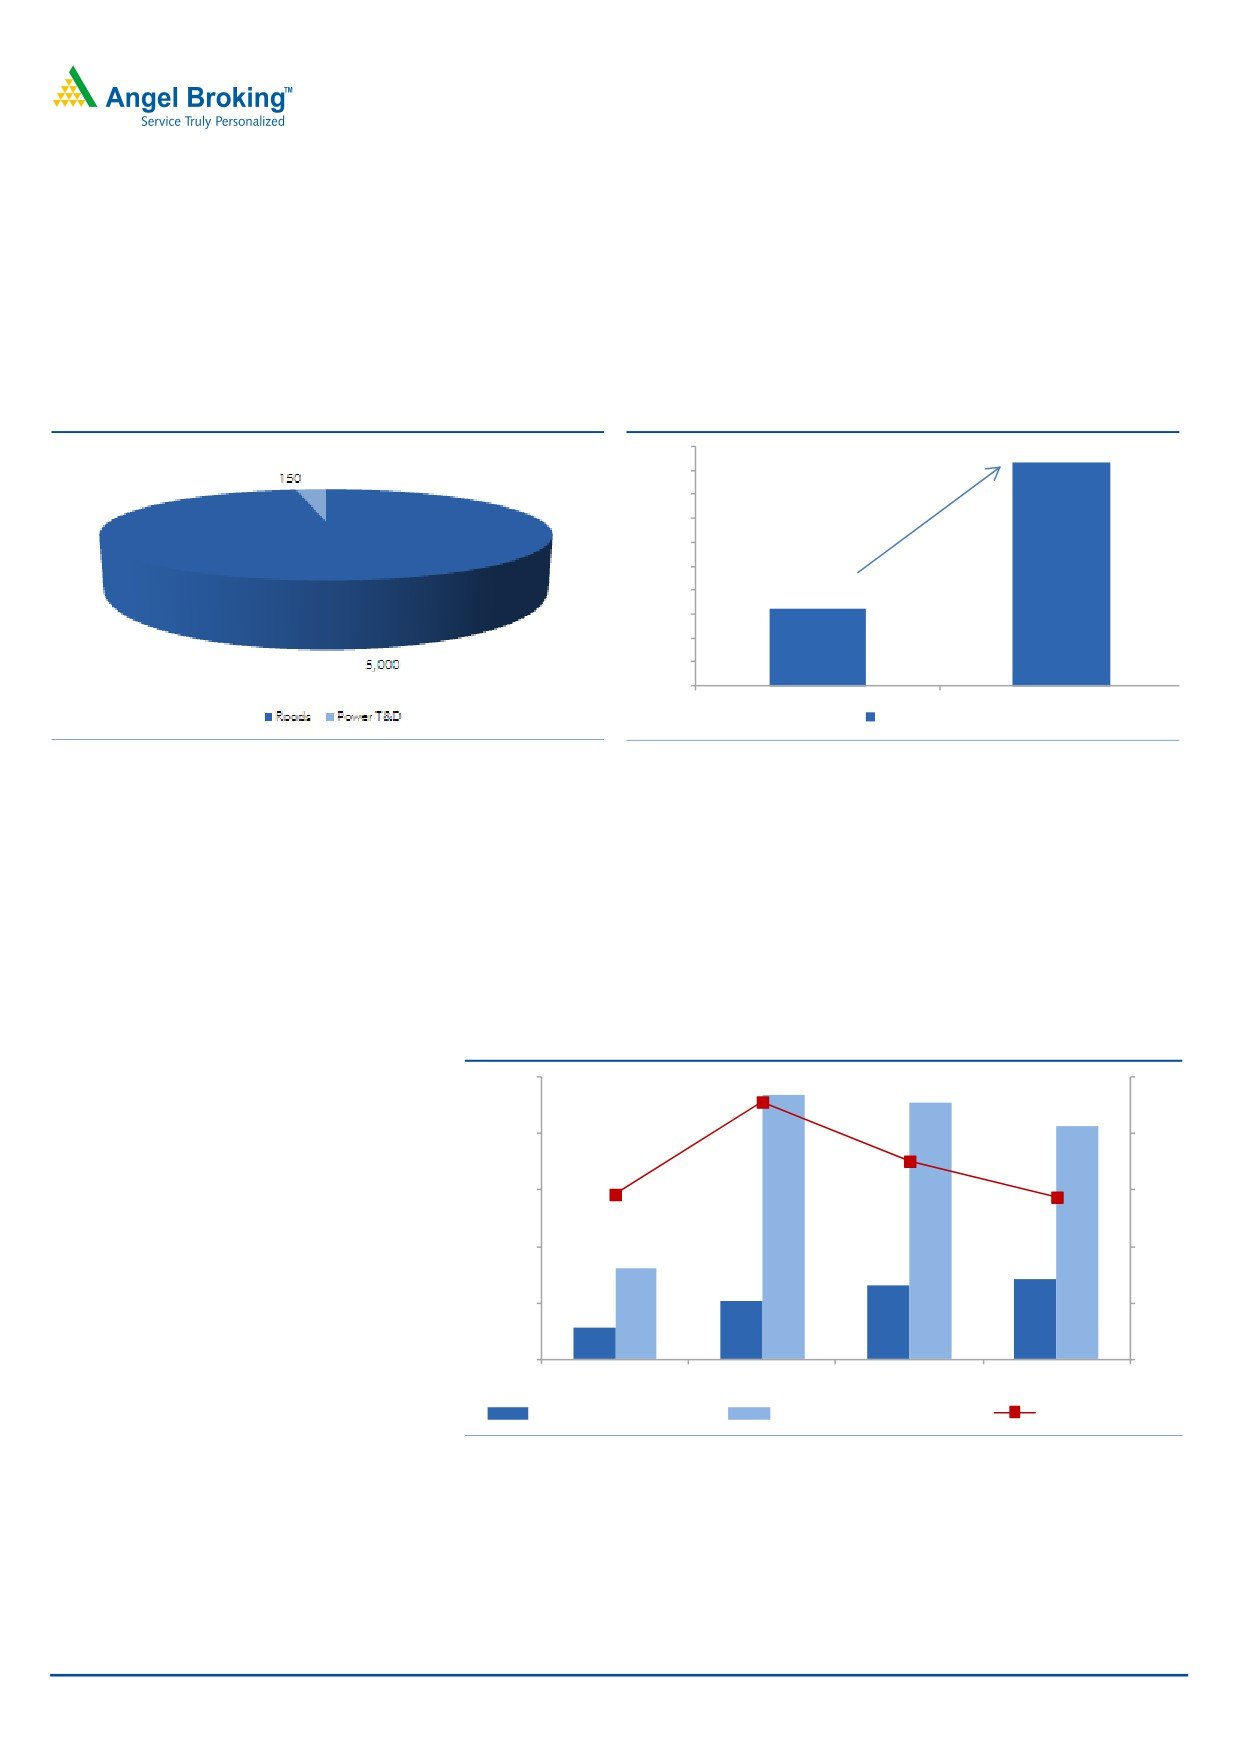
Order book position
ABL has an order book of ~`5,150cr
ABL has an order book of ~`5,150cr, including the recently won Cuttack Angul
(5.0x FY2011 EPC revenue), which
project (5.0x FY2011 EPC revenue), which provides good revenue visibility. The
provides good revenue visibility.
road segment constitutes a major share of the order book (97.1%), while the T&D
segment contributes the rest. The stunning yoy growth of 189.3% in the company’s
order book in FY2011 came on the back of three project wins from NHAI.
Exhibit 9: Current OB break-up (` cr)
Exhibit 10: Growth in OB due to recent project wins
5,000
4,672
4,500
4,000
3,500
3,000
2,500
2,000
1,615
1,500
1,000
500
-
FY2010
FY2011
Order book (` cr)
Source: Company, Angel Research
Source: Company, Angel Research
For FY2012 and FY2013, we are
Going ahead, we believe ABL will be more conservative while bidding, owing to:
factoring an order inflow of `1,120cr
1) strong order book in hand (`5,150cr 5.0x FY2011 C&EPC revenue) and 2)
(recently won Cuttack Angul project)
focus on arranging the equity required for the current portfolio. We have factored
and `1,000cr, respectively.
in no further order inflow for the remaining part of FY2012 and subdued order
inflow for FY2013, which would be mainly aided by the T&D segment. Therefore,
for FY2012 and FY2013, we are factoring an order inflow of `1,120cr (recently
won Cuttack Angul project) and `1,000cr, respectively.
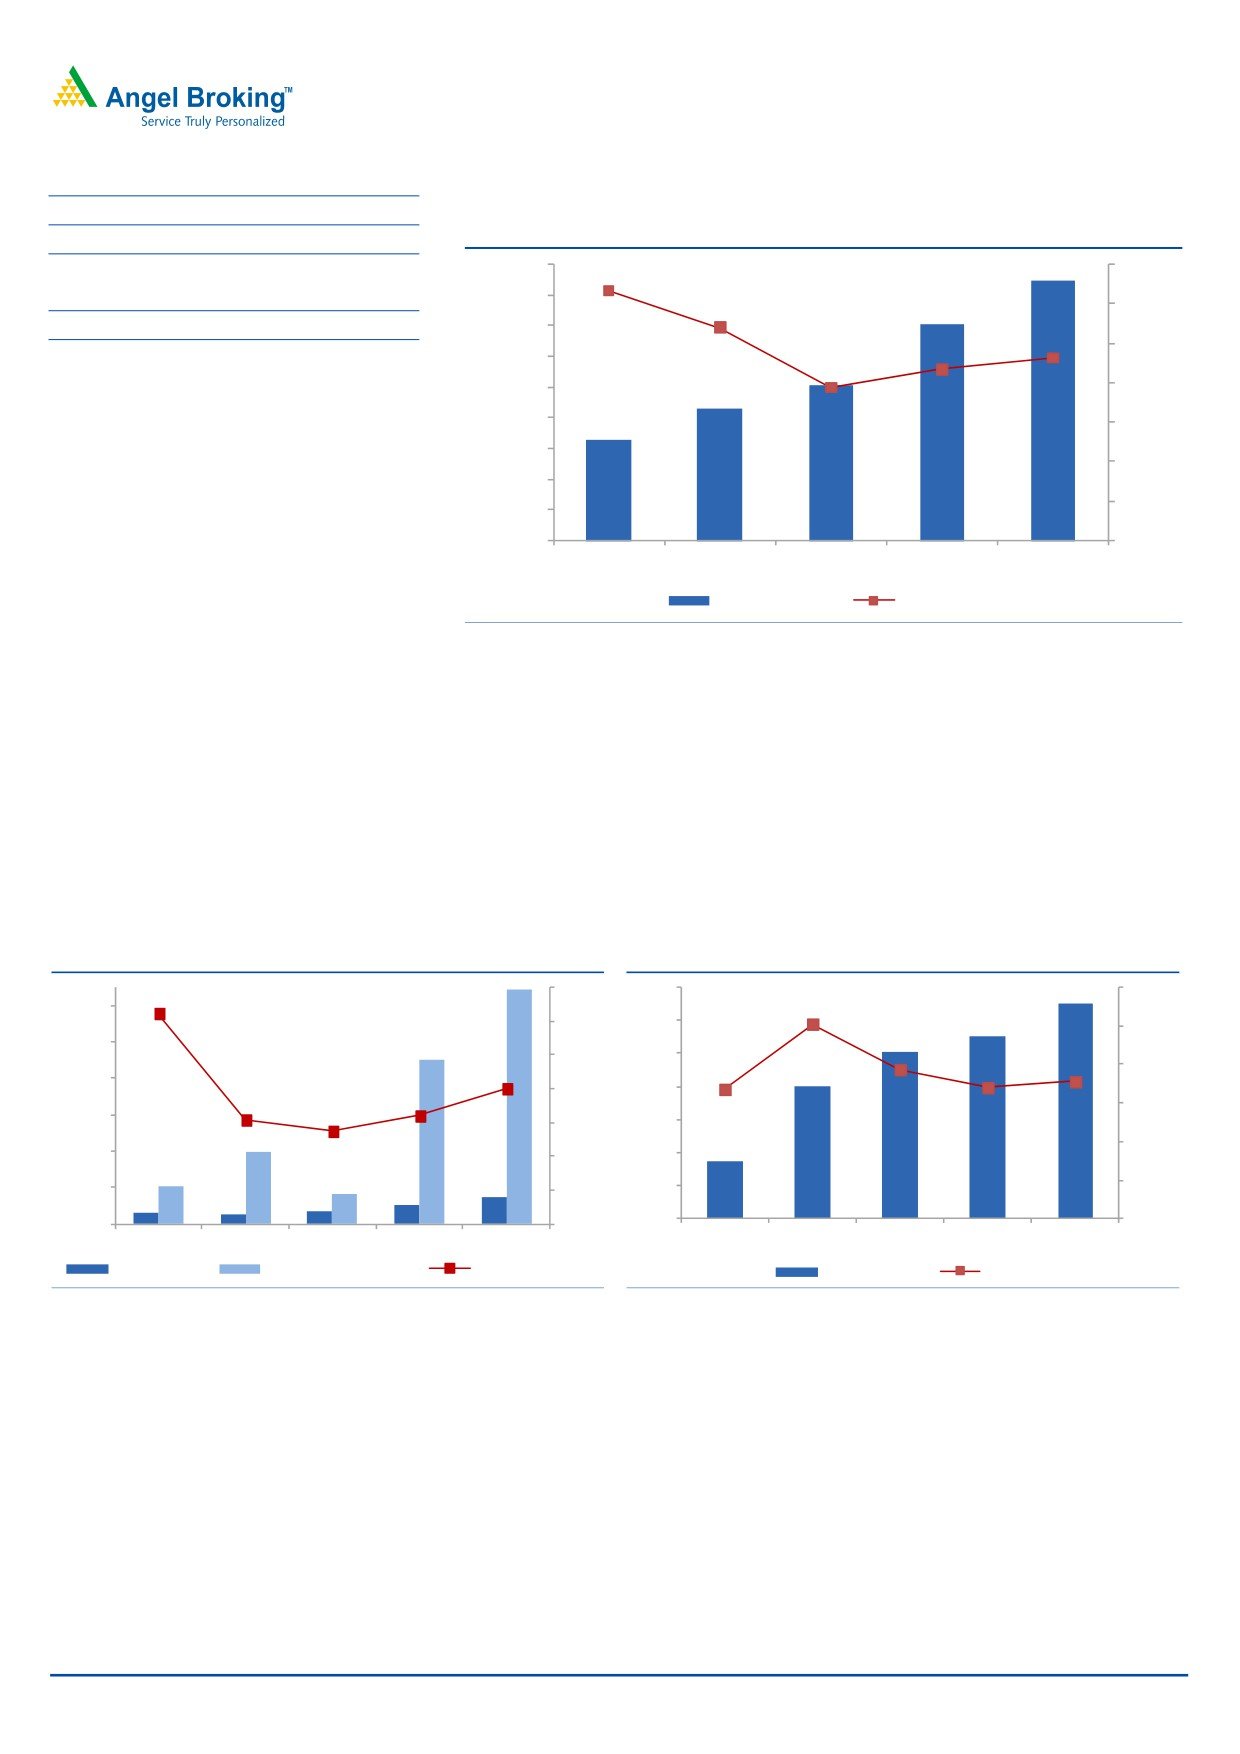
Exhibit 11: OB/Sales expected to drop due to pick-up in execution and
subdued order inflow
5,000
5.0
4.6
4,000
4.0
3.5
3,000
3.0
2.9
2.9
2,000
2.0
1,000
1.0
-
-
FY2010
FY2011
FY2012E
FY2013E
C&EPC Rev. (` cr)
Order Backlog (` cr)
OB/Sales (x)
Source: Company, Angel Research
December 16, 2011
8
Initiating Coverage | Infrastructure
Financials - Consolidated performance
Top-line growth will be driven by under construction captive BOT
projects
We expect ABL to post a CAGR of 18.6% during FY2011-13 on the top-line front
on the back of strong C&EPC order book (~`5,150cr, 5.0x FY2011 C&EPC
revenue) and addition in toll income owing to commissioning of projects.
C&EPC revenue is expected to grow yoy by 26.6% and 10.5% to `1,298cr and
`1,434cr in FY2012 and FY2013, respectively. ABL has seven projects under the
construction/development phase, which will drive its EPC revenue going ahead.
On the toll collection front, ABL is expected to post yoy growth of 25.3% and
28.3% for FY2012 and FY2013, respectively. Toll revenue will increase on the
back of completion of Jaora-Nayagaon, Pimpalgaon-Nashik-Gonde and Durg
projects. It should be noted that ABL has a different accounting policy for toll
collection of projects under construction i.e., toll collections during the construction
period net of O&M expenses would be credited to capital WIP - unlike IRB and
ITNL. Consequently, we have incorporated the same while estimating toll revenue.
Exhibit 12: Consolidated revenue to grow at an 18.6%
Exhibit 13: C&EPC segment will continue to dominate
CAGR of over FY11-13E
the overall scheme of things
2,000
63.7
70.0
100
60.6
15
15
17
1,800
90
21
53.5
60.0
28
1,600
80
1,831
1,400
50.0
70
1,627
1,200
60
40.0
1,000
50
25.0
30.0
800
85
85
83
40
79
1,302
72
600
12.5
20.0
30
400
796
20
518
10.0
200
10
-
-
-
FY2009
FY2010
FY2011
FY2012E FY2013E
FY2009
FY2010
FY2011
FY2012E
FY2013E
Revenue ( ` cr)
yoy growth (%)
C&EPC revenues (%)
BOT revenues (%)
Source: Company, Angel Research
Source: Company, Angel Research
Blended EBITDAM to marginally improve due to change in
revenue mix
For FY2011, ABL’s blended EBITDAM stood at 19.4%, owing to toll disruption in
toll collections for two projects (Pune Shirur and Nagar Karmala) and major O&M
work done by the company for few projects. Going ahead, we expect ABL to post
blended EBITDAM of 21.7% and 23.1% for FY2012 and FY2013, respectively, as
we are factoring normalized C&EPC margin at 12.5% and BOT margin at 85.0%
for both FY2012 and FY2013. Marginal improvement in FY2013 would come
from higher contribution from the high-margin BOT segment.
December 16, 2011
9
Initiating Coverage | Infrastructure
FY2012E
FY2013E
Exhibit 14: EBITDAM set to improve in FY2013 on the back of increased
EBITDA (` cr)
352.7
423.6
toll revenue contribution
C&EPC EBITDA
162.6
179.0
450
31.6
35.0
BOT EBITDA
190.1
244.6
400
26.9
30.0
EBITDAM (%)
21.7
23.1
350
21.7
23.1
25.0
C&EPC EBITDA
12.5
12.5
300
19.4
BOT EBITDA
85.0
85.0
250
20.0
424
200
15.0
353
150
252
10.0
100
214
164
5.0
50
-
-
FY2009
FY2010
FY2011
FY2012E
FY2013E
EBITDA (` cr)
EBITDA (%)
Source: Company, Angel Research
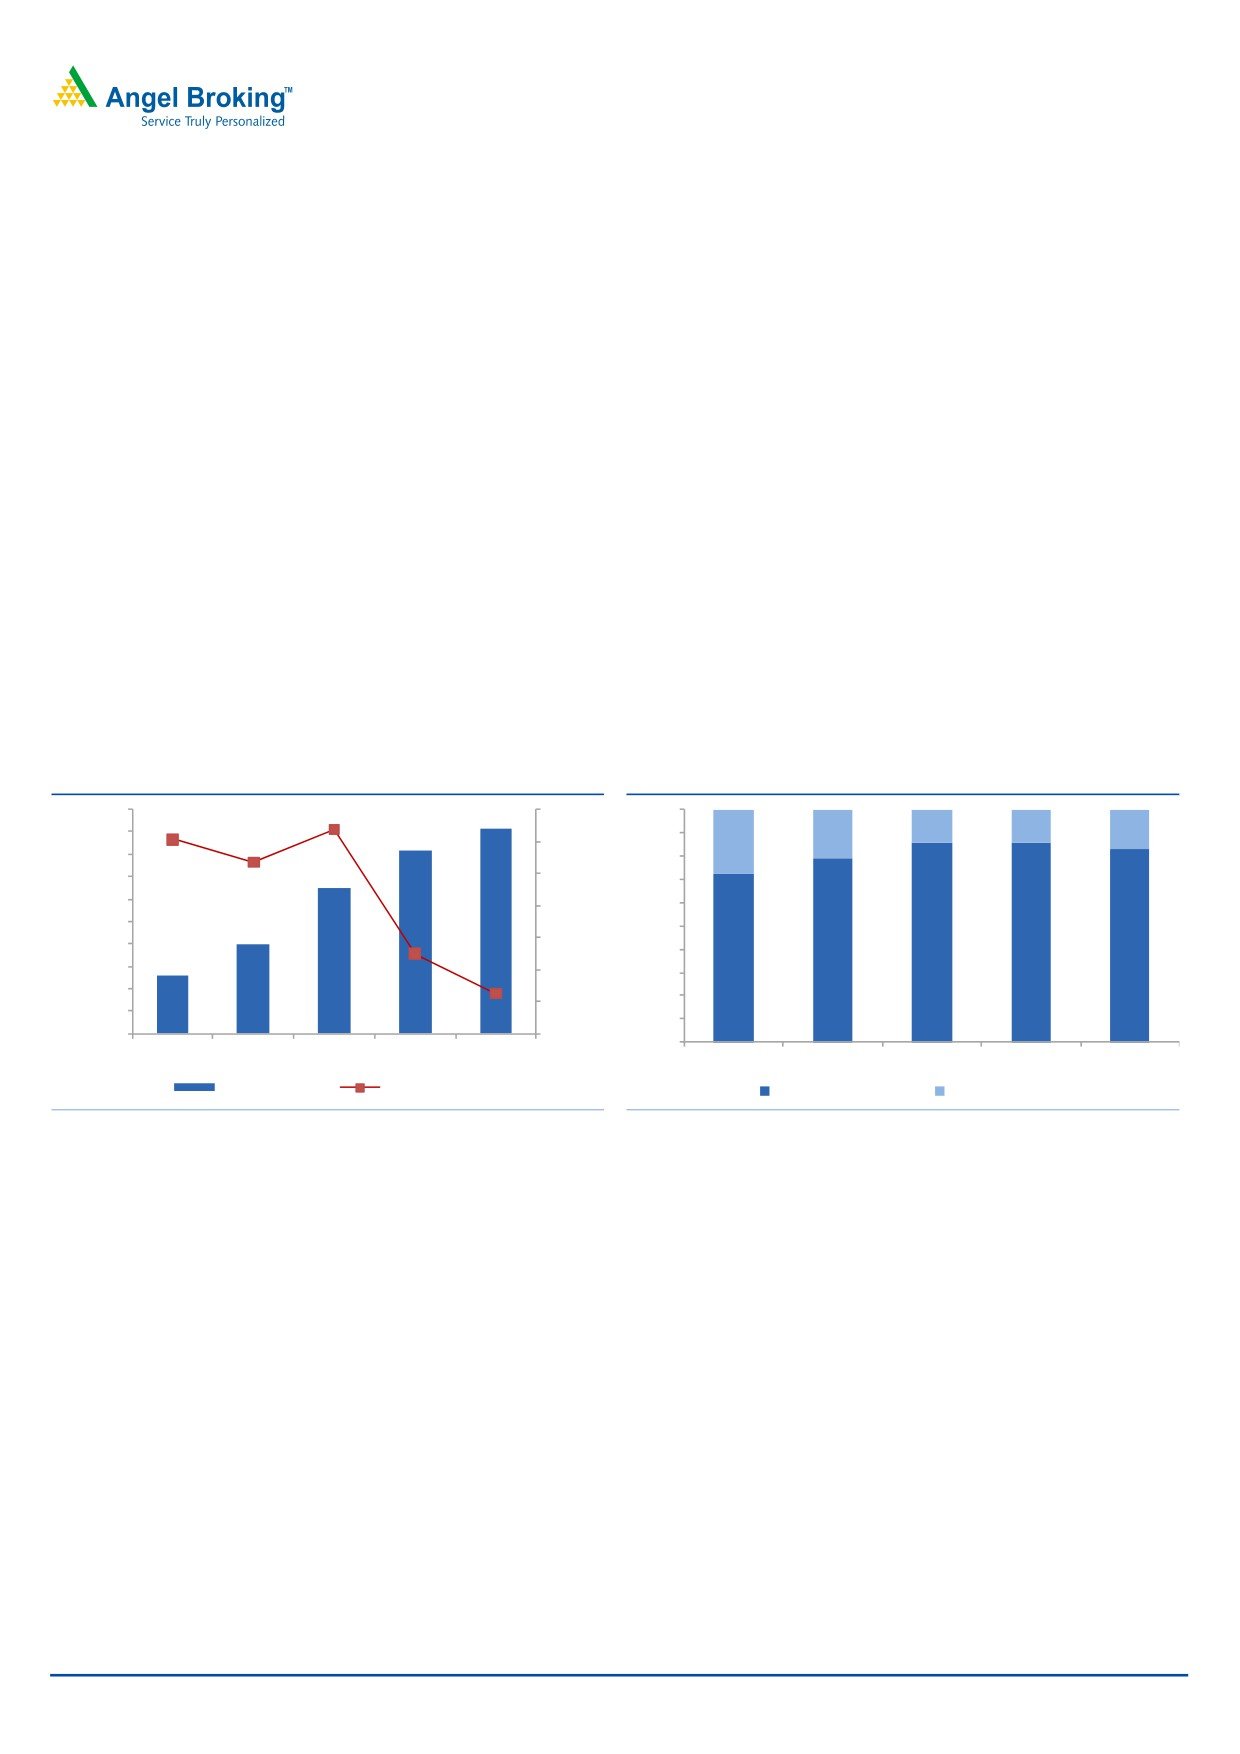
Earnings growth to be under check due to rising interest cost
ABL is expected to register a subdued CAGR of 13.6% on the earnings front for
FY2011-13, primarily on the back of higher interest cost in spite of growth in
revenue and improvement in EBITDA margin. For FY2012 and FY2013, we are
factoring interest cost of `103.8cr and `143.9cr, respectively. We expect ABL’s
debt to bloat to `3,468cr in FY2013E from `1,283cr in FY2011 (owing to debt
draw down for under construction projects).
Exhibit 15: Debt level to
increase
substantially over
Exhibit 16: Earnings to be driven by growth in revenue
FY2011-13E
and better EBITDAM
12.5
14.0
140
12.0
1,200
10.1
12.0
120
10.0
1,000
7.7
10.0
100
7.1
8.0
6.7
6.8
8.0
800
8.0
80
6.2
6.4
5.5
6.0
600
130
6.0
60
111
101
4.0
400
4.0
40
80
20
2.0
200
2.0
35
-
-
0
-
FY2009
FY2010
FY2011
FY2012E
FY2013E
FY2009
FY2010
FY2011
FY2012E
FY2013E
Interest (` cr)
yoy inc. in Debt (` cr)
Int. as % of sales
Adj. PAT (` cr)
PATM (%)
Source: Company, Angel Research
Source: Company, Angel Research
December 16, 2011
10
Initiating Coverage | Infrastructure
Outlook
History has showed that a world-class road network is a basic requirement for any
economy hopeful to maintain high economic growth rates. However, India’s road
network is barely adequate to maintain its current growth trajectory - indicating an
urgent attention towards the same and putting it on the priority list. Positively, the
political will to acknowledge and address these issues in now visible.
Records till date are mixed for road development in India - with PMGSY doing
reasonably well and NHDP lagging behind on meeting its targets. However,
matters have improved gradually with positive developments happening (as
mentioned earlier) and with experience gained on both sides - government
agencies and private sector. Some issues have been addressed on the ground and
at the policy level. But still the sector faces quite a lot of issues - for e.g., land
acquisition, environment clearance and dispute on certain aspects on the Model
Concession Agreement. Having said that, the pace of awarding has definitely
picked up considerably as compared to the past, though lower than targets.
Therefore, there are ample of opportunities for the private sector, especially for
road-focused players like IRB, ABL and ITNL.
However, we believe ABL is little differently placed than its peers on account of its
leverage position. In recent times, ABL has won large orders, which has resulted in
huge premium commitments to NHAI (~`220cr) and equity contributions from
ABL’s side, which we believe would further stretch its leverage (net D/E is expected
to rise from 1.4x in FY2011 to 3.0x by FY2013E). Also, the current cash flow
generation from BOT projects and the EPC segment would not fully suffice the
equity requirements for under development projects. Hence, we believe the only
two options for ABL would be to raise equity, which seems extremely tough in
current times, or raise debt for equity funding of its subsidiaries, which we have
factored in after considering ~50% of requirement been met from internal
accruals/refinancing of operational projects. We believe tying up of funds is the
biggest catalyst markets would watch out for in case of ABL and any delay in that
would negatively impact its stock performance on the bourses.
December 16, 2011
11
Initiating Coverage | Infrastructure
Valuation
We have valued ABL on a SOTP basis - by assigning 5.0x EV/EBITDA to its
standalone business (`104/share) (lower multiple as compared to IRB/ITNL given
the scale of operation) and valued its BOT projects on NPV basis (`141/share) (it
should be noted we have been conservative than management on revenues
estimates (toll receipts) for under construction projects keeping an eye on revenue
yield given the current competitive environment) - to arrive at a target price of
`245, which implies an upside of 29.4% from current levels. We initiate coverage
on the stock with a Buy rating and key catalyst being raising equity from capital
markets.
Exhibit 17: SOTP valuation break-up
Business Segment
Methodology
` cr
ABL's stake (%)
ABL's share
`/share
% to Target Price
Indore -Edalabad
NPV
242.7
87.0
211.2
40.1
16.4
Ahmednagar-Aurangabad
NPV
51.2
100.0
51.2
9.7
4.0
Wainganga Bridge
NPV
62.5
50.0
31.2
5.9
2.4
Dewas Bypass
NPV
28.5
100.0
28.5
5.4
2.2
Katni Bypass
NPV
28.0
99.9
28.0
5.3
2.2
Pune-Shirur
NPV
60.7
100.0
60.7
11.5
4.7
Nagar -Karmala
NPV
62.9
100.0
62.9
11.9
4.9
Bhandara
NPV
150.9
51.0
76.9
14.6
6.0
Jaora-Nayagaon
NPV
335.0
14.5
48.6
9.2
3.8
Durg
NPV
110.9
51.0
56.5
10.7
4.4
Pimpalgaon-Nashik-Gonde
NPV
68.2
26.0
17.7
3.4
1.4
Belgaum -Dharwad
NPV
(47.4)
100.0
(47.4)
(9.0)
(3.7)
Sambalpur-Baragarh
NPV
57.0
100.0
57.0
10.8
4.4
Dhankuni-Kharagpur
NPV
4.9
100.0
4.9
0.9
0.4
Cuttack Angul
P/BV
20.0
100.0
20.0
3.8
1.6
Others
NPV
33.8
100.0
33.8
6.4
2.6
EPC (Parent)
5.0x EV/EBITDA
952.8
181.0
74.0
Net debt at standalone level
(406.9)
(77.3)
(31.6)
Total
1,287.7
244.6
100.0
Source: Company, Angel Research, Note: Discount rate 14% and 16% for operational and under construction projects, respectively, *Others include
Nashirabad ROB, Sherinallah bridge and FOBs; We have valued Cuttack Angul project on P/BV basis due to pending detail
December 16, 2011
12
Initiating Coverage | Infrastructure
Exhibit 18: ABL - BOT projects details/assumptions
(` cr)
Project
Client Lane Kms
ABL's Stake
TPC SPV Equity
Debt
Grant/(Prem.)
Con. sign Int. Rate Toll Inc Traffic Inc
Operational Projects
(%)
(%)
(%)
(%)
Indore -Edalabad
MPRDC
407
87
165.0
64.7
55.6
45.0
22-Sep-01
11.9
7.0
5.0
Ahmednagar-Aurangabad
PWD
168
100
103.0
36.0
67.0
-
18-Dec-06
10.0
15.0*
5.0
Wainganga Bridge
MORTH
26
50
41.0
14.5
26.5
-
16-Nov-98
9.5
6.0
5.0
Dewas Bypass
PWD
40
100
61.0
25.0
36.0
-
31-Aug-01
13.8
25.0*
5.0
Katni Bypass
PWD
35
100
71.0
28.0
43.0
-
19-Aug-02
14.0
5.0
5.0
Pune-Shirur
PWD
216
100
161.0
55.0
106.0
-
7-May-03
11.0
18.0*
5.0
Nagar -Karmala
PWD
160
100
50.0
31.5
18.5
-
19-Feb-99
11.3
18.0*
5.0
Bhandara
NHAI
377
51
535.0
150.0
375.0
10.0
18-Sep-07
11.0
6.0
5.0
Dhule Bypass
PWD
12
100
6.0
0.6
5.4
-
28-Aug-97 No debt
-
5.0
Nashirabad
MORTH
8
100
15.0
14.5
0.5
-
16-Nov-98 No debt
21.0#
5.0
Sherinala
PWD
7
100
14.0
7.0
7.1
-
23-Mar-99 No debt
16.0
5.0
Anawali Kasegaon
PWD
22
5
7.4
3.3
4.1
-
1-Mar-04 No debt
n.a.
5.0
Under cons./develop.
Jaora-Nayagaon
MPRDC
340
15
835
273.0
562.0
(15.3)^
20-Aug-07
11.0
5.0
5.0
Durg
NHAI
368
51
587
201.0
386.0
(1.0)
23-Jan-08
13.3
5.0
5.0
PNG
NHAI
452
26
1,691
339.0
1,352.0
6.2%@
8-Jul-09
10.3
5.0
5.0
Belgaum -Dharwad
NHAI
454
100
694
215.0
479.0
(31.0)^
29-Jun-10
12.3
5.0
5.0
Sambalpur-Baragarh
NHAI
408
100
1,142
332.0
810.0
(1.3)^
29-Jun-10
11.8
5.0
5.0
Dhankuni-Kharagpur
NHAI
840
100
2,200
450.0
1,750.0
(126.1)^
21-Jun-11
11.0
5.0
5.0
Total
3,611
8,378
2,240
6,084
Source: Company, Angel Research, Note:* Every three years, # Every five years, ^ 5% increment per annum, @ 6.19% of revenue payable as premium and
increment of 1% per annum
December 16, 2011
13
Initiating Coverage | Infrastructure
Concerns
Interest rate risks
ABL’s business model is vulnerable to
The inherent nature of the BOT project requires high leverage. Going by the thumb
interest rate fluctuations, and any hike
rule, most road BOT projects have a debt-equity blend of 70:30. In recent times,
in interest rates could increase its
ABL has won large orders, which is expected to result in stretch in its leverage
interest costs.
position (net D/E is expected to rise from 1.4x in FY2011 to 3.0x by FY2013E).
Hence, the company’s business model is vulnerable to interest rate fluctuations,
and any hike in interest rates could increase its interest costs. However, we believe
that interest rates are at peak and don’t expect any further increase from here on.
Traffic growth risks
The thumb rule for traffic growth is a
Revenue from BOT toll-based projects is directly affected by traffic growth.
factor of 0.8-0.9x of real GDP growth.
Companies bid for projects assuming long-term traffic growth patterns, which may
Therefore, we have conservatively
be higher/aggressive than actual growth. This aberration in traffic growth
factored in 5% traffic growth in ABL’s
estimates could result in lower returns for companies. Moreover, any economic
BOT projects.
slowdown or competing road development could impact our estimates. The thumb
rule for traffic growth is a factor of 0.8-0.9x of real GDP growth. Therefore, we
have conservatively factored in 5% traffic growth in ABL’s BOT projects.
Commodity risks
Prices of commodities like cement, steel and bitumen play an important role in
If the movement in the prices of
shaping EBITDAM. We have factored in flat EBITDAM for ABL for the C&EPC and
commodities (bitumen, steel and
BOT segment owing to inclusion of escalation clause while estimating costs and
cement) is higher than the estimates, it
due to the integrated business model of ABL. However, if the movement in prices
would have a negative impact on the
of these commodities is higher than the estimates, it would have a negative impact
EBITDAM.
on the company’s EBITDAM.
December 16, 2011
14
Initiating Coverage | Infrastructure
Company background
ABL’s business is organized into four divisions: 1) BOT division, 2) Engineering,
procurement and construction (EPC) division, 3) RMC and bitumen division and 4)
Toll collection contract division.
ABL is an integrated road player involved in building and operating roads and
bridges in India on a BOT basis. The company’s head office is in Nashik,
Maharashtra, and its operations currently reach across the states of Maharashtra,
Madhya Pradesh, Chhattisgarh and Rajasthan. In addition to BOT projects, the
company engineers and designs; procures raw material and equipment; and
constructs roads, bridges, distribution transformers, electricity substations,
commercial buildings, industrial buildings and institutional buildings along with
providing maintenance services. ABL is also involved in the manufacturing and
selling of ready-mix concrete (RMC) and bitumen and collecting tolls on roads and
bridges owned by it and constructed by third parties.
Prior to 1997, ABL was engaged solely in the engineering and construction of
residential, commercial, industrial and institutional buildings. In
1997, after
acquiring EPC skills, ABL turned its attention towards bidding for contracts for
roads and bridges on a BOT basis. The company was awarded its first BOT
project, the Dhule bypass in Maharashtra, in
1997 and it completed the
construction of the road in the same year. In 2000, ABL began manufacturing
RMC solely for use by its EPC division, while in 2002 the company began to
manufacture RMC to sell to third parties. In 2005, ABL began processing bitumen
to a higher grade at its Pune facility for use in road projects. Having developed
systems and procedures for collecting tolls on its BOT projects, including
developing its own proprietary computerized toll revenue auditing system, ABL
bided for and was awarded the first contract to collect tolls on a road owned and
constructed by a third party. In FY2009, the company began undertaking EPC
work in the power sector and was awarded a contract by Maharashtra State
Electricity Distribution Company Limited for the construction and commissioning of
sub-transmission lines, distribution lines, power transformers and new sub-stations.
In September 2008, ABL entered into agreements for constructing and developing
two shopping malls on a BOT basis.
Seasoned player in the road BOT segment
ABL has a rich experience of 15 years
Rich experience: ABL has a rich experience of 15 years in the road segment with
in the road segment with 59 road and
59 road and bridge projects under its name. ABL was an early mover in the BOT
bridge projects under its name.
project sector, as it bagged its first BOT project, the Dhule bypass (TPC - `5.8cr) in
Maharashtra, in 1997 and completed the construction in the same fiscal year. In
terms of lane km, ABL has executed 3,095 lane km (1,155 lane km - third party
and 1,941 lane km - captive), making it one of the most seasoned players in the
road segment.
December 16, 2011
15
Initiating Coverage | Infrastructure
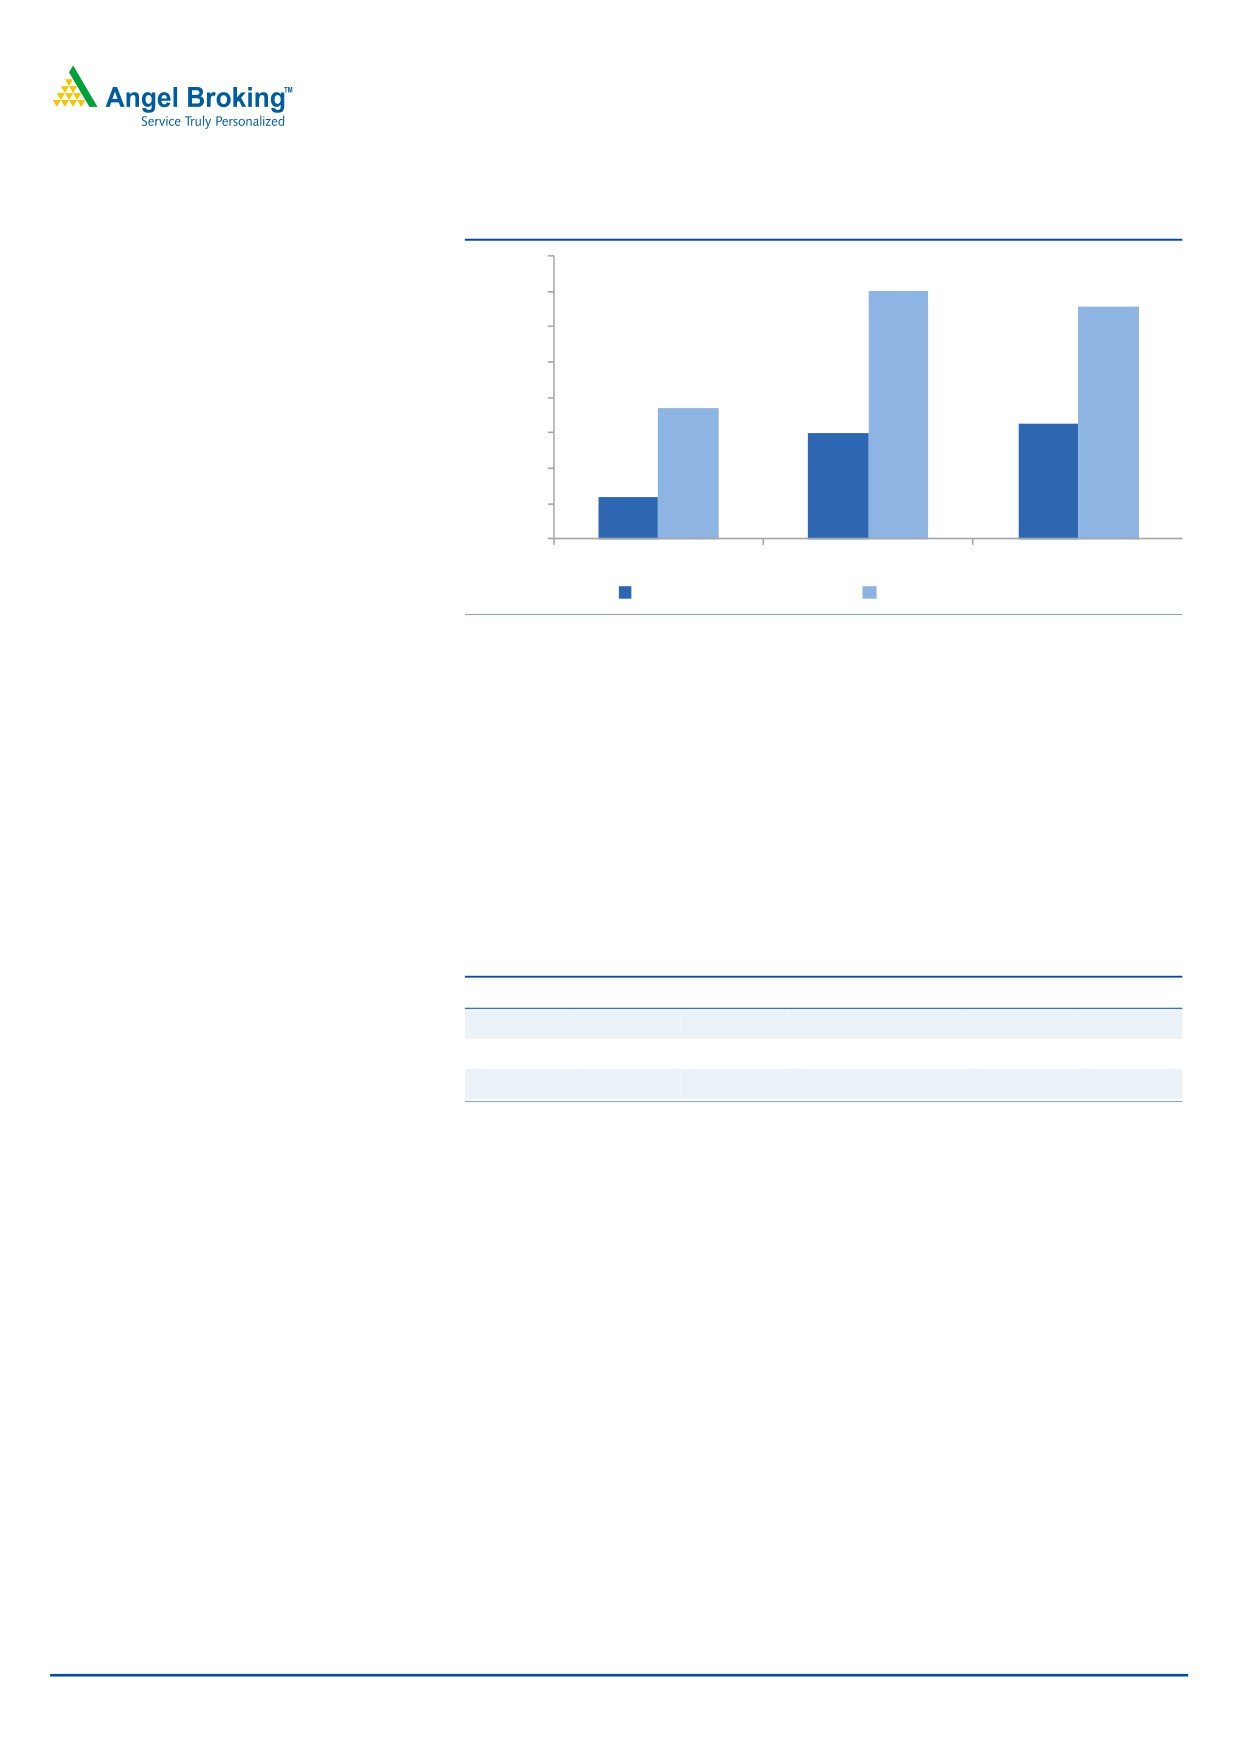
Exhibit 19: Portfolio across road focused players
8,000
7,026
7,000
6,579
6,000
5,000
3,709
4,000
3,270
2,979
3,000
2,000
1,204
1,000
-
ABL
ITNL
IRB
Operational Lane km
Portfolio Lane km
Source: Company, Angel Research, Note: Adjusted for stake
We believe ABL’s enviable reputation in
Changeover from a state to a national level player: ABL primarily started as a state
the road segment will augur well for the
level construction player and slowly moved to become a national player (recently
company to further develop its BOT
bagged four big NH projects worth `5,150cr). ABL’s early-mover status and
portfolio and to win EPC contracts for
continued presence in the road BOT sector provides it with a platform to further
road and bridge construction projects.
develop a BOT portfolio and to win EPC contracts for road and bridge construction
projects. Further, the company has worked with well-established players such as
L&T, IDFC and SREI Infrastructure Finance, which can lead to future opportunities
for ABL in the form of EPC contract for road projects from these players.
Exhibit 20: Project capitalization (` cr)
Oper.
% to Total
Under Develop
% to Total
Total
ABL
917
15.2
5,099
84.8
6,016
IRB
3,339
19.7
13,627
80.3
16,966
ITNL
3,563
23.7
11,485
76.3
15,048
Source: Company, Angel Research, Note: Adjusted for stake
NH-6 ABL’s forte: ABL has been concentrating on NH-6 as far as road BOT
projects are concerned, which is evident from the fact that it is the largest BOT
player on NH-6 with ~1,745 lane km of projects and 57% PPP market share on
the same. The company has won BOT projects on NH-6 and is present in four out
of six states linked to NH-6. We believe ABL’s experience and dominance on this
stretch equips it with credible traffic data, which aides while bidding for new
projects. Further, it makes it easier to mobilise resources from one project to the
other, thus leading to cost savings.
December 16, 2011
16
Initiating Coverage | Infrastructure
Under construction BOT projects - Update
Exhibit 21: ABL’s under construction projects
ABL's stake
TPC
EPC Toll Revenue* Revenue yield#
Status
Toll collection
(%)
(` cr)
(` cr)
(` cr)
(%)
expected to start
Jaora-Nayagaon
15
835
460
84.3
10.1
99% completed
4QFY12
Durg
51
587
539
58.0
9.9
99% completed
4QFY12
Pimpalgaon-Nashik-Gonde
26
1,691
650
171.0
10.1
47% completed
Jul-12
Belgaum -Dharwad
100
694
630
64.2
9.3
16% completed Already operational
Sambalpur-Baragarh
100
1,142
1,008
96.0
8.4
10% completed
Jul-13
Dhankuni-Kharagpur
100
2,200
2,016
217.2
9.9 FC expected in 4QFY12
4QFY12
Cuttack Angul
100
1,120
1,000
n.a
n.a
CA yet to be signed
n.a.
Total
8,269
6,303
Source: Company, Angel Research, Note: *Toll revenues are for first full year of operation, # Revenue yield=Toll Revenue/TPC
December 16, 2011
17
Initiating Coverage | Infrastructure
Profit and Loss (Consolidated)
Y/E March (` cr)
FY2008
FY2009
FY2010
FY2011
FY2012E
FY2013E
Net sales
323
518
796
1,302
1,627
1,831
% growth
(19.9)
60.6
53.5
63.7
25.0
12.5
Other operating income
-
-
-
-
-
-
Total operating income
323
518
796
1,302
1,627
1,831
% chg
(19.9)
60.6
53.5
63.7
25.0
12.5
Total expenditure
199
354
581
1,050
1,274
1,407
Construction/Contract expenses
120
265
484
928
1,128
1,242
Cost of material sold
52.5
58.2
58.5
61.3
71.3
80.2
Administrative and other exp.
14.2
15.6
17.8
26.8
33.5
37.7
Personnel
12.9
15.9
21.3
33.3
41.6
46.8
Other
-
-
-
-
-
-
EBITDA
123.3
164.0
214.3
252.2
352.9
423.7
% chg
16.9
33.0
30.6
17.7
39.9
20.1
(% of Net sales)
38.2
31.6
26.9
19.4
21.7
23.1
Depreciation & amortization
53.2
64.5
66.1
69.0
115.1
121.6
EBIT
70.1
99.5
148.1
183.2
237.8
302.1
% chg
26.4
41.9
48.8
23.7
29.8
27.0
(% of Net Sales)
21.7
19.2
18.6
14.1
14.6
16.5
Interest & other charges
47.4
64.6
49.0
71.5
103.8
143.9
Other income
17.6
15.0
18.6
33.9
23.7
27.3
Share in profit of associates
-
-
-
-
-
-
Recurring PBT
40.3
49.9
117.7
145.6
157.7
185.4
% chg
53.9
23.8
135.9
23.7
8.3
17.6
Extraordinary expense/(inc.)
-
-
-
(89.2)
-
-
PBT (reported)
40.3
49.9
117.7
234.8
157.7
185.4
Tax
3.8
11.6
31.9
24.5
45.7
53.8
(% of PBT)
9.4
23.3
27.1
10.4
29.0
29.0
PAT (reported)
36.5
38.3
85.9
210.3
112.0
131.7
Add: Share of earnings of asso.
-
-
-
-
-
-
Less: Minority interest (MI)
3.4
3.5
5.5
2.4
1.3
1.5
Prior period items
-
-
-
-
-
-
PAT after MI (reported)
33.1
34.8
80.4
208.0
110.7
130.2
Adj. PAT
33.1
34.8
80.4
100.8
110.7
130.2
% chg
36.5
5.2
130.8
25.5
9.8
17.6
(% of Net Sales)
10.3
6.7
10.1
7.7
6.8
7.1
Basic EPS (`)
7.4
7.6
17.6
19.2
21.0
24.7
Fully diluted EPS (`)
6.3
6.6
15.3
19.2
21.0
24.7
% chg
36.5
5.2
130.8
25.5
9.8
17.6
December 16, 2011
18
Initiating Coverage | Infrastructure
Balance Sheet (Consolidated)
Y/E March (` cr)
FY2008
FY2009
FY2010
FY2011
FY2012E
FY2013E
SOURCES OF FUNDS
Equity Share Capital
46
46
46
53
53
53
Preference Capital
13
13
12
10
10
10
Reserves& Surplus
253
289
404
830
941
1,071
Shareholder’s Funds
311
347
462
893
1,003
1,134
Total Loans
512
723
1,122
1,283
2,181
3,468
Deferred Tax Liability
1
2
3
2
2
2
Minority Interest
16
24
81
111
111
111
Total Liabilities
841
1,095
1,669
2,289
3,297
4,714
APPLICATION OF FUNDS
Gross Block
623
749
791
1,389
1,809
2,249
Less: Acc. Depreciation
191
259
330
368
483
605
Net Block
432
491
461
1,020
1,326
1,644
Capital Work-in-Progress
129
373
814
673
1,149
2,047
Goodwill
-
-
-
-
-
-
Investments
72
91
149
139
160
168
Balance of unutilised monies
-
-
-
11
-
-
Current Assets
291
306
685
815
1,172
1,485
Inventories
91
67
196
241
362
489
Sundry Debtors
33
35
182
285
392
486
Cash
99
69
85
60
75
87
Loans & Advances
67
135
222
229
343
424
Other
-
-
-
-
-
-
Current liabilities
83
165
440
371
509
631
Net Current Assets
208
141
245
445
663
855
Misc. Exp. not written off
-
-
-
-
-
-
Total Assets
841
1,095
1,669
2,289
3,297
4,714
December 16, 2011
19
Initiating Coverage | Infrastructure
Cash Flow (Consolidated)
Y/E March (` cr)
FY2008 FY2009 FY2010 FY2011 FY2012E FY2013E
Profit before tax
40
50
118
235
156
184
Depreciation
53
64
66
69
115
122
Change in Working Capital
37
(49)
38
224
192
180
Less: Other income
5
4
5
34
24
27
Direct taxes paid
6
11
31
24
46
54
Cash Flow from Operations
46
148
111
21
10
44
(Inc.)/ Dec. in Fixed Assets
(152)
(367)
(478)
(457)
(896)
(1,339)
(Inc.)/ Dec. in Investments
(5)
(19)
(58)
9
(20.9)
(8)
Other income
5
4
47
34
24
27
Cash Flow from Investing
(153)
(382)
(489)
(414)
(893)
(1,319)
Issue of Equity
(8)
-
-
220
-
-
Inc./(Dec.) in loans
75
211
399
161
898
1,287
Dividend Paid (Incl. Tax)
-
-
-
-
-
-
Others
1
(7)
(6)
(13)
-
-
Cash Flow from Financing
67
203
393
368
898
1,287
Inc./(Dec.) in Cash
(40)
(30)
15
(24)
15
12
Opening Cash balances
139
99
69
85
60
75
Closing Cash balances
99
69
85
60
75
87
December 16, 2011
20
Initiating Coverage | Infrastructure
Key Ratios
Y/E March
FY2008
FY2009
FY2010
FY2011
FY2012E FY2013E
Valuation Ratio (x)
P/E (on FDEPS)
30.1
28.6
12.4
9.9
9.0
7.6
P/CEPS
11.5
10.0
6.8
5.9
4.4
4.0
P/BV
3.2
2.9
2.2
1.1
1.0
0.9
EV/Sales
4.4
3.2
2.6
1.7
1.9
2.4
EV/EBITDA
11.4
10.0
9.5
8.8
8.8
10.3
EV / Total Assets
1.7
1.5
1.2
1.0
0.9
0.9
Per Share Data (`)
EPS (Basic)
7.4
7.6
17.6
19.2
21.0
24.7
EPS (fully diluted)
6.3
6.6
15.3
19.2
21.0
24.7
Cash EPS
16.4
18.9
27.8
32.3
42.9
47.8
DPS
-
-
-
-
-
-
Book Value
59.1
66.0
87.8
169.7
190.6
215.4
DuPont Analysis
EBIT margin
21.7
19.2
18.6
14.1
14.6
16.5
Tax retention ratio
0.9
0.8
0.7
0.9
0.7
0.7
Asset turnover (x)
0.5
0.6
0.6
0.7
0.6
0.5
ROIC (Post-tax)
9.5
8.6
8.3
8.6
6.2
5.5
Cost of Debt (Post Tax)
9.0
8.0
3.9
5.3
4.3
3.6
Leverage (x)
1.2
1.6
2.1
1.7
1.8
2.6
Operating ROE
10.0
9.6
17.5
14.1
9.6
10.2
Returns (%)
ROACE (Pre-tax)
8.9
10.3
10.7
9.3
8.5
7.5
Angel ROIC (Pre-tax)
10.4
11.3
11.3
9.6
8.7
7.7
ROAE
11.1
11.6
21.2
14.9
11.7
12.2
Turnover ratios (x)
Asset Turnover (Gross Block)
0.6
0.8
1.0
1.2
1.0
0.9
Inventory / Sales (days)
84
55
60
61
68
85
Receivables (days)
32
24
50
66
76
88
Payables (days)
134
128
190
141
126
148
Work. cap. cycle (ex-cash) (days)
100
63
53
76
109
135
Solvency ratios (x)
Net debt to equity
1.3
1.9
2.2
1.4
2.1
3.0
Net debt to EBITDA
3.3
4.0
4.8
4.8
6.0
8.0
Interest Coverage
1.5
1.5
3.0
2.6
2.3
2.1
December 16, 2011
21
Initiating Coverage | Infrastructure
Research Team Tel: 022 - 39357800
DISCLAIMER
This document is solely for the personal information of the recipient, and must not be singularly used as the basis of any investment
decision. Nothing in this document should be construed as investment or financial advice. Each recipient of this document should make
such investigations as they deem necessary to arrive at an independent evaluation of an investment in the securities of the companies
referred to in this document (including the merits and risks involved), and should consult their own advisors to determine the merits and
risks of such an investment.
Angel Broking Limited, its affiliates, directors, its proprietary trading and investment businesses may, from time to time, make
investment decisions that are inconsistent with or contradictory to the recommendations expressed herein. The views contained in this
document are those of the analyst, and the company may or may not subscribe to all the views expressed within.
Reports based on technical and derivative analysis center on studying charts of a stock's price movement, outstanding positions and
trading volume, as opposed to focusing on a company's fundamentals and, as such, may not match with a report on a company's
fundamentals.
The information in this document has been printed on the basis of publicly available information, internal data and other reliable
sources believed to be true, but we do not represent that it is accurate or complete and it should not be relied on as such, as this
document is for general guidance only. Angel Broking Limited or any of its affiliates/ group companies shall not be in any way
responsible for any loss or damage that may arise to any person from any inadvertent error in the information contained in this report.
Angel Broking Limited has not independently verified all the information contained within this document. Accordingly, we cannot testify,
nor make any representation or warranty, express or implied, to the accuracy, contents or data contained within this document. While
Angel Broking Limited endeavours to update on a reasonable basis the information discussed in this material, there may be regulatory,
compliance, or other reasons that prevent us from doing so.
This document is being supplied to you solely for your information, and its contents, information or data may not be reproduced,
redistributed or passed on, directly or indirectly.
Angel Broking Limited and its affiliates may seek to provide or have engaged in providing corporate finance, investment banking or
other advisory services in a merger or specific transaction to the companies referred to in this report, as on the date of this report or in
the past.
Neither Angel Broking Limited, nor its directors, employees or affiliates shall be liable for any loss or damage that may arise from or in
connection with the use of this information.
Note: Please refer to the important `Stock Holding Disclosure' report on the Angel website (Research Section). Also, please
refer to the latest update on respective stocks for the disclosure status in respect of those stocks. Angel Broking Limited and
its affiliates may have investment positions in the stocks recommended in this report.
Disclosure of Interest Statement
ABL
1. Analyst ownership of the stock
No
2. Angel and its Group companies ownership of the stock
No
3. Angel and its Group companies' Directors ownership of the stock
No
4. Broking relationship with company covered
No
Note: We have not considered any Exposure below ` 1 lakh for Angel, its Group companies and Directors.
Ratings (Returns):
Buy (> 15%)
Accumulate (5% to 15%)
Neutral (-5 to 5%)
Reduce (-5% to 15%)
Sell (< -15%)
December 16, 2011
22
Initiating Coverage | Infrastructure
6th Floor, Ackruti Star, Central Road, MIDC, Andheri (E), Mumbai - 400 093. Tel: (022) 39357800
Research Team
Fundamental:
Sarabjit Kour Nangra
VP-Research, Pharmaceutical
Vaibhav Agrawal
VP-Research, Banking
Shailesh Kanani
Infrastructure
Srishti Anand
IT, Telecom
Bhavesh Chauhan
Metals, Mining
Sharan Lillaney
Mid-cap
V Srinivasan
Research Associate (Cement, Power)
Yaresh Kothari
Research Associate (Automobile)
Shrinivas Bhutda
Research Associate (Banking)
Sreekanth P.V.S
Research Associate (FMCG, Media)
Hemang Thaker
Research Associate (Capital Goods)
Nitin Arora
Research Associate (Infra, Real Estate)
Ankita Somani
Research Associate (IT, Telecom)
Varun Varma
Research Associate (Banking)
Sourabh Taparia
Research Associate (Cement, Power)
Technicals:
Shardul Kulkarni
Sr. Technical Analyst
Sameet Chavan
Technical Analyst
Sacchitanand Uttekar
Technical Analyst
Derivatives:
Siddarth Bhamre
Head - Derivatives
Institutional Sales Team:
Mayuresh Joshi
VP - Institutional Sales
Hiten Sampat
Sr. A.V.P- Institution sales
Meenakshi Chavan
Dealer
Gaurang Tisani
Dealer
Akshay Shah
Dealer
Production Team:
Simran Kaur
Research Editor
Dilip Patel
Production
CSO & Registered Office: G-1, Ackruti Trade Centre, Rd. No. 7, MIDC, Andheri (E), Mumbai - 400 093.Tel.: (022) 3083 7700. Angel Broking Ltd: BSE Sebi Regn No: INB010996539 / PMS Regd Code: PM/INP000001546 / CDSL Regn No: IN - DP - CDSL - 234 - 2004 / NSE Sebi Regn Nos: Cash: INB231279838 / NSE
F&O: INF231279838 / Currency: INE231279838 / MCX Currency Sebi Regn No: INE261279838 / Member ID: 10500 / Angel Commodities Broking Pvt. Ltd: MCX Member ID: 12685 / FMC Regn No: MCX / TCM / CORP / 0037 NCDEX : Member ID 00220 / FMC Regn No: NCDEX / TCM / CORP / 0302
December 16, 2011
23